Tuning Syntactically Enhanced Word Alignment for Statistical Machine Translation Yanjun Ma† Patrik Lambert‡ Andy Way†‡ † National Centre for Language Technology ‡ Centre for Next Generation for Localisation School of Computing, Dublin City University Dublin 9, Ireland {yma,plambert,
[email protected]}
Abstract We introduce a syntactically enhanced word alignment model that is more flexible than state-of-the-art generative word alignment models and can be tuned according to different end tasks. First of all, this model takes the advantages of both unsupervised and supervised word alignment approaches by obtaining anchor alignments from unsupervised generative models and seeding the anchor alignments into a supervised discriminative model. Second, this model offers the flexibility of tuning the alignment according to different optimisation criteria. Our experiments show that using our word alignment in a Phrase-Based Statistical Machine Translation system yields a 5.38% relative increase on IWSLT 2007 task in terms of B LEU score.
1 Introduction Word alignment, which can be defined as a problem of determing word-level correspondences given a parallel corpus of aligned sentences, is a fundamental component in Phrase-Based Statistical Machine Translation (PB-SMT). The dominant approach to word alignment are generative models, including IBM models (Brown et al., 1993) and HMM models (Vogel et al., 1996; Deng and Byrne, 2006). While generative models trained in an unsupervised manner can produce high-quality alignments given a reasonable amount of training data, it is difficult to incorporate richer features into such models. On the other hand, discriminative models are more flexible to incorporate arbitrary features. c 2009 European Association for Machine Translation.
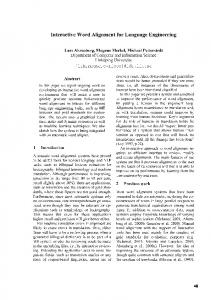
However, these models need a certain amount of annotated word alignment data, which is often subject to criticism since the annotation of word alignment is a highly subjective task. Moreover, parameters optimised on manually annotated data are not necessarily optimal for MT tasks. Recent research attempts to combine the merits of both generative and discriminative models (Fraser and Marcu, 2007), or to tune a discriminative model according to MT metrics (Lambert et al., 2007). In this paper, we introduce a simple yet flexible framework for word alignment. To take the advantage of the strength of generative models, we use these models to obtain a set of anchor alignments. We then incorporate syntactic features induced by the anchor alignments into a discriminative word alignment model. The syntactic features we used are syntactic dependencies. This decision is motivated by the fact that if words tend to be dependent on each other, so does the alignment (Ma et al., 2008). If we can first obtain a set of reliable anchor links, we could take advantage of the syntactic dependencies relating unaligned words to aligned anchor words to expand the alignment. Figure 1 gives an illustrative example. Note that the link (c2 , e4 ) can be easily identified, but the link involving the fourth Chinese word (a function word denoting ‘time’) (c4 , e4 ) is hard. In such cases, we can make use of the dependency relationship (‘tclause’) between c2 and c4 to help the alignment process.
Figure 1: Dependencies for word alignment
Our experiments show that using our word alignment approach in a PB-SMT system can significantly improve the system over a strong baseline. The experiments also show that syntax is beneficial in word alignment. Given that the intrinsic quality of word alignment measured using F-score does not correlate well with PB-SMT performance measured using B LEU, we conducted experiments that can directly optimise the word alignments according to B LEU score. Experiments show that we can achieve higher performance using such an optimisation procedure and our word alignment approach is more flexible in a PB-SMT framework.
2 Syntactically Enhanced Word Alignment Model 2.1
General Model
Given a source sentence C = cJ1 that consists of J Chinese words {c1 , · · · , cJ } and target sentence E = eI1 which consists of I English words {e1 , · · · , eI }, we seek to find the optimal alignment Aˆ such that: Aˆ = argmaxP (A|cJ1 , eI1 )
We can use the asymmetric IBM models for bidirectional word alignment and derive the intersection. Using this approach, we can obtain a set of anchor alignments A∆ = {i|i ∈ ∆}. Subsequently, the anchor model is estimated as follows: ( α if aj = i and i ∈ ∆, p(aj ) = 1−α otherwise. I The parameter α can be optimised on the development set. In our experiments we set α = 0.9. 2.2.2
Syntactically Enhanced Word Alignment The syntactically enhanced model is used to model the alignment of the words left unaligned after anchoring. We directly model the linkage between source and target words using a discriminative word alignment framework where various features can be incorporated. Given a source word cj and the target sentence eI1 , we search for the alignment aj such that: aˆj = argmax{pλM (aj |cJ1 , eI1 , a1j−1 , A∆ )} 1
aj
A
We use a model (1) that directly models the linkage between source and target words similarly to (Ittycheriah and Roukos, 2005). The Chinese-toEnglish word alignment AC→E = {i|aj = i} is modelled as shown in (1). We decompose this model into an emission model and a transition model ( 4). The emission model can be further decomposed into an anchor alignment model (2) and a syntactically enhanced model (3) by distinguishing the anchor alignment from the nonanchor alignment. p(A|cJ1 , eI1 ) =
J Y
p(aj |cJ1 , eI1 , a1j−1 )
1 · pǫ (A∆ |cJ1 , eI1 ) · (2) Z Y p(aj |cJ1 , eI1 , a1j−1 , A∆ ) ·(3)
¯ j∈∆ J Y
p(aj |aj−1 , A∆ )
(4)
j=1
2.2
aj
λm hm (cJ1 , eI1 , aj1 , A∆ , Tc , Te )}
m=1
In this decision rule, we assume that a set of highly reliable anchor alignments A∆ has been obtained, and Tc (resp. Te ) is used to denote the dependency structure for source (resp. target) language. In such a framework, various machine learning techniques can be used for parameter estimation. The feature functions we used are described in section 3. 2.3 Transition Model
(1)
j=0
=
= argmax{
M X
Emission Model
2.2.1 Anchor Word Alignment The anchor alignment model pǫ (A∆ ) aims to find a set of high-precision links. Various approaches can be used for this purpose.
(5)
Given the anchor alignment, the first-order transition probability model ( 4) can be defined as follows: ( 1.0 if ∈ ∆, p(aj |aj−1 , A∆ ) = pˆ(aj |aj−1 ) otherwise. Such a definition implies that an anchor alignment is always believed to be a correct alignment, maximum likelihood estimates obtained on a goldstandard word alignment corpus are used when the current word fj is not involved in an anchor alignment. The estimation of pˆ(aj |aj−1 ) is calculated following the homogeneous HMM model (Vogel et al., 1996). Under this model, we assume that the
probability depends only on the jump width (i−i′ ), in order to make the alignment parameters independent of absolute word positions. Using a set of non-negative parameters {c(i − i′ )}, the transition probability can be written in the form: p(aj |aj−1 , A∆ ) = PI
c(i − i′ )
′′ i′′ =1 c(i
− i′ )
We use the refined model which extends the HMM network with I empty words e2I I+1 and adds parameter p0 to account for the transition probability to empty words (Och and Ney, 2003). If a zero-order dependence is assumed in a transition model, the emission models is the only information to guide the word alignment. 2.4
Model Interpolation
We interpolate the general alignment model (1) as follows: p(A|cJ1 , eI1 ) =
1 · pǫ (A∆ |cJ1 , eI1 )1−λ · Z Y p(aj |cJ1 , eI1 , a1j−1 , A∆ )1−λ ·
¯ j∈∆ J Y
p(aj |aj−1 , A∆ )λ
j=1
We can use factor λ to weight the emission model and transition model probabilities so that the system can be optimised according to different objectives.
3 Feature Functions for Syntactically Enhanced Word Alignment The various features used in our syntactically enhanced model can be classified into two groups: statistics-based features and syntactic features which are similar to those in (Ma et al., 2008) 3.1
Statistics-based Features
The statistics-based features we used include IBM model 1 score, Log-likelihood ratio (Dunning, 1993) and POS translation probability. We choose these features because they are empirically proven to be effective in word alignment tasks (Melamed, 2000; Liu et al., 2005; Moore, 2005). 3.2
Syntactic Features
The dependency relation Re (resp. Rc ) between two English (resp. Chinese) words ei and ei′ (resp. cj and cj ′ ) in the dependency tree of the
English sentence eI1 (resp. Chinese sentence cJ1 ) can be represented as a triple (resp. ). Given cJ1 , eI1 and their syntactic dependency trees TcJ , TeI , if ei is aligned to cj and 1 1 ei′ aligned to cj ′ , according to the dependency correspondence assumption (Hwa et al., 2002), there exists a triple . While we are not aiming to justify the feasibility of the dependency correspondence assumption by proving to what extent Re = Rc under the condition described above, we do believe that cj and cj ′ are likely to be dependent on each other. Given the anchor alignment A∆ , a candidate link (j, i) and the dependency trees, we can design four classes of feature functions. 3.2.1 Agreement features The agreement features can be further classified into dependency agreement features and dependency label agreement features. Given a candidate link (j, i) and the anchor alignment A∆ , the dependency agreement (DA) feature function is defined as follows: 1 if ∃ , hDA−1 = and (j ′ , i′ ) ∈ A∆ , 0 otherwise.
By changing the dependency direction between the words cj and cj ′ , we can derive another dependency agreement feature: 1 if ∃ , hDA−2 = and (j ′ , i′ ) ∈ A∆ , 0 otherwise.
We can define the dependency label agreement feature1 as follows: 1 if ∃ , hDLA−1 = and (j ′ , i′ ) ∈ A∆ ,Rc = Re , 0 otherwise.
Similarly we can obtain hDLA−2 by changing the dependency direction. 3.2.2 Source word dependency features Given a candidate link (j, i) and anchor alignment A∆ , source language dependency features are used to capture the dependency label between a 1
Note that we used the same dependency parser for source and target language parsing.
source word cj and a source anchor word ck ∈ ∆. For example, a feature function relating to dependency type ‘PRD’ can be defined as:
hsrc−1−P RD =
Train
Dev.
1 if ∃ and Rc =‘PRD’,
0 otherwise.
Eval.
By changing the direction we can obtain hsrc−2−P RD . 3.2.3
Target word dependency features
Target word dependency features can be defined in a similar way as source word dependency features. 3.2.4
Target anchor feature
The target anchor feature defines whether the target word ei is an anchor word. hsrc−1−P RD
( 1 = 0
if i ∈ a∆ , otherwise.
Sentences Running words Vocabulary size Sure links Sentences Running words Vocabulary size Sure links Sentences Running words Vocabulary size Sure links
Table 1: Chinese–English word alignment goldstandard corpus statistics 4.1.2
Machine Translation
Training was performed using the default training set (39,952 sentence pairs), to which we added the set devset1 (506 sentence pairs) and devset2 (500 sentence pairs).2 We used devset4 (489 sentence pairs, 7 references) to tune various parameters in the MT system and IWSLT 2007 test set (489 sentence pairs, 6 references) for testing. Detailed corpus statistics are shown in Table 2.
4 Experimental Setting Train
4.1
Data
The experiments were carried out using the Chinese–English datasets provided within the IWSLT 2007 evaluation campaign (Fordyce, 2007). We tagged all the sentences in the training and devset3 using a maximum entropy-based POS tagger, namely M XPOST (Ratnaparkhi, 1996), trained on the Penn English and Chinese Treebanks. Both Chinese and English sentences are parsed using the Malt dependency parser (Nivre et al., 2007), which achieved 84% and 88% labelled attachment scores for Chinese and English (each has 11 dependency labels) respectively. 4.1.1
Word Alignment
We manually annotated word alignments on devset3. Following recent research in measuring word alignment quality for SMT purposes, we set all the word alignment links as sure (S) links (cf. (Fraser and Marcu, 2007)). IWSLT devset3 consists of 502 sentence pairs after cleaning. We used the first 300 sentence pairs for training, the following 50 sentence pairs as validation set and the last 152 sentence pairs for testing. The various statistics for the gold-standard corpus is listed in Table 1.
Chinese English 300 2,231 2,704 636 709 2773 50 445 451 205 212 555 152 1,107 1,149 394 413 1400
Dev. Eval.
Sentences Running words Vocabulary size Sentences Running words Vocabulary size Sentences Running words Vocabulary size
Chinese English 40,958 357,968 385,065 11,362 9,718 489 (7 ref.) 5,717 46,904 1,143 1,786 489 (7 ref.)/489 (6 ref.) 3,166 23,181 862 1,339
Table 2: Corpus statistics IWSLT 2007 data set
4.2 Alignment Training and Decoding In our experiments, we treated anchor alignment and syntactically enhanced alignment as separate processes in a pipeline. The anchor alignments are kept fixed so that the parameters in the syntactically enhanced model can be optimised.3 We used the support vector machine (SVM) toolkit, SVM light4 to optimise the parameters in (5). Our model is constrained in such a way that each 2
More specifically, we chose the first English reference from the 16 references and the Chinese sentence to construct new sentence pairs. 3 Note that our anchor alignment does not achieve 100% precision. Since we performed precision-oriented alignment for the anchor alignment model, the errors in anchor alignment will not bring much noise into the syntactically enhanced model. 4 http://svmlight.joachims.org/
source word can only be aligned to one target word. In SVM training, we transform each possible link involving the words left unaligned after anchoring into an event. Positive examples (aligned pairs) are assigned the target value 1 and negative examples (unaligned pairs) assigned −1. Using this training data, we can build a regression model to estimate the reliability of alignment given a pair of words. The value of functional margin obtained by applying the regression model serves as the emission probability in our word alignment model. For the first-order transition model, we estimate the transition probability on a gold-standard word alignment corpus in training. In decoding, the best alignment path is searched out using a Viterbi-style decoding algorithm. The interpolation factor λ can be optimised on development set. When a zeroorder transition model (a uniform transition distribution) is used, we constrain the emission probability by a threshold t, which is set as the minimal reliability score for each link. Again, t can be optimised according to the development set. The decoding is performed separately in two directions (Chinese-to-English and English-toChinese), and we then obtain the refined alignments as the final word alignment. 4.3 4.3.1
Baselines Word Alignment
We used the G IZA ++ implementation of IBM word alignment model 4 (Brown et al., 1993; Och and Ney, 2003) for word alignment, and the heuristics described in (Koehn et al., 2003) to derive the intersection and refined alignment. 4.3.2
Machine Translation
We use a standard log-linear PB-SMT model as a baseline: G IZA ++ implementation of IBM word alignment model 4,5 the refinement and phraseextraction heuristics described in (Koehn et al., 2003), minimum-error-rate training (Och, 2003), a trigram language model with Kneser-Ney smoothing trained with SRILM (Stolcke, 2002) on the English side of the training data, and Moses (Koehn et al., 2007) to decode. 5
More specifically, we performed 5 iterations of Model 1, 5 iterations of HMM, 3 iterations of Model 3, and 3 iterations of Model 4.
4.4 Evaluation We evaluate the intrinsic quality of the predicted alignment A with Precision, Recall and the balanced F-score with α = 0.5 (cf. (Fraser and Marcu, 2007)). Recall =
|A ∩ S| |A ∩ S| Precision = |S| |A|
F-score(A, S, α) =
1 +
α P recision(A,S)
1−α Recall(A,S)
Research has shown that an increase in AER does not necessarily imply an improvement in translation quality (Liang et al., 2006) and vice-versa (Vilar et al., 2006). Hereafter, we use a Chinese– English MT task to extrinsically evaluate the quality of our word alignment. The translation output is measured using B LEU (Papineni et al., 2002).
5 Experiments 5.1 Word Alignment Results We performed word alignment bidirectionally using our approach to obtain the refined alignments (Koehn et al., 2003) and compared our results with two strong baselines based on generative word alignment models. The results are shown in Table 3. We can see that both the syntactically enhanced model based on HMM intersection anchors and on IBM model 4 anchors achieved higher Fscores than the pure generative word alignment models. It is also can be seen that zero-order syntactic models are better in precision and firstorder models are superior in recall. The best result achieved 2.99% relative increase in F-score compared to the baseline when we use IBM model 4 intersection to obtain the set of anchor alignments. model Model 1 +Syntax-zero-order +Syntax-first-order HMM refined +Syntax-zero-order +Syntax-first-order Model 4 refined +Syntax-zero-order +Syntax-first-order
Precision 65.98 80.71 72.84 73.80 83.65 77.17 75.87 84.59 80.21
Recall 70.64 69.93 73.36 73.86 70.14 76.07 78.14 74.50 77.57
F-score 68.23 74.93 73.10 73.83 76.30 76.62 76.99 79.29 78.87
Table 3: The performance of our syntactically enhanced word alignment approach
5.2
Machine Translation Results
Table 4 shows the influence of our word alignment approach on MT quality.6 From Table 4, we can see that our zero-order syntactically enhanced model based on Model 4 anchors achieved 1.82 absolute B LEU score (5.38% relative) improvement compared to its baseline counterpart on the test set, which is statistically significant (p