The estimated latent variables are filtered and the one that best ... object. In existing web image search engines, however, the set of high ranked search.
Typicality Ranking of Images Using the Aspect Model Taro Tezuka and Akira Maeda College of Information Science and Engineering Ritsumeikan University {tezuka, amaeda}@media.ritsumei.ac.jp
Abstract. Searching images from the World Wide Web in order to know what an object looks like is a very common task. The best response for such a task is to present the most typical image of the object. Existing web-based image search engines, however, return many results that are not typical. In this paper, we propose a method for obtaining typical images through estimating parameters of a generative model. Specifically, we assume that typicality is represented by combinations of symbolic features, and express it using the aspect model, which is a generative model with discrete latent and observable variables. Symbolic features used in our implementation are the existences of specific colors in the object region of the image. The estimated latent variables are filtered and the one that best expresses typicality is selected. Based on the proposed method, we implemented a system that ranks the images in the order of typicality. Experiments showed the effectiveness of our method. Keywords: Image retrieval, Typicality, Bag-of-features, Generative model
1 Introduction One important use of web-based image search is to know the visual characteristics of an object. In such a case, what the user wants is the most “typical” look of the object. In existing web image search engines, however, the set of high ranked search results contain images that are not typical. The goal of this paper is to propose and evaluate a method that extracts typical images from the result of web image search by applying a generative model, a type of probabilistic model. Although typicality is a difficult concept to capture, but in this paper we define it as follows: Definition: An image I is a typical image for query Q if the word Q is an appropriate label for I, given that the evaluator has enough knowledge on the object referred by Q. Our proposed method estimates “aspects” expressed in a set of images, and select an aspect assumed to express typicality. We then rank images using conditional probability. One of the characteristics of our method is that it expresses typicality using discrete probabilistic variable. Many models for classification and dimension reduction use continuous variables, including k-means and PCA (principal component analysis). Our model consists of discrete variables only. In this sense it is an intrinsically symbolic approach. The method can be used to obtain a large set of images with labels. The set
has a wide range of applications. For example, it can be used to create a general use visual encyclopedia. It can also be utilized in a car navigation system by providing the user with the exterior image of the destination. One of the future goals is to build a general task image recognition engine, which gives the name of an object when an arbitrary image is given. Attaching correct labels to a large set of images obtained from the Web would contribute in building such system. Based on our proposed method, we implemented a system and named it “Typi” after “typicality”. The paper consists of the following sections. Section 2 gives related work. Section 3 describes our method in detail. Section 4 illustrates implementation, and section 5 describes the result of evaluation. Section 6 is the conclusion.
2
Related Work
There are a number of web-based image search engines available now, for example Google Image Search, Yahoo! Image Search, and Bing Images. There have also been works of applying object identification to images on the Web, for example WebSeek by Smith and Chang[1]. Recently, bag-of-features approach, originated from bag-of-words approach used in text information retrieval, is gaining much attention. Vogel and Schiele used combination of local features to represent higher order concepts such as objects, and evaluated precisions of image retrieval methods[2]. Fei-Fei and Perona used a generative model used in text analysis to classify natural scene images[3]. There has been some research on finding typical images of objects. Kennedy and Naaman proposed a method of extracting typical images of landmarks[4]. In addition to using visual features, their method used geotags, location metadata attached to images contributed on image sharing sites. In contrast, our method relies on visual features alone. Wu and Yang proposed a system for finding street landmarks such as signs based on extracting object fingerprints from images[5].
3
Method
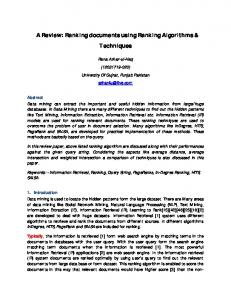
In this section, we describe our proposed method. Figure 1 shows the flow of the system.
Fig. 1. System flow for extracting typical images
2
Our previous paper describes the methods of extracting object regions in more details[6]. The rest of the section mainly describes the method of selecting the “top aspect” assumed to express typicality. 3.1 Aspect model The result of web image search usually contains various objects that are relevant to the query. For example, for a query “iris”, search results would contain a type of wildflowers and a part of eyeball. Also, there are irises with various colors, ranging from purple to yellow. There are also images that show a field with iris or a part of iris. Such variety can be well expressed using a mixture model, which is a part of probabilistic models. We use the aspect model, a model consisting of discrete observable and latent variables. The reason for applying this model is that we assume typicality to be expressed by a mixture of typical features. In the case of iris, for example, object region can be purple, yellow, or a mixture of red and white. The aspect model[7] is a model that assumes an observed pair of discrete features (x, y) (dyadic data) is conditionally independent under a discrete latent variable z. Its graphical model is illustrated in Figure 2.
Fig. 2. Graphical model for aspect model
x and y are observable variables, and z is a latent variable. Both are discrete. Observed data consists of pairs (x, y), which is called dyadic data. N is the size of data. Based on the graphical model, we obtain the following conditional independence. It can be considered as the generative model of (x, y). p(x, y, z) = p(x|z)p(y|z)p(z)
(1)
An aspect z is the first variable to be generated in the model. x and y are generated under conditioned probability p(x|z) and p(y|z). If we express the observed frequency of the ∏ pair (x, y) by n(x, y), the log-likelihood of the dyadic data L(x, y) is expressed as ln x,y p(x, y)n(x,y) . Based on the above mentioned conditional independence, we can transform the equation as follows. We maximize L(x, y) using the EM algorithm.
L(x, y) =
∑ x,y
n(x, y) ln p(x, y) =
∑ x,y
3
n(x, y) ln
∑ z
p(x|z)p(y|z)p(z)
(2)
One practical example where the aspect model is used is on analyzing a set of documents covering different topics. When a term t appears on a document m, it is considered as a dyadic data (t, m). The data is generated from the latent variable z, which expresses the topics. In this paper, x indicates an image and y indicates and image feature described in the next subsection. 3.2
Image features
In our proposed method, we model typicality as a mixture of image features. In this paper, we focus on color features, but in the future work it would be extended to other features such as textures and shapes. In order to express features as a vector, we divide color space into color regions. From now on, we refer to each color region as a “color”. Similar colors are grouped into a component of the vector. Hue is divided into finer details, since it is usually intrinsic to the object, while brightness and saturation varies depending on lighting. Colors with low brightness is considered as black, and those with low saturation is considered as either dark gray, light gray, or white. For each color, the system counts how many pixels exist with that color, and create an HSV vector having the numbers as its components. The fact that an image feature y appeared in the object region of an image x is considered to be an observed datum (x, y). The object region is extracted using border tracing. 3.3
Extracting an aspect expressing typicality
An aspect z with higher p(z) is more likely to be observed, therefore considered to be more important in the image set. p(y|z) indicates the probability that an image feature y is generated from an aspect z. If the aspect captures the typical characteristics of an object, it is likely to consist of several colors, rather than of a single color. In a pre-experiment, we observed that aspects with high probability on a single color are less likely to express typicality. On the other hand, if it generates all colors equivalently, it does not have any characteristics, and is not appropriate as an expression of typicality, even if it has high p(z). We therefore introduce entropy H[p(y|z)] for filtering such inappropriate color. Aspects are sorted by H[p(y|z)], and those that comes below or over threshold ranks are removed. This filtering can be expressed as follows. α|Z| < rank(H[p(y|z)]) < β|Z|
(3)
|Z| is the number of the aspects, rank(H[p(y|z)]) is the rank of an aspect z when sorted by the decreasing order of entropy H[p(y|z)]. 0 ≤ α, β ≤ 1 are the coefficients for determining the range that the aspects are used. From the set of aspects that fulfilled the condition on entropy indicated by Expression 3, we select the aspect with the highest p(z) as the “top aspect”. Using this aspect, the “typicality” of an image is calculated as follows. ∑ p(x|zm )p(zm ) (4) typicality(x, m) = zm
4
p(x|z) indicates the probability that an image x is created from an aspect z. p(z) is the probability that the aspect z appears. zm refers to the m-th aspect when sorted in the decreasing order of p(z). p(y|z) indicates the probability that an image feature y occurs from an aspect z.
4
Implementation
In this section, we describe implementation of “Typi”, a typical image retrieval system based on our proposed method.
4.1
System structure
Typi was implemented using C#. It consists of modules for image collection, feature extraction, parameter estimation, and evaluation. API for Google Image Search[8] is used for collecting images. Since the API provides the search engine’s ranking on images, we use it to compare with our method in the evaluation section.
4.2
Parameters
We have used the following parameters for implementation. Colors black, dark gray, light gray, and white is defined using brightness V and saturation S. If the brightness is below 0.2, it is considered black. In the region that the saturation is below 0.2, if the brightness is between 0.2 and 0.6, it is dark gray. If the brightness is between 0.6 and 0.8, it is light gray. If the brightness is over 0.8, it is white. For the remaining region, brightness is divided into 3, saturation into 3, and hue into 18. The resulting HSV vector has (18 × 3 × 3) + 4 = 166 components. We have chosen these parameters after empirical tests on various possibilities. For filtering aspects using entropy, we used α = 12 and β = 45 . The number of values that the aspect z can take is 10. This is set based on a pre-experiment indicating that when 100 images obtained as search results were clustered, the number of groups consisting of more than 2 elements are usually less than 10. Criteria for judging convergence are that the difference is below 10−5 , or repeated the process over 300 times. Since the aspect model has local maxima, we do 5 trials starting from different initial values. We use the set of parameters with the highest loglikelihood.
4.3
Interface
Figure 3 is a system snapshot. Results of search engine’s ranking and of our method are presented. Figure 4 is the mode for evaluation. The evaluator can click on the images and classify them into correct and incorrect ones, enabling evaluation with fewer loads. 5
Fig. 3. Snapshot of “Typi” interface
5 5.1
Fig. 4. Interface for evaluation
Evaluation Evaluation method and target
For performing experiments, we used 20 queries from a category “wildflowers”. 100 images were collected for each query, resulting in 2,000 images in total. We evaluated averaged and individual top-k precisions. Table 1 illustrates the queries used in the experiment. In case of query consisting of two or more words (such as “scarlet pimpernel”), the query was put into double quotes, enabling phrase search. Table 1. Queries used for experiments dandelion, daisy, buttercup, iris, water arum, hawkweed, calliopsis, columbine, searocket, pale flax, harebell, wild radish, scarlet pimpernel, lady’s slipper, baby blue eyes, chinese houses, ice plant, franciscan wallflower, clematis, forget me nots
Since objects referred by these queries have typical shapes and colors, it is easy to judge correct and incorrect images in the evaluation. In order to reduce processing time, the system uses scaled down images provided by the search engine, rather than the original images available on the Web. Therefore the maximum size of the images is 150 × 150 pixels. 5.2
Evaluation criteria
In order to judge whether an image is typical or not, we need a unified criterion. As mentioned in Section 1, we defined “a typical image I of a query Q” by “the term Q is an appropriate label for the image I”. Therefore, it is a necessary condition that the object specified by the query appears in the image. 6
Fig. 5. Search engine ranking for “iris”
If an image contains more than one object and it is not sufficient in knowing the object’s visual characteristics, we considered it to be incorrect image. For example, in case of a query “dandelion”, the image should have a dandelion of large enough size that the evaluator can identify it as a dandelion. In evaluation, we assume that the evaluator has enough knowledge on the object being queries. 5.3 Ranking example In this subsection, we exemplify the top-ranked images by the rankings of a search engine and the top aspect. In the figures 5-8, images are ordered from top-left, going right and then down. We added “x” beside images that were judged to be incorrect under our evaluation scheme. Figures 5-6 are the results for a query “iris”. Since iris also means a part of an eyeball, top ranked images by search engines contained these pictures (10th and 15th images). This is one weakness of the text-based ranking mechanism used by the image search engine. The images obtained by our method contain more correct images. The precision is higher than that of the search engine. We explain evaluation scheme described in subsection 5.2 using this example. The 4th image in Figure 5 is a collection of flowers. Attaching a label “iris” to it is not appropriate, so we consider it as an incorrect image. The 10th image has a flower bed, but since the label “iris” is not appropriate for it either, so we judge it to be an incorrect image. Figures 7-8 are the results for a query “chinese houses”. Since “chinese houses” can refer to Chinese buildings, the result of search engine contains many such images. On the other hand, the ranking by the top aspect contains flowers mainly, resulting in a high precision. 5.4 Top-k precision by categories We performed experiments using 100 images obtained by an existing web image search engine. Using the search engine’s ranking and our proposed method, we evaluated the top-k precisions. We used the result of Google Image Search for obtaining the search engine’s ranking [9]. The result is illustrated in Figure 9. 7
Fig. 6. Top aspect ranking for “iris”
Fig. 7. Search engine ranking for “chinese houses”
Fig. 8. Top aspect ranking for “chinese houses”
Since the original set consists of 100 images for each query, top-100 precision is the ratio of correct images to the whole set. In this case, the value is 0.58. While the top-5 precision of the search engine’s ranking is 70%, the ranking by the top aspect has 79%. For top-30 precision, the search engine’s ranking has 66% and our method has 76%. The dotted line in Figure 9 indicates the top-k precision of the ranking obtained from the aspect with highest p(z). The graph also shows that the proposed method has higher precision than the method that does not filter aspects by entropy in the way indicated by Expression 3. 8
Precision
0.9 0.8 0.7 0.6 0.5 0.4 0.3
Top aspect Without filtering Search engine
0.2 0.1 0.0 5
10
20
k
30
40
50
100
Fig. 9. Average top-k precisions for 20 queries
One strong point of our approach is that it is based on the probability theory. For example, since all values are actually parameters of distributions, threshold values can be set with a probabilistic basis. 5.5
Processing time
We have measured processing time necessary for the extraction of object region and the construction of feature vectors. We used Intel Core2 Duo 2.00GHz 2GB RAM for the experiment. Figures 10 - 11 are histograms indicating how many images required a certain amount of time for processing. The unit is in milliseconds. For the object region extraction, the mode is at around 40 milliseconds. There are some outliers, but they fall within triple the time of the mode. For the construction of feature vectors, the mode is at around 25 milliseconds. Outliers fall within double the time of the mode. The average time required for learning the aspect model for 100 images was 71.1 milliseconds.
6
Conclusion
In this paper, we proposed a method that ranks web image search result in the order of typicality, by extracting the top aspect. Our present implementation uses color features only, but we plan to use more complex image features in future work. In the evaluation, we used wildflowers, which are objects that have strong color characteristics. There are also objects that do not have strong color features. In the future work, we plan to use shapes and textures in addition to color, to deal with such objects.
Acknowledgments This work was supported in part by a MEXT Grant-in-Aid for Strategic Formation of Research Infrastructure for Private University “Sharing of Research Resources by 9
Fig. 10. Time for region extraction
Fig. 11. Time for feature vector construction
Digitization and Utilization of Art and Cultural Materials” (Grant Number: S0991041) and MEXT Grant-in-Aid for Young Scientists (B) “Object Identification System using Web Image Collection and Machine Learning” (Leader: Taro Tezuka, Grant Number: 21700121).
References 1. J. R. Smith and S. Chang, Visually searching the Web for content, IEEE Multimedia, Vol. 4, No.3, pp.12–20, 1997. 2. J. Vogel and B. Schiele, On Performance Characterization and Optimization for Image Retrieval, in Proceedings of the 7th European Conference on Computer Vision, pp. 51–55, Copenhagen, Denmark, 2002. 3. L. Fei-Fei and P. Perona, A Bayesian Hierarchical Model for Learning Natural Scene Categories, in Proceedings of the IEEE International Conference on Computer Vision and Pattern Recognition 2005, pp. 524–531, San Diego, California, 2005. 4. L. Kennedy and M. Naaman, Generating diverse and representative image search results for landmarks, in Proceedings of the 17th International World Wide Web Conference, pp. 297– 306, Beijing, China, 2008. 5. W. Wu and J. Yang, Object fingerprints for content analysis with applications to street landmark localization, in Proceedings of the ACM International Conference on Multimedia 2008, pp. 169–178, Vancouver, Canada, 2008. 6. T. Tezuka and A. Maeda, A Hierarchical Model Approach for Measuring Typicality of Images, in Proceedings of the 4th International Conference on Ubiquitous Information Management and Communication (ICUIMC2010), Suwon, Korea, Jan. 2010. 7. T. Hoffman, J. Puzicha and M. I. Jordan, Learning from Dyadic Data, Advances in Neural Information Processing Systems, Vol. 11, pp. 466–472, 1999. 8. API for Google Image Search, http://www.codeproject.com/KB/IP/google image search api.aspx 9. Google Image Search, http://images.google.com
10