The standard procedure for testing the electrical insulation system of generator stator windings involves measurement of the insulation resistance and the ...
F
E
A
T
U
R
E
A
R
T
I
C
L
E
Unconventional Diagnostic Methods for Testing Generator Stator Windings Key Words: dielectric polarization, dielectric losses, frequency domain analysis, rotating machine insulation testing, partial discharges Introduction The technical diagnosis of electric machines is a necessary tool for condition evaluation and risk assessment. Normally, condition- and risk-based maintenance strategy is applied to high-value power equipment such as generators [1]. The aim of the technical diagnostics is to detect any anomalies in the electrical insulation system. In several standards there exist specifications for the test procedure and evaluation of the results. Sometimes additional recommendations have been applied as criteria for acceptance or replacement. The standard procedure for testing the electrical insulation system of generator stator windings involves measurement of the insulation resistance and the dielectric dissipation factor (tan δ), and analysis of the partial discharge (PD) activity. Sometimes a withstand test (Hipot) is applied. Visual inspection should also be made along with the measurements. These tests are carried out following specified routines and procedures. The insulation resistance is measured according to IEEE 43 [2] for dc, and tan δ according to IEEE 286 [3] for ac. The partial discharge activity is investigated following IEEE 1434 [4] and IEC 60270 [5]. Test voltages are not specified in these standards; however, rotating machines are usually tested at their operating voltages. The aim of this paper is to compare the results of conventional methods for testing the insulation of generator stators with those of recently developed, so-called, unconventional methods. More specifically, insulation resistance, tan δ, and partial discharge activity are compared.
Test Object and Measuring Equipment The work was performed on-site on several hydro-generators, and in the laboratory on stator bars. The results for one particular generator are presented in this paper. It was commissioned in 1994 in a storage power station in the south of Austria, and is rated at 20 MVA and 6.3 kV. The insulation system is a global vacuum pressure impregnation (VPI) system with continuous groundwall insulation. This winding is constructed with an inner and outer corona protection system. The glow-protection var18
Christof Sumereder, Michael Muhr Graz University of Technology, Austria
Michael Marketz, Christian Rupp KELAG, Austria
Michael Krüger OMICRON, Austria
Innovative diagnostic methods provide detailed information on the condition of high voltage generator stator windings.
nish at the winding heads leads to a constant voltage drop, which should reduce the probability of surface discharges. The on-site measurements were made at the beginning of the annual routine maintenance of the generator. (Diagnostic measurements were made every three years on older generators and every five years on new generators). Visual inspection of the winding showed little pollution and normal signs of wear. The following equipment was used for the measurements: • transportable transformer with compensation and electronic regulation, type AC resonance test system 350 kVA, 30-50 kV • resonance test system with integrated capacitance measuring device, type CPC, 100V-12 kV • dielectric response analyzer, type DIRANA • dc insulation tester 5 kV, type MIT 520 • loss factor and capacitance measuring device, type LDV-6
0883-7554/07/$25/©2009IEEE
IEEE Electrical Insulation Magazine
• partial discharge measuring device, type LDS-6 • partial discharge measuring device, type MPD 600
Insulation Resistance vs. Dielectric Response Measurement The procedure for measuring the insulation resistance can be found in [2]. A dc test voltage which depends on the rated voltage of the windings is applied to the totally depolarized winding as a step function for 10 minutes. Because of various factors, the resulting current decreases at a rate determined by the condition of the insulation system. The total current has four components, namely absorption, conduction, leakage, and charging of the capacitance of the winding. The latter can usually be neglected. The leakage component is influenced by the surface condition and humidity of the end windings, whereas the conduction component depends on the volume resistance of the groundwall insulation, and therefore temperature is an important factor. Finally, the absorption component is driven by the polarization mechanisms in the solid insulation system. What information on the condition of the windings can we extract from conventional insulation resistance measurements? Consider first the polarization index (PI). According to [2], the ratio between the resistance measured 10 min and 1 min after application of the dc voltage should be greater than 2.0. This requirement is based on the rate of decay of the dominant leakage and conduction components of the total current with time. Dry and clean insulation systems have higher PI values. It has been shown [6] that new windings can show larger PI depending on
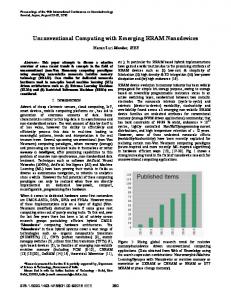
the choice of material, construction of the field grading, and the use of corona protection tape in the end windings. The dryness of winding insulation can be evaluated using the procedures outlined in [7] and [8]. The time constant τ10 of the insulation system is given by
τ10 = R10 × C0,2
(1)
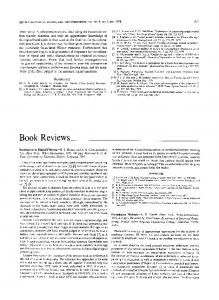
where R10 is the insulation resistance measured after 10 minutes, and C0,2 is the capacitance of the winding measured at 20% of the rated voltage. Figure 1 shows that τ10 decreases approximately exponentially with increasing temperature. The dryness border was defined empirically, using on-site generator measurements [7]. To verify the dryness of the winding system, an unconventional dielectric response measurement was made. Normally, such measurements are used to determine the water content of paper-oil insulation systems in transformers [9] or cables [10]. Polarization-depolarization current (PDC) and frequency domain spectroscopy (FDS) measurements were made. The advantages and disadvantages of these methods have been discussed in [11] and [12]. An innovative algorithm [13] applies FDS at high frequencies and PDC at low frequencies, yielding a plot of tan δ as a function of frequency in much less time than that required for other methods. The results of the combined FDS/PDC measurements are presented in Figure 2. The dotted lines represent the PDC data transformed from the time to the frequency domain. The FDS method was used at frequencies above 0.1 Hz. How can the above data be evaluated? There are no published standards for dielectric spectroscopy measurements on dry or humid generator windings. Only a few dielectric response investigations on the influence of humidity on generators have been published [14], [15]. The results show that tan δ over the relevant frequency spectrum is a more reliable dryness indicator than PI, and that the ratio of the capacitances measured at 50 Hz and 10 mHz can be as high as 10 for wet windings. In order to study further the influence of the relative humidity (RH) of the cooling air, a series of tests was carried out on
Figure 2: On-site tan δ values for RR asphalt (blue) and VPI Figure 1: Insulation time constant τ10 of stator windings as a resin (red) generator insulation, as a function of frequency, obfunction of winding temperature ϑSLOT [8] tained using FDS (solid) and PDC (dotted) measurements: September/October 2009 — Vol. 25, No. 5
19
Figure 3: Temperature and humidity dependence of tan δ for generator bars, as a function of frequency: lower blue line: 25°C at 27% RH, upper blue line: 25°C at 54% RH, lower green line: 35°C at 21% RH, upper green line: 35°C at 54% RH, lower red line: 45°C at 17% RH, and upper red line: 45°C at 52% RH
spare bars under laboratory conditions. The bars were stored in a climate chamber and measurements were made at several predetermined temperature and humidity values. Figure 3 shows the results of the PDC and FDS measurements. Tan δ falls approximately exponentially with increasing frequency; earlier investigators [16], [17] reported an exponential increase with rising temperature. A small difference between very dry bars (humidity < 20%) and medium dry bars (humidity ≈ 50%) was observed. The tan δ values at net frequency for dry bars were approximately 4% lower than those measured at high humidities. It will be seen that tan δ varies smoothly with frequency in all samples; perhaps the influence of volume resistance is dominant for RH values under approximately 60%. The surface resistance is more important at high humidity values [18]. To investigate the behavior at high RH the humidity of the air in the climate chamber was increased to 90%. It was observed that tan δ increases significantly at low frequencies (see Fig. 4). In Figure 4, tan δ values for dry and very humid conditions are shown. The gradient of the high humidity plot is much greater than that under dry conditions. (Tan δ at 50 Hz is about 0.018 up to 54% RH, but 0.068 at higher humidity). Because resin insulation systems are not hygroscopic, the generator bars cannot absorb large amounts of water vapor. Thus, the increase in tan δ with increasing humidity can only be due to an increased surface leakage current.
Insulation Testing: Parallel Resonance System (Fixed Frequency) Versus Series Resonance System (Variable Frequency)
Figure 4: Tan δ for humid and dry generator bars, as a function of frequency. Green and red line: dry conditions. Blue line: 90% RH, indicating a dominant surface resistance (all measurements at 35°C)
Test systems utilizing series and parallel resonance are commercially available. The problem with series resonance circuits is that the test frequency depends on the capacitance of the object being tested. For this reason a compensation device consisting of additional parallel capacitors has to be installed in order to bring the prescribed test frequency close to 50/60 Hz. In Figure 5, the equivalent circuits of parallel and series resonance systems are shown.
Figure 5: Parallel and series resonance test circuit 20
IEEE Electrical Insulation Magazine
Figure 6: Tan δ for the 20MVA/6.3kV generator at 50 Hz, as a function of test voltage. Black line: all phases in parallel. Colored lines: each phase separately. Conclusions drawn from measurements at frequencies differing significantly from the grid frequency may not be valid at the grid frequency. In [19] and [20], two generators were investigated using a series resonance system, but check measurements at grid frequency were not carried out. It is known that tan δ varies with frequency, possibly because of the design and materials of the insulation systems. A direct comparison between both test systems was carried out on the generator chosen for the present study. Normally tan δ is measured while the test voltage is raised to 120% of the rated voltage in 10 to 20% steps. If the values vary smoothly, the insulation system is considered to be in good condition. Systems aged by operation usually show a change in slope at the partial discharge inception voltage (PDIV). Because of ionization effects at inhomogeneities in the groundwall insulation, PD causes additional dielectric losses, which are detected. A typical result is shown in Figure 6. For voltages up to 50% of the rated voltage, no PD occurs and tan δ varies smoothly. At higher voltages, PD occurs and tan δ increases more rapidly. Single windings show almost identical behavior. The results are below the limits specified in the standard [3], and therefore the winding may be considered to be in good condition.
Figure 7: Resonance behavior of winding and voltage source
September/October 2009 — Vol. 25, No. 5
Figure 8: Tan δ for the 20MVA/6.3kV generator at 62 Hz, as a function of test voltage.
Figure 9: The dependence of tan δ on test frequency Before the measurements with the series test circuit were begun, the resonance behavior of the whole generator winding was recorded, in order that the correct frequency compensation could be applied. In Figure 7, the resonance curve of the winding and the source is shown. The resonance frequency is 62 Hz. The voltage behavior of the winding at 62 Hz is shown in Figure 8. Up to the rated voltage, the behavior is very similar to that at 50 Hz, the deviation being less than 1%.
Figure 10: Delta tan δ of one phase as a function of test voltage: red dotted line at 50Hz, blue line at 62Hz 21
Table 1. Results of PD Measurements at rated voltage QIEC [pC]
Neutral Point
Network Point
Single mode system
2.121
1.995
Multi mode system
4.485
2.423
Tan δ was measured over the range 30 to 400 Hz. The results are shown in Figure 9. The highest gradient occurs at low frequencies, indicating that tan δ varies rapidly near the grid frequency and therefore the data at the test frequency must be corrected. An important parameter for evaluation of the condition of a stator winding is the power factor tip-up (delta tan δ), defined as the increase in tan δ between measuring intervals. Figure 10 shows the results for one phase of the tested generator at 50 and 62 Hz. It can be seen that the tip-up is not dependent on the test frequency.
Partial Discharge Measurement: Single Mode Versus Synchronous System
Figure 11: Wiring diagram for PD measurement (upper: conventional; lower: multi synchronous)
The conventional partial discharge test system generates the measuring signal by using a coupling capacitance and transforming the analog signal into a quadripole. (A quadripole is a measuring impedance which converted the decoupled current pulses into equivalent voltage signals). The test circuit complies with IEC 60034-27, as specified in IEC 60270 or IEEE 1434. Normally the coupling capacitance is connected in parallel because of the fixed grounding of the generator stator. During on-site PD measurements of generators, the windings are investigated on both sides, i.e. at the neutral point and at the winding line ends. For this reason, conventional PD measurements of each phase have to be done separately [21]. Using a
Figure 12: Results of PD measurement. Left: single-mode system fingerprint. Right: multi-mode system fingerprint. 22
IEEE Electrical Insulation Magazine
An example of the 3PARD diagram is given in Figure 13, which was obtained from an off-line measurement. The sensors are connected to the three phases U, V, W (network side) and the PDs are measured synchronously. It can be seen that the highest PD level is close to Phase V (dark red color area). In an advanced application, single areas can be scanned and the frequency spectrum analyzed. In this way, the type of PD can be determined and its origin located.
SUMMARY
Figure 13: Three-phase amplitude relation diagram.
recently developed PD test system [22], a synchronous measurement of several quadripoles is possible [23]; thus the signal from the beginning and end of the winding can be obtained in one measurement. In the present test series, the generator was measured using both systems, i.e., the conventional and the multisensor device. The standard frequency limit of conventional broadband test systems is in the range 100 kHz to 1 MHz. In Figure 11, the schematic wiring diagram of each PD measurement circuit is shown. A coupling capacitor CKX (2 nF) is necessary for each quadripole. In the multi-synchronous system, all coupling units are connected to the PC by a fiber optic cable, so that fewer grounding problems arise. In Figure 12, the test results of phase U at the rated voltage are shown: on the left is the fingerprint of the single-mode system, and on the right that of the multi-mode system. Partial discharge activity at rated voltage is expressed in pC (the QIEC values shown in Table 1). The fingerprints are very similar. Both show a normal distribution of internal discharges from delaminated insulation. The PD patterns at the network side show low level internal and slot discharge activity. Some typical PD patterns are presented in [24]–[26]. The QIEC levels on the network side are similar, but differ considerably at the neutral point (Table 1). The discrepancy is probably caused by differences in bandwidth, equivalent circuit, and calibration signal. One of the advantages of the synchronous test system is the three-phase amplitude relation diagram— 3PARD [26]. Using this feature, the results of up to three PD sensors can be displayed as synchronous vectors on one phase diagram. The origin of PD can then be located easily by zooming into a specific region of the frequency spectrum. By energizing the generator with a single-phase source, and connecting the other phases in parallel with the neutral point (see Fig. 11), a phase shift caused by a distributed capacitance can also be observed using the 3PARD diagram.
September/October 2009 — Vol. 25, No. 5
This paper presented a comparison of different methods of measuring insulation resistance and tan δ (dissipation factor), and of documenting partial discharge activity. The measurements were made on several service-aged generators. The results for one in-service generator, obtained between service inspections, are discussed in detail. Comparing classical insulation resistance measurements and the dielectric response behavior in the frequency domain, good agreement is found. With the insulation time-constant, the dryness can be determined relatively. In the case of resin-impregnated insulation systems, additional investigations are required to determine the humidity absolutely. The determination of tan δ using various test systems and measuring methods was carried out on-site. Because tan δ is frequency- and temperature-dependent, the results of series resonance circuit measurements must be modified by correcting for the difference between the measurement frequency and the power frequency. The results obtained using various PD-test systems depend on bandwidth and the circuit configuration. The multi-synchronous system has the significant advantages that the PD activity at several points can be monitored in one measurement, and the three-phase amplitude relation diagram makes it easy to identify the PD source. However, the calibration process is lengthy, so little time is saved overall, and a full set of quadripoles and coupling capacitors is needed for each channel.
REFERENCES
[1] M. Marketz, C. Rupp, and H. Egger, “Risk-based maintenance and replacement strategy for generators in storage power plants,” presented at Hydro 2008, Ljubljana, Slovenia. [2] IEEE Recommended Practice for Testing Insulation Resistance of Rotating Machinery, IEEE Std 43-2000, 2000. [3] IEEE Recommended Practice for Measurement of Power Factor Tip-Up of Electric Machinery Stator Coil Insulation, IEEE Std 286-2000, 2000. [4] IEEE Trial-Use Guide to the Measurement of Partial Discharges in Rotating Machinery, IEEE Std 1434-2000, 2000. [5] High-Voltage Test Techniques—Partial Discharge Measurements, IEC 60270-2000, 2000. [6] T. Klamt, “Corona Protection of high-voltage stator windings of hydro generators,” presented at Hydro 2008, Ljubljana, Slovenia. [7] W. Zwicknagl, “Zur Frage der Bestimmung und Beurteilung des Feuchtigkeitsgehalts der Isolierung von Generator—Hochspannungswicklungen,” Doctoral thesis, Graz University of Technology, 1965. (in German) [8] Empfehlungen für die Zustandserfassung der Aktivteile Rotierender Elektrischer Maschinen, 2nd ed., Vienna, Austria: Österreichischer Verband für Elektrotechnik, 1990. [9] T. Leibfried and A.J. Kachler, “Insulation diagnostics on power transformers using the polarisation and depolarisation current (PDC) analysis,” presented at Int. Symp. Electrical Insulation 2002, Boston, MA.
23
[10] W. S. Zaengl, “Dielectric spectroscopy in time and frequency domain for HV power equipment (transformers, cables etc.),” presented at Int. Symp. High Voltage Engineering 2001, Bangalore, India. [11] M. Koch, S. Tenbolen, M. Krueger, and A. Kraetge. “Improved moisture analysis of power transformers using dielectric response methods,” presented at MatPost07–3rd European Conference on HV & MV Substation Equipment, Lyon, France. [12] A. Bouaicha, I. Fofana, M. Farzaneh, A. Setayeshmehr, H. Borsi, E. Gockenbach, A. Beroual, and N. T. Aka, “Dielectric spectroscopy techniques as quality control tool: A feasibility study,” IEEE Electr. Insul. Mag., vol. 25, no. 1, pp. 6–14, Jan./Feb. 2009 [13] A. Akbari, A. Setayeshmehr, M. Farahani, H. Borsi, and E. Gockenbach, “A software technique for transforming dielectric data from time domain to frequency domain for insulation diagnosis of power transformers,” presented at Int. Symp. High Voltage Engineering 2007, Ljubljana, Slovenia. [14] S. A. Bhumiwat, “Application of polarisation depolarisation current (PDC) technique on fault and trouble analysis of stator insulation,” presented at CIGRE SCA1&D1 Joint Colloquium, 2007, Gyongju, Korea. [15] S. A. Bhumiwat, “Practical experiences on condition assessment of stator insulation using polarisation/depolarisation current techniques,” presented at CIGRE Session 2008, Paris, France. [16] C. Sumereder and M. Muhr, “Humidity absorption of generator bars,” presented at Int. Conf. Properties and Applications of Dielectric Materials 2006, Bali, Indonesia. [17] A. Küchler, “Hochspannungstechnik”, page 265, 3rd ed. Berlin [u.a.]: Springer, 2009, ISBN 978-3-540-78412-8. [18] M. Muhr, R. Schwarz, and C. Sumereder, “Evaluation of the dissipation factor under different environmental conditions,” presented at Int. Symp. High Voltage Engineering 2007, Ljubljana, Slovenia. [19] W. Hauschild, P. Coors, J. Weidner, and P. Gradinarov, “Diagnostische Prüfungen an Ständerwicklungen großer rotierender Maschinen mit AC Resonanzprüfsystemen variabler Frequenz,” presented at ETG-Fachtagung Diagnostik Elektrischer Betriebsmittel 2004, Köln, Germany. [20] H. Michitsch and J. Spiegelberg, “High voltage test of large rotating machines for commissioning and for diagnosis on the installation side,” Elektrizitätswirtschaft, vol. 104, no. 17–18, pp. 62–70, 2005 [21] T. Strehl, “On- and off-line measurement, diagnostics and monitoring of partial discharges on high-voltage equipment,” presented at HV Testing, Monitoring and Diagnostics Workshop 2000, Alexandria, VA, Sep. 13–14, 2000 [22] K. Rethmeier, B. Vandiver, A. Obralic, W. Kalkner, and R. Plath, “Benefits of synchronous multi-channel PD measurements,” presented at IEEE Conf. Electrical Insulation and Dielectric Phenomena 2007, Vancouver, BC, Canada. [23] R. Goffeaux, M. Krecke, B. Comte, M. Cottet, and B. Fruth, “Dielectric test methods for rotating machine stator insulation inspection,” presented at IEEE Conf. Electrical Insulation and Dielectric Phenomena 1998, Atlanta, GA. [24] Rotating Electrical Machines - Part 27: Off-Line Partial Discharge Measurements on the Stator Winding Insulation of Rotating Electrical Machines, IEC 60034-27-2006, 2006. [25] Knowledge Rules for Partial Discharge Diagnosis in Service, CIGRE Brochure 226, Paris, France: CIGRE, 2003. [26] W. Kalkner, A. Obralic, A. Bethge, and R. Plath, “Synchronous 3-phase partial discharge detection on rotating machines,” presented at Int. Symp. High Voltage Engineering 2005, Beijing, China.
Christof Sumereder graduated in electrical engineering from Graz University of Technology in 1997. After three years of industrial experience he received his doctorate in technical science with honors in 2003, and is presently an Assistant Professor at the
24
Institute of High Voltage Engineering and System Management. He has worked on new technologies for insulation materials as well as cryogenic systems. Currently, his fields of special interest are on-site diagnostics of hydro generators, and maintenance, reliability engineering, and life-time investigations of insulation systems. He is a member of ÖVE and CIGRE.
Michael Muhr graduated in electrical engineering in 1971. He received his doctorate in technical science from Graz University of Technology in 1977, and is presently Head of the Institute of High Voltage Engineering and System Management, Head of the Test Institution for High Voltage Engineering Graz Ltd., and Vice Rector for Academics. He has received many honors for his research work, including Doctor h.c. from University Pilsen. He is a member of IEC, IEEE, CIGRE, and ÖVE.
Michael Marketz studied electrical engineering at Graz University of Technology before joining the department of Power System Operation, Kelag in 1999. He received his Ph.D. in 2003, and currently is head of the department of Power Plant Operation and Maintenance.
Christian Rupp studied Electrical Engineering at Graz University of Technology. Since 2005, he has been working with Kelag in the department of Power Plant Operation and Maintenance. His special field of interest is condition assessment and risk evaluation of power system equipment
Michael Krüger studied Electrical Engineering at the Technical Universities of Aachen and Kaiserslautern. He received his Ph.D. in the field of cable testing at the Technical University of Vienna. Currently he is head of Engineering Services Primary Testing at OMICRON. He is a member of VDE, IEEE, and CIGRE.
IEEE Electrical Insulation Magazine