CONTINUING MEDICAL EDUCATION FORMATION MÉDICALE CONTINUE
USERS’ GUIDE TO THE SURGICAL LITERATURE
understanding confidence intervals
Margherita Cadeddu, MD Forough Farrokhyar, MPhil, PhD Carolyn Levis MD, MSc Sylvie Cornacchi, MSc Ted Haines, MD, MSc Achilleas Thoma, MD, MSc for the Evidence-Based Surgery Working Group* From the Surgical Outcomes Research Centre, Department of Surgery, McMaster University, Hamilton, Ont. *The Evidence-Based Surgery Working Group comprises S. Archibald, M. Bhandari, M. Cadeddu, S. Cornacchi, F. Farrokhyar, C.H. Goldsmith, T. Haines, R. Hansebout, R. Jaeschke, C. Levis, P. Lovrics, M. Simunovic, V. Tandan and A. Thoma. Accepted for publication Nov. 7, 2011 Correspondence to: M.O. Cadeddu St. Joseph’s Healthcare 50 Charlton Ave. E, Room G810 Hamilton ON L8N 4A6
[email protected] DOI: 10.1503/cjs.010211
ncreasingly, surgical research articles are citing confidence intervals (CIs) when reporting treatment effects. It is important to understand the theory behind CIs so that present and future surgical literature can be correctly interpreted and clinically useful information gained to help guide treatment decisions. The move toward including CIs is predominantly owing to them providing more information for the clinician regarding research results. In general, with p values, research results can be deemed statistically significant or not, whereas treatment effect and its corresponding CIs can give information regarding the magnitude of the difference between 2 treatments and the interval of values within which the true value is likely to be found.1 This provides information as to whether results are clinically important.2 To illustrate how CIs work, how to interpret them and how to critically appraise the validity of evidence using CIs of a treatment effect, a surgical problem and the critical appraisal of research findings are presented in this article.
I
ClInICal sCenarIo You are a staff plastic surgeon and you receive a call from your resident with a referral involving a 6-year-old girl with a facial laceration. The laceration requires suturing, and the resident asks which suture to use. You tell her to use a 5–0 Nylon. She asks if an absorbable suture would work, since that would avoid suture removal, to which you answer that the long-term cosmesis is better with nonabsorbable sutures. Once off the telephone, you wonder if there are any recent studies to support this recommendation.
lIterature searCh To answer your question, you conduct a thorough literature search using PubMed. The key search terms used are “pediatric lacerations” and “absorbable” or “non-absorbable” and “sutures.” This search yielded 549 articles. The search is further limited by adding “randomized controlled trials,” “humans,” “English,” “last 10 years” and “all child 0-18 years” as limits in PubMed. This search yielded 3 articles.3–5 One article focusing on athletes is not applicable. The other 2 randomized controlled trials (RCTs) examine pediatric lacerations closed with absorbable and nonabsorbable sutures. The RCT by Karounis and colleagues3 appears to be the most relevant for our purpose of interpreting the use of CIs. For more detailed information on how to develop a clinical question and conduct a successful literature search, refer to the “Users’ guide to the surgical literature” article by Birch and colleagues.6
summary of artICle The article by Karounis and colleagues3 is an RCT in pediatric patients treated for minor lacerations in a single emergency department by fellowship-trained © 2012 Canadian Medical Association
Can J Surg, Vol. 55, No. 3, June 2012
207
FORMATION MÉDICALE CONTINUE
or in-training emergency physicians. Healthy patients with simple lacerations not involving the scalp and requiring suture closure (length > 5 cm and depth > 0.5 cm) were randomly assigned to the group receiving absorbable catgut sutures (50 children) or the group receiving nonabsorbable nylon sutures (45 children); both types of sutures were made by Ethicon Inc./Johnson and Johnson Co. Technique of closure, size or suture material and dressings were standardized. Oral and topical antibiotic use was at the discretion of the treating physician. The 2 groups were similar in demographic characteristics, wound characteristics and wound care. The primary outcome was cosmetic result at 4–5 months measured by a visual analog scale (VAS) for cosmesis, where 0 mm represented the worse possible outcome and 100 mm the best possible outcome.7 There were 3 secondary outcomes: wound evaluation score (WES) at 5– 10 days and at 4–5 months; infection and dehiscence; and need for surgical revision. At 5–7 days for facial lacerations and 7–10 days for torso and extremity lacerations postsuture, the same wound care nurse evaluated all patients and assigned a score using the 6-item validated WES tool, which assesses short-term cosmesis.8 Early evaluation also included signs of drainage, systemic and wound infection or dehiscence. Late evaluation was completed by a plastic surgeon blinded to treatment and included using a validated VAS of cosmesis, repeating the WES and determining if a scar revision was needed. Results were available for 63 of the 95 patients at the 4-month follow-up: the VAS was 79 mm (95% CI 73– 85 mm) for the 34 patients in the absorbable sutures group and 66 mm (95% CI 55–76 mm) for the 29 patients in the nonabsorbable sutures group.3 For the secondary outcomes, no differences were found between the groups in terms of percentage of optimal WES (6 of 6; 62% v. 49%, relative risk [RR] 0.73, 95% CI 0.45–1.17), rates of dehiscence (2% v. 11%, p = 0.07) and infection (0% v. 2%, p = 0.3). Two patients in the absorbable sutures group and 1 patient in the nonabsorbable sutures group were recommended for surgical revision.3 As a plastic surgeon, you are surprised at the results and consider how the use of CIs can help you interpret the results more thoroughly. Although there might be some methodological limitations to the RCT, we will accept it for now, as the purpose of this article is the appraisal of CIs. For those who are interested in the appraisal of RCTs in surgery, we recommend reading the “Users’ guide to the surgical literature” article by Thoma and colleagues9 on this topic.
ConCept and ImportanCe of CIs To understand CIs, the concepts of population values, variability and interval estimation of values will be briefly reviewed as they pertain to the development of CIs. Evidence used in decision-making about a treatment relies on the estimated values from a sample of patients that are 208
o
J can chir, Vol. 55, N 3, juin 2012
then generalized to all individuals in that population. Ideally, we would like to perform a study on the entire patient population and calculate the true population value, but this process is impractical and often impossible. We commonly conduct studies on a random sample of patients drawn from the whole population and assume that the results from these studies could be extrapolated as estimates of what might happen if the treatment was given to the entire patient population.10 The accuracy of the study results and the process of extrapolation, even if biases (systematic errors) are excluded, are subject to some measure of uncertainty that should be considered before making decisions. This uncertainty, or random error, is owing to the variability in measured data, which arises purely by chance and could be reduced by increasing the number of observations.10 Details on the measures of variability, standard deviation (SD) and standard error of the mean (SEM) are provided for interested readers in Appendix 1, available at cma.ca/cjs. Note that random sampling is mimicked in an RCT by randomly assigning patients to the study groups. This provides the same statistical validity to the statistics computed from the groups as well as the inferences drawn from the statistics. Whether the results in the RCT apply to the reader’s patients is a matter of clinical judgement or generalizability. The inclusion and exclusion criteria have to be interpreted by the reader to determine whether the trial results apply to their own patients. There are 2 approaches to statistical analysis: hypothesis testing and estimation. 10,11 We are more familiar with hypothesis testing, since this has been the “scientific method” we learned in undergraduate studies and traditionally have seen in medical research. This approach involves proposing a hypothesis, measuring a variable and determining whether this calculation supports or refutes the initial assumption. This is done by calculating a p value and making a statement on statistical significance. Hypothesis testing is discussed in detail elsewhere.11 By contrast, the estimation approach gives us more useful information. Two methods of estimation are commonly used. First, we randomly take a sample of patients and calculate a single number as an estimate of the population value; this single number is called a “point estimate.” For example, we use the mean from a sample of patients to estimate the population mean. The problem is if we carry out a series of identical studies on different samples from the same populations, we will obtain different estimates of the mean.1 A point estimate does not provide any information about the size of the samples or the inherent variability of the estimates. Therefore, a second method, known as “interval estimation,” in addition to point estimation is preferred. This method provides an interval of reasonable values to quantify the uncertainty, due to sampling variation, around the point estimate. This interval of values is intended to contain the population value with a certain
CONTINUING MEDICAL EDUCATION
degree of confidence and is called a “confidence interval.”1 For example, with 95% CIs, we can be 95% certain that the intervals cover the true population value. The width of a 95% CI indicates the size of imprecision of the estimate; the narrower the CI, the more precise the estimate. The precision of the estimate can be improved by increasing the sample size. The CIs and p value are closely related. A p value of 0.05 corresponds with 95% CIs, excluding the value indicated in the null hypothesis (i.e., 0 for the differences between 2 means or proportions and 1 for an RR, odds ratio [OR] or hazard ratio).1,10 We can obtain CIs for all population values, including means, proportions, rates, and ratios. The conventional coverage of 95% for CIs is arbitrary, and 90% or 99% CIs are occasionally used. Note that CIs only reflect the imprecision arising from sample variation but do not reflect the additional variations introduced by systematic errors. For example, when groups are not assigned randomly, the randomization sequence is not concealed, outcomes are not assessed in a blinded fashion or there are many losses to follow-up,10 and then CIs can underestimate of the variation present in the sample.
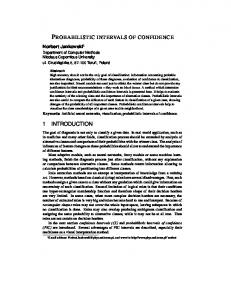
InterpretatIon of CIs The interpretation of CIs is quite straightforward. For a given sample, CIs inform the clinicians about the interval in which the true population value for the proposed treatment might lie.12 The CI can provide valuable clinical information when determining the clinical importance of a treatment. It can help determine whether the sample size is sufficiently large and the CIs sufficiently narrow to reach a definitive conclusion about the results of a study.12,13 The concept of minimum important difference (MID) is useful when considering the issue of whether a study had enough power for the generated CIs.14 The MID is the smallest effect of a treatment that patients perceive as beneficial in the absence of side effects.14 This is often provided in study articles as the effect size when describing the calculations used to determine sample size.11 As described in the example that follows, how the MID relates to the CIs helps clinicians understand if a study is adequately powered and if the results are clinically important. This highlights the advantage of CIs in providing clinically important information as well as statistically significant differences. The p value, on the other hand, indicates if a result is statistically significant, but it may not be clinically useful to the patient. Figure 1 shows 4 hypothetical study results for comparing the postoperative pain score between laparoscopic and open surgery for hernia repair. A mean difference of 10 mm in postoperative pain score between laparoscopic and open surgery, for example, is assumed to be the MID. The null hypothesis is that the difference in postoperative pain score between laparoscopic and open surgery is 0 (vertical line drawn through 0). For each study, the dot repre-
sents the mean difference (point estimate) and the line represents the corresponding 95% CI. From Figure 1, when the results of a study are positive (statistically significant), the CIs would exclude the value indicated for the null hypothesis (i.e., 0), as in Study 1 and Study 2. We still need to check the boundaries of the CI.12,13,15 If the MID of 10 mm falls outside of the lower boundary (the smallest plausible treatment effect compatible with results) of the CI, we could confidently conclude that the sample size is large enough and the study’s results are definitive (Study 1, Fig. 1). If the MID of 10 mm falls inside of the lower boundary of the CI (even though the mean difference between the 2 types of surgery is larger than the MID), we should doubt that the sample size was large enough to produce definitive results, and there is still uncertainty as to whether laparoscopic surgery, for example, is beneficial based the results of this study (Study 2, Fig. 1). More studies with adequate sample sizes are needed for a definite conclusion.12,13 When a study’s results are negative (not statistically significant), the CIs will include the value indicated for the null hypothesis, as in Study 3 and Study 4. Therefore, the hypothesis of no difference will be accepted, but the CI still provides us with useful information. This information is important for the interpretation of the results that are not revealed by the p value. If the MID is outside of the higher boundary of the CI, the sample size was adequate, the study is truly negative, and results are definitive (Study 3, Fig. 1).12,13 Conversely, if the MID is included within the boundaries of the CI, then the study was underpowered, the results are inconclusive, and more studies with larger sample sizes are needed (Study 4, Fig. 1).12,13 The methods for constructing CIs for a mean difference are demonstrated in the Appendix.16
applyIng CIs to our artICle With this understanding of CIs, the data from the article by Karounis and colleagues3 can be used to interpret and understand CIs more in depth. Looking at the primary end MID In favour of open surgery
In favour of laparoscopic surgery
Study 2 Study 3 Study 1 Study 4
–15
–10
–5
0
5
10
15
20
Fig. 1. Results of 4 hypothetical studies for comparing laparoscopic and open surgery for hernia repair. A 10-mm improvement in the postoperative pain score is considered the smallest benefit that would warrant a change in practice (double line). The single line on the y axis represents the null hypothesis of no difference. For each study, the dot represents the mean difference (point estimate), and the line represents the boundaries of the 95% confidence intervals around the point estimate. MID = minimum important difference. Can J Surg, Vol. 55, No. 3, June 2012
209
FORMATION MÉDICALE CONTINUE
point, the VAS of cosmesis gives a mean of 79 (95% CI 73– 85) mm for the absorbable sutures group and 66 (95% CI 55–76) mm for the nonabsorbable sutures group. That means that if the trial was done 100 times and CIs were calculated, the true population value for each group would be included in 95 of the 100 CIs. The chosen MID for this article was a 12 mm difference in the mean VAS scores.3 The authors did not report the mean difference but provided the mean and 95% CIs for each group. We could calculate the mean difference and the corresponding CIs from the provided information on each mean (see the Appendix for the calculation of mean difference and corresponding CIs from the provided data). The mean difference between the absorbable and nonabsorbable sutures groups is 13 mm (in favour of absorbable sutures) and the corresponding CI is 0.61–25.4 mm. The results are similar to Study 2 from Figure 1, where the mean difference in VAS of cosmesis between the groups is statistically significant, as the 95% CIs excludes 0, the value for the null hypothesis, but the MID of 12 mm is inside of the boundaries of the 95% CI (Fig. 2). Therefore, we can conclude that the sample size was not large enough to produce definitive results and that more studies are needed to test this hypothesis. A similar interpretation could be applied to outcome values, such as risk differences, RRs, hazard ratios or ORs. As previously mentioned, results reported as ratios have a value of 1 for the null hypothesis, so CIs crossing 1 in these calculations would not be considered statistically significant. There is no reason to consider secondary outcomes, as the details for power analysis are usually provided for the primary outcome only. It is possible to ensure that we would have enough power to test the hypotheses of no difference for both primary and secondary outcomes, but one needs to plan the study a priori for this purpose and possibly adjust sample size accordingly.
dIsCussIon The article3 used here to understand CIs shows clearly MID In favour of group A
In favour of group NA
Karounis et al.
–15
–10
–5
0
5
10
15
25
20 3
fig. 2. Results from the study by Karounis and colleagues. A 12-mm difference in visual analogue scale (VAS) score of cosmesis was an a priori minimum important difference (MID; double line) by the authors. The single line is the null hypothesis of no difference in mean VAS of cosmesis. The dot on the horizontal line represents the mean difference of 13 mm, and the line represents the 95% confidence interval of 0.61–25.4 mm.
210
o
J can chir, Vol. 55, N 3, juin 2012
how a “positive” result of a study based on the p value can contain much more information for the clinician when CIs are used to interpret the results. Whereas more information, such as the mean treatment difference and MID, is needed from study authors, the readers in turn can reach better conclusions. The clinician can determine, for example, whether the MID was reached, whether the CIs show the study results to be definitive or requiring further study and the amount of precision of the results based on the narrowness of the CIs. This specific article also highlighted the importance of understanding how CIs need to be presented, since the original article provided group VAS means with CIs rather than the mean difference between the study groups. It required some work by our statistician to arrive at the more useful mean difference between the groups and the CI (see the Appendix for the calculation). This value is the treatment effect, which is in essence what the clinician wants to know. This is a useful point when reviewing articles: to see if the mean difference and CIs have been calculated for means, and to see if RRs, ORs or hazard ratios and CIs have been calculated for proportions. Figure 1 is a useful diagram to guide conclusions about research results. As seen in the article by Karounis and colleagues,3 the CIs did not include the null hypothesis, so the results are statistically significant, but the CIs did include the MID, indicating that the study was inconclusive for the proposed MID, thus other larger studies are required to make a definitive conclusion about suture choice for lacerations. This diagram can be used to interpret other research article results in a similar manner, by determining whether the CIs include the null hypothesis value or the MID.
ConClusIon Returning to our initial scenario, when evaluating the chosen article based on the evidence, you are not convinced that the study’s conclusion — that absorbable suture is superior to nonabsorbable suture — is supported by the data. The final result will only become apparent when a larger RCT is executed in which the MID is considered in the sample size calculation. For the time being, you advise the plastic surgery resident to use her preferred suture. As can be appreciated through this scenario, a more detailed analysis is required with CIs than simply looking at a p value. However, much more information is gained. Statistical significance can be determined quickly by assessing whether the null hypothesis is included in the CIs (0 for mean difference and 1 for an RR), and the clinical importance of the conclusions can be determined by whether the MID is included in the boundaries of the CI or not. The width of the CI also indicates how much variability is present in the study samples. Confidence intervals are being used more often in many surgical journals since they contain more relevant information for the clinician;
CONTINUING MEDICAL EDUCATION
understanding their application is essential for ongoing analysis and appraisal of surgical research.17 Acknowledgements: We thank Dr. Charlie Goldsmith for his assistance with reviewing/editing the manuscript. Competing interests: None declared. Contributors: M. Cadeddu, F. Forrokyar, C. Levis and A. Thoma designed the study. S. Cornacchi acquired the data, which M. Cadeddu, F. Farrokhyar and T. Haines analyzed. M. Cadeddu, F. Farrokhyar, C. Levis, S. Cornacchi and A. Thoma wrote the article, which F. Farrokhyar, S. Cornacchi, T. Haines and A. Thoma reviewed. All authors approved itspublication.
references 1. Altman DG. Why we need confidence intervals. World J Surg 2005; 29:554-6. 2. Greenfield ML, Kuhn JE, Wojitys EM. A statistics primer. Confidence intervals. Am J Sports Med 1998;26:145-9. 3. Karounis H, Gouin S, Eisman H, et al. A randomized, controlled trial comparing long-term outcomes of traumatic pediatric lacerations repaired with absorbable plain gut versus nonabsorbable nylon sutures. Acad Emerg Med 2004;11:730-5. 4. Luck RP, Flood R, Eyal D, et al. Cosmetic outcomes of absorbable versus nonabsorbable sutures in pediatric facial lacerations. Pediatr Emerg Care 2008;24:137-42. 5. Monteiro GC, Ejnisman B, Andreoli CV, et al. Absorbable versus nonabsorbable sutures for the arthroscopic treatment of anterior shoulder instability in athletes: a prospective randomized study.
Arthroscopy 2008;24:697-703. 6. Birch DW, Eady A, Robertson D, et al. Users’ guide to the surgical literature. How to perform a literature search. Can J Surg 2003;46:136-41. 7. Quinn JV, Drzwiecki AE, Stiell IG, et al. Appearance scales to measure cosmetic outcomes of healed lacerations. Am J Emerg Med 1995; 13:229-31. 8. Hollander JE, Singer AJ, Valentine S, et al. Wound registry: development and validation. Ann Emerg Med 1995;25:675-85. 9. Thoma A, Farrokhyar F, Bhandari M, et al. Users’ guide to the surgical literature. How to assess a randomized controlled trial in surgery. Can J Surg 2004;47:200-8. 10. Akobeng AK. Confidence intervals and p-values in clinical decision making. Acta Paediatr 2008;97:1004-7. 11. Cadeddu M, Farrokhyar F, Thoma A, et al. Users’ guide to the surgical literature: how to assess power and sample size. Laparoscopic vs open appendectomy. Can J Surg 2008;51:476-82. 12. Montori VM, Kleinbart J, Newman TB, et al. Tips for learners of evidence-based medicine: 2. Measures of precision (confidence intervals). CMAJ 2004;171:611-5. 13. Young KD, Lewis RJ. What is confidence? Part 1: The use and interpretation of confidence intervals. Ann Emerg Med 1997;30:307-10. 14. Last JM. A dictionary of epidemiology. 4th ed. New York: Oxford University Press, Inc.; 2001. 15. Sim J, Reid N. Statistical inference by confidence intervals: issues of interpretation and utilization. Phys Ther 1999;79:186-95. 16. Pagano M, Gauvreau K. Chapter 9. Confidence intervals. In: Principles of biostatistics. 2nd ed. Florence (KY): Brooks/Cole Duxbury; 2000. p. 241-231. 17. Kline RB. Beyond significance testing. Reforming data analysis methods in behavioral research. Washington: American Psychological Association; 2004.
How you can get involved in the CMA! The CMA is committed to providing leadership for physicians and promoting the highest standard of health and health care for Canadians. To strengthen the association and be truly representative of all Canadian physicians the CMA needs to hear from members interested in serving in elected positions and on appointed committees and advisory groups. The CMA structure comprises both governing bodies and advisory bodies either elected by General Council or appointed by the CMA Board of Directors. The Board of Directors — elected by General Council — has provincial/territorial, resident and student representation, is responsible for the overall operation of the CMA and reports to General Council on issues of governance. CMA committees advise the Board of Directors and make recommendations on specific issues of concern to physicians and the public. Five core committees mainly consist of regional, resident and student representation while other statutory and special committees and task forces consist of individuals with interest and expertise in subject-specific fields. Positions on one or more of these committees may become available in the coming year. For further information on how you can get involved, please contact: Jacqueline Ethier, Corporate and Governance Services Canadian Medical Association 1867 Alta Vista Drive, Ottawa ON K1G 5W8 Fax 613 526-7570, Tel 800 663-7336 x2249
[email protected] By getting involved, you will have an opportunity to make a difference. We hope to hear from you!
Can J Surg, Vol. 55, No. 3, June 2012
211