ID4/1. D243-4A-OR. OEC1222. 1-1/1 a ade lys a ade-I his-I ihr-l a ade-l. + + - .... Cells of stock p5 were mated with stock ID4/1, with (open circles) and without ...
UNIPARENTAL INHERITANCE OF MITOCHONDRIAL GENES I N YEAST: DEPENDENCE ON INPUT BIAS OF MITOCHONDRIAL DNA AND PRELIMINARY INVESTIGATIONS OF THE MECHANISM C. WILLIAM BIRICY, JR.*t, CATHERINE A. DEMKO*, PHILIP S. PERLMAN*t, AND ROBERT STRAUSBERwt The Ohio Stale University, Columbus, Ohio 43210 Manuscript received September 26, 1977 Revised copy received March 17, 1978 ABSTRACT
In Saccharomyces cerevisiae, previous studies on the inheritance of mitochondrial genes controlling antibiotic resistance have shown that some crosses produce a substantial number of uniparental zygotes, which transmit to their diploid progeny mitochondrial alleles from only one parent. In this paper, we show that uniparental zygotes are formed especially when one parent (majority parent) contributes substantially more mitochondrial DNA molecules to the zygote than does the other (minority) parent. Cellular contents of mitochondrial DNA (mtDNA) are increased in these experiments by treatment with cycloheximide, alpha-factor, or the uvsp5 nuclear mutation. In such a biased cross, some zygotes are uniparental for mitochondrial alleles from the majority parent, and the frequency of such zygotes increases with increasing bias. In two- and three-factor crosses, the cupl, ery1, and oli1 loci behave coordinately, rather than independently; minority markers tend to be transmitted or lost as a unit, suggesting that the uniparental mechanism acts on entire mtDNA molecules rather than on individual loci. This rules out the possibility that uniparental inheritance can be explained by the conversion of minority markers to the majority alleles during recombination. Exceptions to the coordinate behavior of different loci can be explained by marker rescue via recombination. Uniparental inheritance is largely independent of the position of buds on the zygote. We conclude that it is due to the failure of minority markers to replicate in some zygotes, possibly involving the rapid enzymatic destruction of such markers. We have considered two general classes of mechanisms: (1) random selection of molecules for replication, as for example by competition for replicating sites on a membrane; and (2) differential marking of mtDNA molecules in the two parents, possibly by modification enzymes, followed by a mechanism that “counts” molecules and replicates only the majority type. These classes of models are distinguished genetically by the fact that the first predicts that the output frequency of a given allele among the progeny of a large number of zygotes will approximately equal the average input frequency of that allele, while the second class predicts that any * Department of Genetics.
t Developmental Biology Program. $ Present address: Department of Biochemistry, University of Texas, Health Sciences Center at Dallas, Dallas, Texas 75235.
Genetics 89: 015-651 August, 1078
616
c. WILLIAM
BIRKY, JR.
et al.
input bias will be aniplified in the output. The data suggest that bias amplification does occur. We hypothesize that maternal inheritance of mitochondrial or chloroplast genes in many organisms may depend upon a biased input of organelle DNA molecules, which usually favors the maternal parent, followed by failure of the minority (paternal) molecules to replicate in many or all zygotes.
ITOCHONDRIAL and chloroplast genes are transmitted to progeny preMdominantly or entirely by only one parent in a number of different organisms. This uniparental inheritance is generally through the maternal parent in organisms with oogamy, and in such cases may be attributable to the male gamete containing many fewer organelles than the egg, or to failure of the organelles from the male gamete to enter the egg (see BIRKY1976 for references). But in the geranium (Pelargonium), many crosses involving chloroplast mutants produce three classes of zygotes: those transmitting only maternal markers, those transmitting only paternal markers, and those transmitting both to varying extents (TILNEY-BASSETT 1975). In the algae Chlamydomonas reinhardtii (SAGER 1975; GILLHAM1974) and C . eugametos (MCBRIDE and McBRIDE 1975), chloroplast markers are transmitted principally from one parent, but in both of these isogamous species the zygote receives the entire chloroplast of both parent gamctes. In these cases, it is clear that the failure of uniparental zygotes to transmit organelle markers from one parent must be due to the failure of those markers to replicate in the zygote and to their loss by dilution or enzymatic degradation, or to the conversion of the markers to the corresponding alleles from the other parent. At first sight, it may appear that mitochondrial genes in baker’s yeast (Saccharomyces cereuisiae) are always inherited biparentally, since an examination of the mixed progeny of a large number of zygotes (random diploid analysis) always shows that mitochondrial genes from both parents can be recovered among the progeny (LINNANE et al. 1968; THOMAS and WILKIE1968; COEN et al. 1970). When the progeny of individual zygotes were analyzed separately (zygote clone analysis), some zygotes were found that transmitted to their progeny mitochondrial genes from only one parent (COENet al. 1970; RANK 1973; WAXMAN, and BECH-HANSEN 1972; WILKIE1972; WILKIEarid THOMAS EATON and WILKIE1973; CALLEN1974; LINNANE, HOWELL and LUKINS 1974). The number of such zygotes, however, was usually small, and they might have resulted from matings between spontaneous petite mutant cells that had lost the mitochondrial genes in question and a wild-type cell that retained them. BIRKY (1974, 1975a,b,c) first called attention to these zygotes and argued that they indicated uniparental inheritance analogous to that seen in other organisms, after finding that some yeast matings produced uniparental zygotes in substantial proportions: too many to be accounted for by petites, by sampling or scoring errors, or by zygotes that produce a single bud pure for one genotype and then die. Neither is it possible to explain uniparental zygotes by the transmission of only a very small number of identical genomes from the zygote to its buds;
I N H E R I T A N C E O F YEAST M I T O C H O N D R I A L G E N E S
617
genetic and physical evidence argue against this (CALLEN1974; BIRKY1975c; DUJONand SLONIMSKI 1976; BIRKYet al. 1977; SENA,WELCH and FOGEL 1976). We now report further studies investigating the circumstances in which uniparental inheritance occurs and examining possible mechanisms. These studies show, for several different crosses, that uniparental zygotes are consistently produced when the two parents contribute different numbers of mtDNA molecules to the zygote (biased input) ; most uniparental zygotes transmit only mitochondrial alleles from the majority parent. Increasing input bias in a cross results in increasing frequencies of uniparental zygotes, whether the input bias is induced by treatment with cycloheximide or the mating hormone alpha-factor or by a nuclear gene. In a two-factor or three-factor cross, a given zygote may show uniparental inheritance of mitochondrial genes at only one locus, or at two or three loci. The most common class of uniparental zygotes are those uniparental at all loci studied. A possible explanation for uniparental zygotes is random loss and fixation of alleles due to multiple rounds of random mating and gene conversion. We have ruled this out as a sufficient explanation by showing that the capl, eryl, and olil loci tend to become uniparental as a unit, although they are probably rarely or never included in the same gene conversion event, and that uniparental inheritance is not found in higher frequency among zygotes having a greater opportunity for recombination. Mitochondrial DNA (mtDNA) molecules are singled out for transmission o r loss soon after the formation of the zygote; nevertheless, markers may apparently be rescued by recombination from genomes destined to be lost. The effect of input bias may be explained by two different types of models: those invoking random selection of a small sample of mtDNA molecules for replication, and those in which the zygote differentially marks and “counts” mtDNA molecules from the two parents and replicates the majority type. Preliminary data relating input and output ratios of mitochondrial alleles favor the latter kind of model. Some of our data and conclusions were summarized earlier by PERLMAN et al. (1976). MATERIALS A N D M E T H O D S
Stocks The stocks, their sources, and their genotypes are listed in Table I. For the sake of brevity we have used the symbols CR and Cs, ER and ES, O R and Os, PR and PS as abbreviations for the mitochondrial allele pairs caplr and capla, erylr and eryls, 0 1 2 7 and O M s , par17 and par18 All crosses were homopolar ( U + x U + or U- x U - ) , so that the phenomenon of polarity (DUJON, SLONIMSKI and WEILL1974) is not involved in any of our experiments or interpretations.
Media YEPD, YEPG, and YEPGal contained 1% Difco yeast extract plus 2% Difco proteose peptone, and 2%dextrose (glucose), 4% glycerol, or 2% galactose, respectively. (All concentrations are w/v.) Comparable results were obtained with the semisynthetic media RD and RG, which contain 0.5% yeast extract, 0.1% (NH,)$O,, 0.1% KH,PO,, 0.05% MgSO,, and 0.05% NaCl at pH 6.5, plus carbon sources as above. These media were sometimes supplemented with amino
a: his a his trp a his a: ade
a a& trp
a ade lys
a ade-l
a: ade his
a lys
a leu
a ade lys
a: ade lys
IL458-1A DPI-1 B/517 IL126-1 B 41-1
ID4/1
D243-4A-OR OEC1222 1-1/1
6-2/5
LT70
4'120E ID41-6/152
ID41-6/19
S
R
S R S S
R S R R
R32 1 S
R
S R
R
R4
R4 RI R4
R514 R4
+
R32l
S S R3 RI R321 S
+ + -
s s
s s s
s s s s s
O
E
R32 1 R221 S R517 s s R32l R221 S R321 R514 R4
C
+-+
++ ++ ++
w
-
Genotype
* C , E, 0, and P are abbreviations for the chll, e r y l , olil, and par1 loci.
a ade-I his-I ihr-l
lys-l/lys-I
a his UVSp5 a arg met a irp-I a lys-I
a/a
a his
Nuclear
NI23 NI23 UVSrho5 D6 2-3b 4810 48 10 diploid
Strain
P
1-1/1
4120 COP/152
COP/19
R
LT70
R
S
R
6-2/5
OEC
S S
D243
S
ID4/1
IL458 DPI IL126 41-1
NIB P5 D6 2-36 4810 4810 diploid
Abbreviation
S
S
R
S S S
Strains used
TABLE 1
_
_
_
Source ~
E. MOUSTACCHI E. MOUSTACCHI D. Y. THOMAS R. KLEESE R. KLEESE Diploidization of 4810 induced by cycloheximide P. P. SLONIMSKI P. P. SLONIMSKI P. P. SLONIMSKI C. A. DEMKO(spore from 4810 x ID4/1) R. YOUNG(spore from (32)l-2/3 x DPl-lB/514) R. CRIDDLE K. SUDA P. S. PERLMAN (spore from D243 x IL126) (spore from P. S. PERLMAN IL468 x D243) (spore from L. TREAT 4810 x 6-2/5) J. FORSTER C. A. DEMKO(spore from 1-1/1 x 4810) C. A. DEMKO(spore from l-l/l x 4810)
~
n
I N H E R I T A N C E O F YEAST MITOCHONDRIAL G E N E S
619
acids, adenine, or uracil, depending on the auxotrophic requirements of the strains being studied. (1946) but with 1 mg CaCl,/l. MMD, MMG, and MMGal are minimal media after WICKERHAM Antibiotics dissolved in methanol or ethanol were added to agar media (2% agar) at about 50”, as follows: chloramphenicol, 3mg/ml; erythromycin, 1 mg/ml; oligomycin, 2 pg/ml; paromomycin, 3 mg/ml (dissolved in water). All experiments were done at 30”.
Cell growth and mating Glucose was the carbon source, unless otherwise indicated. Cells were grown to exponential phase in liquid or on plates, harvested, and mated two to three hours in the same medium with shaking. The mating mixture was usually begun with about IO7 cells of each mating type per ml. The mating mixture, containing zygotes that have not yet released their first buds and also unmated haploid parents, was plated on minimal medium with the same carbon source (prototroph selection plates), so that only the prototrophic zygotes and their diploid progeny could form colonies. In some experiments, cells were subjected before mating to one or more of the following treatments that have been reported to increase the mtDNA content of yeast: ( 1 ) the a parent culture was incubated for 90 minutes with the purified mating hormone “alpha-factor’’ (supplied by MICHAELDOUGLAS and DAVIDFINKLESTEIN), at a concentration that reduces the number of budded cells by about 50%; (2) cells were incubated with cycloheximide at 50 jtg/ml for three hours; (3) histidine-requiring cells were starved for histidine by incubation for three hours in minimal medium. All three treatments inhibit nuclear DNA synthesis and cell division, GOLDRING but permit mitochondrial DNA synthesis to continue (CRYERet al. 1973; GROSSMAN, and MARMUR 1969). Mitochondrial DNA synthesis was inhibited in some experiments by incubating the parent culture(s) or the mating mixture with hydroxyurea at 25 mg/ml, or by incubating adenine-requiring strains for three hours in minimal medium followed by mating in minimal medium containing all auxotrophic requirements except adenine. Alpha-factor, cycloheximide, or hydroxyurea were removed by washing cells three times in water before mating. The effects of these treatments on the output of mitochondrial crosses are described by (in preparation), and will be characterized further DEMKO(1975) and DEMKOand PERLMAN in this paper.
Extraction and density-gradient analysis of labelled D N A
In experiments designed to verify the effects of alpha-factor and hydroxyurea on the synthesis of nuclear and mitochondrial DNA, cells were labelled for 150 minutes with 3H-adenine at 7 ,pCi/ml. Both mitochondrial and nuclear DNA are labelled. To provide a marker for mitochondrial DNA, cells of stock p5 were pre-incubated with cycloheximide (50 pg/ml) for 30 minutes, then labelled with 14C-adenine at 0.5 pCi/ml for 150 minutes in the presence of cycloheximide. Only mitochondrial DNA is labelled. Samples of these cells were added to other batches of “-labelled cells to provide *4C-labelled mitochondrial DNA as a marker in gradients. The mixed cells were converted to spheroplasts, and CsCl gradients were prepared and analyzed as described by PERLMAN and MAHLER(1971). Output ratios (a) Random diploid analysis: To determine the output ratios of mitochondrial genes from the “average” zygote, all cells were washed off prototroph selection plates containing colonies from several hundred or more zygotes. The cell suspension, in l O m EDTA, ~ was diluted and about 100 cells were plated on several MMD plates to make replica masters. After incubation, these plates were replica-plated onto YEPG or RG plus appropriate antibiotics t o determine the mitochondrial genotypes of the colonies, and hence of the diploid cells washed off the prototroph selection plates. I t is important to note that the original zygotes had undergone about 20 generations on the prototroph selection plates, so that most diploid cells were homoplasmic (pure) for one mitochondria2 genotype or another as a result of vegetative segregation of mitochondrial DNA molecules. (b) Zygore clone analysis: To determine the output ratios of mitochondrial genes from
620
c . WILLIAM BIRKY, J R . et al.
individual zygotes, zygote clones were picked off prototroph selection plates and suspended separately in EDTA. Several replica master plates were then prepared for each zygote clone, incubated, and replica-plated as above. In either method, output ratios are expressed as the percent diploid cells having each of the possible parental and recombinant mitochondrial genotypes. The transmission of a mitochondrial allele is the percent of diploid cells expressing that particular allele; it is the total of the percentages of all genotypes that include the allele. The coordinate transmission seen for different loci in most of these crosses suggests that our results are not seriously affected by differential selection. Uniparental zygote identification methods (a) Zygote clone analysis: In a zygote clone analysis as described above, a variable number (usually several hundred) of cells from each zygote clone were individually scored; if all cells from a zygote clone carried the mitochondrial allele contributed by a particular parent, the clone was scored as uniparental for that locus. Clones pure for either the antibiotic-resistant or the antibiotic-sensitive allele could be identified in this way; i.e., clones uniparental for alleles from either parent. However, the method is relatively laborious and the sample size is consequently small; thus it is not possible to detect alleles transmitted by a zygote to less than about 1% of its progeny. More precisely, the 95% confidence interval for identification of a uniparental zygote may be estimated by 3.4/N, where N is the sample size; the range of N is about 100-500, so that this method may overlook 0.7-3.4% marker transmission. Consequently, a small fraction of the zygotes scored as uniparental may actually be biparental. (b) Dropping out: Samples of about IO4 to IO5 cells from each zygote clone were dropped directly onto antibiotic plates and scored for growth/no growth after incubation. No growth indicates that the zygote was uniparental for the antibiotic-sensitive allele, having transmitted the resistant allele to fewer than 0.01% to 0.001% of its progeny. Growth on the antibiotic plate means that the zygote was either biparental or was uniparental but transmitted only the antibiotic-resistance allele to its progeny. This technique can thus identify only one of the two possible classes of zygotes uniparental at a given locus, i.e., those uniparental for the antibioticsensitive allele. But for this class, the method provides a much more rigorous criterion of uniparental inheritance than does zygote clone analysis. (c) Replica plating: Individual zygote clones were picked from the prototroph selection plates and patched onto an MMD plate. After incubation overnight to increase the size of the colonies, these master plates were replica-plated onto antibiotic plates and scored for growth/ no growth. As with the dropping out test, this test permits the identification only of zygotes uniparental for sensitive alleles, but it is faster than either of the above methods and permits more zygotes to be scored from a given crsss. Tests showed that about 7.4 x IO4 to 3.8 X I O 5 cells were transferred from a velvet to an antibiotic plate during replica plating, so that this technique should identify as uniparental those zygotes transmitting the resistant allele to less than about 11105 of their progeny. Nearly all of the frequencies of uniparental zygotes given in this paper were obtained by method (b) or (c). Two sources of nonrandom error are present in all three methods. First, parent cultures may contain mitochondrial petite (p-) mutants which have deletions of mitochondrial genes. A mating of such a petite by a wild-type cell (p+) will automatically produce a zygote that is uniparental for any genes in the p+ parent whose alleles are deleted in the P- parent. The frequency of p- cells in each parent culture is routinely determined by plating on YEPD a sample of several hundred cells taken from the cultures just prior to mating. After incubation, the colonies are overlaid with 1.5% agar containing buffered triphenyl tetrazolium chloride (OGUR,ST. JOHN and NAGAI1957); colonies formed by p- cells fail to stain, while pf colonies stain red. In most experiments reported here, the frequency of p- cells was too small to account for more than a few percent of uniparental zygotes, even if one makes the excessively conservative assumption that all P- cells are missing the loci being studied. The second source of error is that haploid cells, not growing but still viable, may be picked up off the prototroph
621
I N H E R I T A N C E O F YEAST M I T O C H O N D R I A L G E N E S
selection plates along with the zygote clones. A few such cells from the resistant parent will then grow on antibiotic plates after dropping out or replica plating; if they are included in a zygote uniparental for the sensitive allele, that clone will be incorrectly scored as biparental. Such events are rare, and most of the data are not corrected for them. They tend to make our estimates of the frequency of uniparental zygotes more conservative. Apart from these general sources of error, clones can be misclassified by the replica plating test because (1) variations in the number of cells deposited from the velvet onto the drug plate can result in failure to detect rare resistant cells, and (2) occasional large clumps of sensitive cells deposited on the plate can be scored as resistant even though they are not growing. TO obtain an estimate of the frequency of niisclassification, zygote clones were first scored by replica plating and then scored again by the dropping out method. The frequency of resistant clones
sample 1
5
1
100
90
transmission
80
70
cn
8
60 50
40
30
uniparental
20 10
0
0
1
2 Time (hours)
3
4
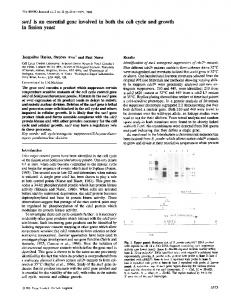
FIGURE 1 .-Uniparental zygotes are not simply homoplastic first buds or their mothers. Cells of stock p5 were mated with stock ID4/1, with (open circles) and without (solid circles) prior treatment of p5 with alpha-factor. Aliquots of the mating mixture were plated on minimal medium after 0, 120, 150, and 210 minutes and colonies from these plates were used for random diploid analysis to determine the transmission of the Cs allele o r for determination of the percent zygotes uniparental for the CY allele by the replica-plating method. Samples were removed from the mating mixture at five different times and examined microscopically for the presence of zygotes with and without large buds ready to separate from the mother. These samples showed: (1) no zygotes; (2) 0/17 zygotes with large buds; (3) 7/74 zygotes with large buds; (4) 46/101 zygotes with large buds; and ( 5 ) most zygotes with large buds, and some with second-generation buds.
622
c. WILLIAM BIRKY,
JR.
et al.
(biparental or uniparental for the resistant allele) misclassified as uniparental sensitive was 6.5% and 18.8% for two different persons; the same two workers misclassified uniparental sensitive clones as resistant in 8.1% and 13.2% of the cases. A sample of zygote clones was retested by the dropping out procedure and the results were compared to those of the first dropping out test. This experiment showed that the dropping out test is very reproducible; most remaining errors were for clones that were nearly pure for drug sensitivity (a few resistant cells/l05 cells in the first or second analysis). Because uniparental sensitive clones are a minority of the total, these errors will cause us to overestimate their frequency. But estimates of the differencein the frequency of uniparental zygotes between two different matings will be slightly too low.
Homoplasmic buds are rarely mistaken for uniparental zygotes Operationally, a uniparental zygote is defined as a colony, taken from a prototroph selection plate, which is pure for a mitochondrial allele from one parent. When a biparental zygote produces its first bud, that bud is also very often pure for one allele, due to vegetative segregation; mother cells are less often pure (see BIRKYet al. 1977 and PERLMAN, BIRKYand STRAUSBERG 1978 for references). It can thus be imagined that some colonies scored as uniparental zygotes actually arise, not from intact zygotes, but from buds that were formed and released from their biparental mother cells before the mating mixture was plated on minimal medium. To minimize this source of error, most matings were terminated after two hours, at which time first buds are rarely large enough to be released from the mother. In other cases, samples of the mating mixture were examined microscopically at intervals and the mixture was plated before significant numbers of large buds were seen (generally after about 150 minutes of mating). To demonstrate that this procedure was effective, a cross was done as described in the legend of Figure 1, with aliquots of the mating mixture being plated at intervals before and after large buds appeared. The frequency of “uniparental zygotes” remained essentially constant in samples plated after 0, 120, and 150 minutes of mating, then rose significantly at 210 minutes (zygotes formed after “0 minutes of mating” are actually due to mating events taking place on the prototroph selection plates). The rise at 210 minutes can be attributed to the release from biparental zygotes of pure first buds, which were scored as uniparental zygotes; such large buds were first seen in the mixture at 120 minutes, and increased in frequency until most zygotes at 190 minutes had buds ready for release.
Determining zygoie budding patierns Mating mixtures containing unbudded zygotes were washed in 1 mM EDTA and sonicated to break up cell clumps, then streaked cn agar slabs. Individual zygotes were moved to marked positions with a micromanipulator and examined frequently. As each bud appeared, its position on the zygote was recorded. For example, C E, E, means the first bud came from the central neck of the zygote, the second from one end of the zygote, and the third bud came from the other end. It is not known which parent haploid cell gave rise to which end of the zygote.
RESULTS A N D DISCUSSION
The bias effect Consider a generalized two-factor cross which may be symbolized a A“ B“ X a Ao,Ba,where A and B are two mitochondrial gene loci (e.g., A” and Aamight be the Cs and C” alleles, respectively). Assume that the cross is homopolar, or that A and B are nonpolar alleles in a heteropolar cross. According to the phageanalogy models of yeast mitochondrial genetics (especially DUJON,SLONIMSKI and WEILL1974; reviewed by BIRKY 1975c), the output frequencies (transmission) of alleles from the two parents reflect the input frequencies of
INHERITANCE O F YEAST MITOCHONDRIAL GENES
623
functional mtDNA molecules in the zygote. For example, an unbiased cross (yielding roughly 50% A", B", Am and Bm diploids) would be one in which the a and a: parents contributed approximately equal numbers of mtDNA molecules to the zygote, while a biased cross (e.g., 67% A" and B", 33% A a and Bm)would be one in which the a parent contributed more mtDNA molecules than the a: parent, or vice versa (in the example, an input ratio of about 2:l would be suspected). There is substantial evidence, direct and indirect, for a positive correlation between input ratios of mtDNA molecules and output ratios of mitochondrial alleles (DUJONet al. 1974,1975; GOLDTHWAITE, CRYER and MARMUR 1974; GUNGE1975; DEMKO1975; PERLMAN and DEMKO 1974). BIRKY (1974, 1975a,b) showed that the cross p5 a his CsOsx 1-1/1 a: ade CRORproduced a high frequency of zygotes uniparental for alleles from the p5 parent, and random diploids with a strong output bias favoring p 5 , when the cells were grown and mated in glycerol; with glucoses as a carbon source, the cross was less biased in favor of p5, and there were few zygotes uniparental for p5, markers. Glycerolgrown cells mate poorly, and many of the observed zygotes may have been produced after the cells were plated on minimal medium where the p5 parent was starved f o r histidine and the 1-1/1 parent was starved for adenine. Histidine starvation would be expected to increase the mtDNA content of p5 cells by GOLDinhibiting cell division while mtDNA synthesis continues (GROSSMAN, RING and MARMUR 1969), and adenine starvation would decrease that of 1-1/1 by preventing the premating synthesis of mtDNA induced by mating hormones. To test the possibility that biased inputs might be responsible for the production of uniparental zygotes, the mtDNA content of the a parent was deliberately increased in several crosses by treating the a cells with alpha-factor prior to mating. Alpha-factor arrests cells of mating type a in the G1 phase of the cell cycle in preparation for mating; it inhibits nuclear DNA synthesis and cell division but mitochondrial DNA synthesis continues (CRYERet al. 1973), so that treated cells increase their content of mtDNA relative to untreated GI cells (which can also mate). In some cases, hydroxyurea was added simultaneously with the alpha-factor to inhibit mtDNA synthesis, providing an additional control. To see if alpha-factor and hydroxyurea were working as expected in our experiments, the incorporation of labeled adenine into mitochondrial and nuclear DNA was followed in cells of stocks NI23 and p5 from experiment UP12. Ninety minutes after the addition of alpha-factor or hydroxyurea to the cells, aliquots were labelled with 3H-adenine (labelling nuclear and mitochondrial DNA) or with 14C-adeninein the presence of cycloheximide (labelling mtDNA only), as described in MATERIALS AND METHODS. DNA from these cells werc? n CsCl gradients; the results are shown in Figure 2. Untreated conanalyzed i trol cells showed incorporation of adenine into both nuclear and mitochondrial DNA, or into mitochondrial DNA only when p5 was labelled in the presence of cycloheximide (Figure 2A). The peak of 14C counts serves as a marker for mtDNA in the gradient. Cells treated with alpha-factor (Figure 2B) showed incorporation into mtDNA only. These results confirm that alpha-factor, like
c. WILLIAM BIRKY,
624
JR. et al.
100
0
A
8
90
B
4
9
!I
80
8
70
7
60
6
50
5
40
*T-
0 I
-
30
0
20
2-
10
la
3c)
c)
0
Y
E
U
U
-
I
U
ob,
0
D
5
5
4
4
3
3
2
2
1
1
C
0 10
20
30
40
0
10
20
30
40
Fraction number FIGURE 2.-CsCl gradient profiles of whole-cell DNA. Cells of p5 were labelled with 14C-adenine in the presence of 50 pg cyclo/ml for 150 minutes. An aliquot of those cells was added to cells labelled with "-adenine under the following conditions: (A) no treatment; (B) labelled in the presence of alpha-factor; (C) labelled in the presence of alpha-factor plus hydroxyurea (25 mg/ml); (D) labelled in the presence of hydroxyurea (25 mg/ml). The cells used in this experiment were taken from the same cultures used for the genetic analyses presented in Table 2 and similar data were obtained in the parallel experiment with strain NI23 (in place of p5). The cell mixtures were prepared for CsCl gradient analysis as described in MATERIALS AND METHODS. When the data are normalized to the number of 1% counts recovered (each cell mixture had the same number of 14C-labelled cells before the spheroplast procedure) the percent of control (A) mtDNA synthesis was calculated: B, 71%; C, 5.1%; D, 5.2%. Nuclear DNA synthesis was almost quantitatively inhibited by all treatments (including cyrlo) . 14C-data are unbroken lines and 3H-data are broken lines.
INHERITANCE O F YEAST MITOCHONDRIAL GENES
625
cycloheximide, permits mitochondrial DNA synthesis to continue while inhibiting nuclear DNA synthesis and cell division. Hydroxyurea inhibited incorporation of adenine into nuclear DNA nearly completely, but only partially inhibited incorporation into mitochondrial DNA (Figure 2D). Cells treated with hydroxyurea and alpha-factor together (Figure 2C) had a labelling pattern like that of cells treated with hydroxyurea alone. Assuming that the extent of adenine incorporation into DNA is a measure of net DNA synthesis, some predictions can be made. First, treatment of cells with alpha-factor, which blocks nuclear DNA synthesis but permits mitochondrial DNA synthesis to continue, should result in an increase in the amount of mtDNA per cell. Second, since hydroxyurea blocks cell division and nuclear DNA synthesis completely but only partially inhibits mitochondria DNA synthesis in this strain, it should result in a smaller increase in the amount of mitochondrial DNA per cell, either alone or in conjunction with alpha-factor treatment. In a cross, we would expect to see an increase in the transmission of mitochondrial genes, i.e., an increased bias, from treated p5 cells, larger for cells treated with alpha-factor alone, smaller for cells treated with hydroxyurea or alpha-factor and hydroxyurea. Some further insights into the effects of hydroxyurea treatment were obtained (data not shown). It was found that the bias of the cross p5 x ID4/1 increases progressively with increased time of incubation in hydroxyurea (up to two hours) ;even after only 45 minutes of treatment, the output was distorted somewhat in favor of markers from the treated parent. This result is consistent with there being some continued synthesis of mtDNA in drug-treated cells, using endogenous deoxynucleoside triphosphates. In these experiments hydroxyurea was shown to inhibit exogenous adenine incorporation into nuclear and mitochondrial DNA even during a 30-minute pulse of label following the addition of the drug; inhibition remained high during subsequent pulses at 45, 90, and 120 minutes of hydroxyurea treatment. When hydroxyurea is removed and the cells incubated in drug-free medium for two hours prior to mating, the bias decreased somewhat and both nuclear and mitochondrial DNA synthesis (using exogenous adenine) had resumed. Thus, even though hydroxyurea is not completely effective, it does appear to reduce the accumulation of mtDNA in cells treated with alpha-factor relative to that occurring in cells treated with alpha-factor alone and does show a partial inhibition of the genetic effects of alpha-factor treatment. Table 2 gives the effects of alpha-factor and hydroxyurea on both transmission and uniparental inheritance. In every experiment, treatment with alphafactor increased the transmission of mitochondrial genes from the a parent, as and DEMKO(1974) and previously demonstrated by DEMKO(1975), PERLMAN PERLMAN et al. (1976). The increase was coordinate for the Cs,Es, Os, and Ps genes; the effects on transmission can be most easily seen by looking at the average transmission for these four loci. Zygotes that were uniparental for one or more of these genes were produced in substantial numbers in every cross where the transmission was biased in favor of the sensitive alleles being scored.
X
a
@OS
p5
csos
N123
ID4/1 CREEOR ID4/1 CREEOR ID4/1 CREROR 41-1 CREROR
1-1/1 CROR 1-1/1 CROR
NI23 COP19 CSOSPS CRORPR
N123 ID4/1 CXESOS CREROR
a
A
-
A
-
A
-
A
-
A H AH
-
CY A AH
-4H
A H
-
A H AH
-
A H AH
-
A H AH
-
treatment
a parent
f Determined by replica-plating entire clones.
N -Sample size. * Significantly different from controls at 5% level.
DEMKO(1975)
UP12
Experiment
Cross
-
83.7 66.8 83.7 93.7 86.3 89.0 38.8 56.3* 61.7 74.9* 67.7 83.6* 78.8 81.8
25.5 38.1' 34.4* 30.5 61.4 74.1* 63.7 66.9 14.9 23.4' 17.6 16.0 51.5 71.8* 68.2' 58.1
CS
-
22.9 33.3* 31.0' 27.5 60.8 76.5' 63.0 61.1 16.2 19.2 17.4 12.3 58.2 67.7 64.7 61.7
OS
84.0* - 69.0 85.6 95.4' - 88.0 90.8 41.2 44.8 57.3' 59.5' 61.0 61.7 75.6* 75.6* 68.2 68.7 83.8' 83.2' 77.4 81.3 -
-
-
-
-
-
-
25.4 37.8' 34.4* 28.6 63.3 74.9' 63.9 64.9 -
ES
PS
Percent transmission
-
83.9 67.9 84.7 94.6 87.2 89.9 41.6 57.7 61.5 75.4 68.2 83.5 78.1 81.6
24.6 36.4 33.3 28.9 61.8 75.2 63.5 64.3 14.9 23.0 19.9 16.1 54.4 67.1 66.9 61.8
X
? ? ? ? ? ? 502 597 397 4-46 534 535 430 386
-
654 378 552 604 521 459 606 583 328 380 597 457 361 291 286 227
N
5 15 3 7 16 34.4* 6.6 9.9 46.2' 7.9 15.0 3.1 12.0* 8.4 34.7' 21.7 41.7* 7.7 16.6'
-
2.8 4.3 1.3 1.7 9.3 23.0' 16.6* 15.9' 3 1 0
c5
-
2.7 9.9' 7.1 35.2* 19.5 37.9' 6.4 14.4*
-
-
-
-
-
-
-
-
-
2.3 4.0 1.3 1.1 10.3 24.3 * 18.6' 17.5*
ES
~~
2.7 9.0* 8.4 32.6' 18.4 38.3' 7.4 17.1'
-
-
-
5 19' 6 11 15 -
-
2.5 5.0 2.8 1.9 12.1 26.8' 16.1 18.5 2 1 1
05
-
-
-
-
-
-
2 1 1 4 11 7 7 13
-
-
PS
2.5 4.4 1.8 1.6 10.6 24.7 17.1 17.3 2.3 1.o 0.7 4.7 15.0 5.3 6.3 14.7 34.4 6.6 9.9 4.6.2 7.9 15.0 2.8 10.3 8.0 34.2 19.9 39.3 7.2 16.0
X
Percent uniparental zygotesf
Effect, on transmission and uniparental inheritance, of treating parents with alpha-factor ( A ) and/or hydroxyurea ( H ) , or cycloheximide ( C Y )
TABLE 2
393 400 386 360 397 400 398 395 100 100 100 100 100 loo 100 100 100 96 91 141 52 114 147 521 424 438 196 609 758 608 181
N
g
m
w
9 F
$
E
3
n
in
m
627
INHERITANCE O F YEAST MITOCHONDRIAL GENES
And in every case, the frequency of such zygotes was increased by alpha-factor treatment. As expected from the labelling experiments, hydroxyurea alone consistently increased both the transmission bias and frequency of uniparental zygotes, but the effect was usually not statistically significant and was always smaller than that of alpha-factor. Hydroxyurea plus alpha-factor produced results similar to hydroxyurea alone, as expected from the incomplete blockage of mtDNA synthesis by hydroxyurea. The stock p5 is a mutant derived from stock N123; it is characterized by PERLMAN and enhanced sensitivity to petite induction by UV (MOUSTACCHI, MAHLER1976). It also shows a marked increase in transmission of mitochondrial genes relative to N123 (FRAENKEL 1974; MOUSTACCHI, PERLMAN and MAHLER1976), and an increased frequency of uniparental zygotes (BIRKY 1975b; DEMKO1975). These effects are verified and illustrated in Table 2 by crosses of N123 and p5 by strains ID4/1, COP19, and 1-1/1. The data are all consistent with p5 having a higher mtDNA content than N123, and this is verified by direct measurements showing that p5 has about twice as much mtDNA PERLMAN and MAHLER1976). as N123 (MOUSTACCHI, The correlation between input bias and the frequency of uniparental zygotes produced in a cross can be visualized by plotting the percent zygotes uniparental for a particular allele versus the transmission of that allele; Figure 3 summarizes, in this manner, the data from all crosses done in the course of this study. In general, crosses produced very few zygotes uniparental for an allele unless
1
50 m m Y
30 L
m E
=I
20
8
0.
10
..:. . ..
-
.'
: * *
e
.
.
.
*
.
.
*
% Tranamisolon FIGURE 3.-Percent zygotes uniparental for markers from NI23 or p5 plotted against percent transmission for the same markers. Where more than one locus was studied in a cross, the plotted data point is the average for all loci.
C. WlLLIAM BIRKY, J R .
et d.
TABLE 3 Correspondence between uniparental zygote frequency and transmission or genome ratio in crosses of N123 or pS(aCS) x l - l / l ( a C R )
a parent
P5 P5 P5 P5 NI23 P5 P5 N123 P5 P5 P5 P5 N123
a parent
treatment
a
cy
+ cyclo
a+m
HU a
+
cyclo HU cyclo cyclo
a
+
*
starved
t a+HU
from a
Genome rativ
Percent zygotes uniparental for CS
N
93.7 90.1 89.0 86.3 83.7 83.7 81.5 80.1 79.4 73.8 73.6 71.8 66.8
14.9 9.1 8.1 6.3 5.1 5.1 4.4 4.2 3.9 2.8 2.8 2.6 2.0
46.2 23.2 15.0 7.9 34.4 9.9 8.1 16.2 15.6 6.5 5.9 5.1 6.6
52 125 147 114 96 141 37 124 84 1(48 102 99 91
Percent CS
Samples of a culture of N123 or p5 were treated with alpha-factor (a), cycloheximide (cyclo), and/or hydroxyurea (HU), or starved for histidine, as describedin MATERIALS AND METHODS, then mated to 1-1/1. Genome ratio = % CS/(lOO-% CS). Data from DEMKO(1975). * 1-1/1 starved for adenine. Mating in minimal medium plus adenine and histidine.
+
the output was strongly biased (>> 50% transmission) for that same allele. The exceptions may be significant, and will be discussed in detail later. Table 3 further illustrates the correlation between bias in transmission frequencies and the frequency of uniparental zygotes. Aliquots of a culture of N123 and of a culture of p5 were treated with various combinations of alphafactor, cycloheximide, and/or hydroxyurea, or starved for histidine, then mated to aliquots from a culture of 1-1/1. Except for these treatments, and for the uvsp5 mutation, all zygotes produced in these crosses had identical nuclear and mitochondrial genotypes and were in as nearly identical physiological conditions as was possible. (Some of the results are shown in more detail in Table 2.) Increasing transmission frequencies of the Cs allele from N123 or p5 correspond to increasing frequencies o€ zygotes uniparental for this same allele. The bias in each cross can be seen most clearly when expressed as the genome ratio = % Cs / (100 - % Cs), which is simply the ratio of Cs to CR alleles in the random diploid output. On this scale, an unbiased cross (50% Cs) would have a genome ratio of 1. We conclude that a biased input of mtDNA molecules may be a necessary and sufficient condition f o r the production of uniparental zygotes in most yeast crosses, and that in general the greater the input bias the greater the frequency of such zygotes. Generality of the phenomenon Most of the data in this and previous papers (BIRKY 1974, 1975a, 1975b)
629
INHERITANCE O F YEAST MITOCHONDRIAL GENES
have been obtained with only a few different strains and crosses. However, we have found substantial numbers of uniparental zygotes, correlated with transmission bias and mitochondrial DNA input, in crosses involving a large number of different stocks (and hence different nuclear genetic backgrounds) obtained from many different laboratories. Complete data will be published later; here we show only a few selected crosses to indicate that the phenomenon is quite general (Table 4). Our present data are also concentrated on the cap I , ery I , and oZi-I loci, which collectively cover about 15-20% of the mitochondrial genome according to physical map data (NAGLEY et al. 1976; SCHWEYEN et d. 1976; SANDERS et al. 1976; MORIMOTO et aZ1976). However, as demonstrated in Table 2, we have also found zygotes uniparental for the par1 locus, which is on the opposite side of the genome, and the correlation with input holds for this locus as well. Unfortunately, our par-I allele shows noncoordinate transmission in some crosses, possibly because of nuclear modifier genes conferring partial paromomycin resistance; such genes have been identified in several of our stocks (M. WAXMAN, unpublished observations). A complete study of this locus, and extension of studies of uniparental inheritance to other loci, is in progress. Uniparental zygotes have been seen in crosses using glucose, galactose, glycerol, acetate, or ethanol as carbon sources, and thus in both glucose-repressed and derepressed cells. In many instances, a high transmission bias was induced by treating the parent of mating type a with alpha-factor, or by treating one parent or the other with cycloheximide. But uniparental zygotes were also seen in crosses where these special treatments were not used. Although most or all crosses do show increasing frequencies of uniparental zygotes with increasing input bias, the relationship between bias and uniparental frequency may differ from cross to cross. Figure 4 compares the relationship between uniparental frequency and genome ratio for the cross p5 X 1-1/1 (data from Table 3) with the cross p5 X ID4/1 (data from Table 2 and unpublished). It is clear that these crosses differ, the one with ID411 being more responsive to increasing genome ratio than the one with 1-1/1. The difference may be a consequence of differences in the nuclear or mitochondrial genomes, or both. The data from both crosses show an approximately linear relationship between genome ratio and uniparental zygote frequency; this linearity is not predicted by any simple model of the mechanism of uniparental inheritance TABLE 4 Additional crosses producing uniparental zygotes Cross
D243 OR x 2-3b 0 s 4810 P R x 6-2/5 P S 4810 ER diploid x OEC ES 4810 E R diploid x DPI ES 4120E E R x LT70 E s
Transmission
Allele
%
N
OS
49.5 63.7 70.7 70.1 73.8
178 171 338 3658 221
PS
ES ES ES
U n p t a l zygotes
N
13.6 32.0 7.8 6.0 12.0
88 1083 293 368 100
c. WILLIAM
630
BIRKY, JR. et
6or
al.
T
c
50
Genome ratio
(CyCR)
FIGURE 4.-Percent zygotes uniparental for the C S allele from p5 plotted against the genome ratio (% Cs/% C R in the random diploids) ; comparison of the relationship between genome ratio and uniparental frequency using 1-1/1 (open symbols) and ID4/1 (solid symbols) as the (Y parent. Bars indicate 95% confidence intervals.
and may reflect the fact that we have not studied the entire range of possible genome ratios.
What is the fate of the missing markers? Uniparental zygotes, like biparental zygotes, are formed by the fusion of two haploid yeast cells. Both parents carry mitochondrial DNA and a complete set of markers; any parent cells in which one o r more markers were deleted would be detected as petite mutants. The first question to be answered is, “What happened to the missing markers?” Two possibilities exist. First, they may not be replicated, and after ten to 20 generations would be carried on such a small to as to be undetectable, even if all fraction of all mtDNA molecules ( were present in a single cell. Note that this would require virtually no replication during the approximately 20 generations required to produce a zygotic clone of the size usually analyzed. Consider a zygote containing 100 mtDNA molecules of each of two genotypes, A Rand AS.If the AS molecules were not replicated, in ten generations the ratio of the two types of molecules would be approximately l o 5AR : lo2AS,or about l o 3: 1. It is of course possible that the missing molecules are enzymatically destroyed in the zygote and/or its early progeny; for the moment we will treat this as a variant of the replication failure hypothesis. The second possible fate of the missing markers is that they are in some fashion transformed into their alleles. The only known mechanism for such a transformation is gene conversion: a “mating” in the zygote between a molecule carrying an AR allele and another carrying an AS allele, followed by recombi-
INHERITANCE O F YEAST MITOCHONDRIAL GENES
631
nation at the A locus, could result in the conversion of the ARallele to AS,or uice wrsa, so that both molecules will be AR or both As. Evidence that gene conversion occurs in yeast mitochondria has been obtained by WILLIAMSON and FENNELL (1974) and by VAN WINKLE-SWIFT and BIRKY (in preparation); also DUJONet al. (1974,1975) argue that there are multiple rounds of random mating between mtDNA molecules in the yeast zygote. BIRKYand SKAVARIL (1976) showed by means of computer simulations that gene frequencies would drift in the zygote and its progeny due to multiple rounds of random mating and gene conversion, eventually leading to the loss of one allele or the other, i.e.,to a uniparental zygote. Although the simulations suggested that this drift would be too slow to produce large frequencies of uniparental zygotes, this hypothesis could not be ruled out. Moreover, it was clear a priori, and was verified by the simulation, that uniparental zygotes would be produced most often when the input of mtDNA molecules was highly biased; in such cases the loss of the minority allele occurs more rapidly and might conceivably be completed before the allele could be “rescued” by being segregated into a pure population in a bud. A test of this hypothesis depends upon the fact that gene conversion results from the repair of mismatched bases in heteroduplex regions of DNA molecules. The length of a heteroduplex region that is repaired as a single unit, and that consequently behaves as a single unit of gene conversion, is believed to be small [mode of several hundred base pairs in yeast nuclear chromosomes according to FOGEL and MORTIMER (1969) ;less than three thousand base pairs in the phage according to WILDENBERG and MESELSON (1975)l. Thus “unlinked” markers such as the cap2 and olil loci or the eryl and olil loci in the yeast mitochondrial genome, which are about 11-15 x IO3 or 5-1 1 x IO3base pairs apart (NAGLEY et al. 1976; SCHWEYEN et al. 1976; SANDERS et al. 1976; MORIMOTO et al. 1976) should rarely be included in the same heteroduplex repair tract. This and expectation is borne out by the genetic studies of DUJON, SLONIMSKI WEILL(1974). The two members of such pairs of loci should accordingly behave completely independently with respect to gene conversion and random drift, and should become uniparental in an independent manner. Specifically, if pl is the total frequency o f zygotes uniparental f o r one allele at one locus, and p z is the total frequency of zygotes uniparental for the corresponding allele at the other locus, the frequency of zygotes uniparental for both alleles should be given by p1p2. The frequency of zygotes uniparental at neither locus is qlq2 where q = l-p, and so forth. The C and E loci, in contrast, are substantially closer (about 2-6 X IO3 base pairs) and are believed to be included in the same heteroduplex in some recombination events (DUJON, SLONIMSKI and WEILL1974; PERLMAN and BIRKY1974) ; these two loci might be expected to become uniparental in the same zygote more often than predicted from the product of their individual uniparental frequencies. At the other extreme, we might find that all loci become uniparental together in every zygote. In this case (“coincidence”), for example, the cross CSW X CRORwould produce zygotes uniparental for C8 and Os,or for CRand On,but never for Csalone, or Osalone, etc.
c. WILLIAM BIRKY, JR. et al.
632
-d
e
5
L
,x c -2 U
5
3
-d
-_c
.v w
c
$4
.U
c
3
" ?
:U
I
S&
1
bnL
2s
CFI) E
8% .>.s -e8 FI)Q
2,.2 E
WE: \D
2 2
CL8
a
4-s
4
w &
i 23 B
3 -
a b
$4
.; ._ 22 $5 0
0
E .$;. h %
O 2 8 .I?
-oU ' EpR
.v
U
c
L .Q
H
D
U
%
f " 2
\
E:
$E
k
I N H E R I T A N C E O F YEAST M I T O C H O N D R I A L G E N E S
633
The relevant data are given in Table 5. It can be seen that, in every case, the loci C and 0 o r E and 0 become uniparental together more often than predicted on the hypothesis of independence. The same is true for C and E, but these t w o loci, as expected from their relatively close linkage, become uniparental together more often than the “unlinked” pairs. These results can be summarized by saying that there is a strong tendency for a zygote to become uniparental for whole mtDNA molecules rather than for individual loci. Additional evidence for this will be presented below and in a subsequent paper. Although these results do not say that random drift and gene conversion play no role whatsoever in uniparental inheritance in yeast, they do say that molecules of the minority genotype must fail to replicate. Genetic experiments alone cannot readily distinguish between failure of molecules to replicate followed by dilution, and outright enzymatic destruction. Hereafter, we will speak of molecules as being “lost” without prejudging the issue. Whatever the fate of the lost markers, it is appropriate to ask why they are not always lost as complete linkage groups (with predicted values for the coincidence hypothesis as shown in Table 5). The answer is almost certainly that some markers may be rescued by recombination from molecules destined to be lost, and transferred to molecules destined to be replicated. Closely linked markers such as C and E would be more likely to stay together, i.e., to be lost or transmitted together, on this hypothesis. The extent to which two markers do go uniparental together would then be a measure of their linkage. (Attempts to order the 0 locus relative to the C and E loci using uniparental zygote data have failed; this is not surprising since these three loci cannot be ordered by recombination mapping and 0 appears formally unlinked to C and E . ) If this hypothesis is correct, we would expect that zygotes in which two of the three loci are uniparental for alleles from the majority parent should show very high transmission of the majority allele at the third locus, because only one or a few copies of the minority allele at the third locus would be rescued in any given zygote. Further, zygotes uniparental at only one locus should show very high transmission at the other two loci for the same reason. This expectation is borne out by the data in Table 6. In this experiment (p5 PESOS X ID4/1 CREROR), a number of zygotes were scored as uniparental at one or two loci. A sample of those that were uniparental sensitive at only one or two loci was tested by replica-plating to determine the frequency of each genotype, and of the sensitive allele at the remaining locus or loci; in every case, that frequency proved to be very high. This is further evidence that entire genomes tend to be lost or transmitted together in uniparental zygotes, i.e., that the uniparental mechanism acts on molecules rather than loci. If this is true, then the three loci studied here (capl, eryl, and O M )should become uniparental at approximately the same frequencies. That this is so can be seen by examining the data for individual crosses in Tables 2 and 5, or by looking at the mean frequencies of uniparental zygotes for a number of crosses shown in Table 7. Only crosses producing more than 10% uniparental zygotes are included in this table in order to be certain that matings between wild-type
87.0 99.5 98.9 100 99.2 70.0 92.6 99.8 93.4
(8 clones)
Mean
CSES
Mean
97.7 95.0 94.3 96.3 97.0 98.9 96.6
CSOS (6 clones)
Mean
0.4 12.9
100 100 100 99.6 87.1 100 99.0 97.8
2.2
1.o
3.5
96.5
ESOs (8 clones)
CEEsOs
CSESOS
Clones scored as as uniparental for
2.3 5.0 5.7 3.7 3.0 1.1 3.4
CsEROS
6.6
0.8 30.0 7.4 0.2
13.0 0.5 1.1
CSEsOR CREROS
CRE5OR
@EROR
Output ratios (% diploid cells)
CREEOR ZES
100 100
100
1010 100 100
100 100 100 100
97.7 95.0 94.3 96.3 97.0 98.9 96.6
100
iao
100 100 100 100 100 100
100
100 100 100 100 100 100 100 100
10.0 100 100 100 100 100 100
99.0 97.8
100
99.6 87.1
100 100
96.5 100
ZCs
Complete zygote clone analyses of clones scored b y the replica-plating test as uniparental at one or two loci
TABLE 6
ZOS
87.0 99.5 98.9 100 99.2 70.0 92.6 99.8 93.4
100 la0 100
100 100 100 100
10'0 100 100
100 1 010 100 100
100 100
N
216 22 371 403 359 493 229 598
233 535
n.
T m
4
9
;
m,
z
E: > 264 574 561 519
a 2m
P
m
433 348 332 391 494 41 0
03 P
0,
80.0 67.3 98.6 98.6 94.5 100 99.0 94.9 37.6 85.6 86.0 83.9 52.9 100 80.7 91 .o 79.3 55.0 88.1, 98.0 96.6 93.8 88.7 99.5 87.2
CUES08
0.1
0.5
0.3
2.5
CRESOE
0.1
0.9
0.3
0.4
0.5 3.5
CSEROS
6.8
3.4 5.4 10.4
2.0
6.7 8.5 16.6 14.5
8.9 15.6 2.3
2.6
14.5! 8.51
1.o 5.1 62.4 13.6
2.0
17.5 32.7 1.4
~
0.1
0.8!
12.6
45.6
4.9
0.9!
0.5
4.1
0.05
0.2!
Output ratios (% diploid cells)
0.5! 2.8
16.0! 8.5!
0.3!
100 99.5 94.7
1 0
80.0 67.3 98.6 99.1 98.0 100 99.0 94.9 62.5 88.8 95.1 99.5 54.4 100 87.3 99.7 100 69.5 83.2 100 100
82.5 67.3 98.6 98.6 94.5 100 99.0 94.9 62.5 88.7 99.8 100 100 100 99.5 99.4 95.9 69.5 83.2 1010 100 100 99.1 99.5 94.1
100
100 80.8 91.3 79.3 69.5 91.5 98.0 96.6 93.8 88.7 99.5 89.8
52.9
100 100 99.1 100 100 100 100 100 99.9 86.0 84.4
N
377 150 2Q7 129 337 373
462
314
609
451 398 393 194
4.57 435 7m 563 282
216
647
405 636
__
! Indicates resistant genotypes which should not have been found in the clones, according t o the replica-plating test. These indicate an error either in the replica-plating test (most likely in the case of the two “CS” clones with large frequencies of unexpected genotypes) or in the zygote clone analysis (most likely in the other cases where only one or two cells had unexpected genotypes). See MATERIALS AND METHODS for further discussion of sources of error.
Mean
Mean Cs (9 clones)
E* (4 clones)
Mean
OS (9 clones)
Clones scored as as uniparental for
TABLE 6-Continued
636
c. WILLIAM
BIRKY, JR. et
al.
TABLE 7 Frequency with which different loci become uniparental, and transmission frequencies from same crosses Lpci present in crosses
c,
E E, 0 c, 0 c, E, 0
Mean percent uniparental zygotes C E 0
Number of crosses
20.9 22.2 21.2
11 9 11 9
20.4 20.9 20.9
Data include only crosses involving NI23 or p 5 , with
20.4 23.5 20.4
C
71.1
70.1 68.8
Mean perFnt transrmssion
E
0
71.7 69.6
-
-
69.6
69.1 69.8 69.1
>10% uniparental zygotes.
cells and petite mutant cells lacking markers do not influence the results, but the same relationship is seen in crosses with fewer uniparental zygotes. Thus, these three loci behave coordinately with respect to uniparental inheritance, as well as with respect to transmission frequencies in random diploids. Although this coordinate behavior has been demonstrated for only three loci, they include at least two functionally different regions of the genome and include regions far enough apart to behave independently in recombination. It would require ad hcx assumptions to believe that the region studied is not representative of the entire mtDNA molecule with respect to uniparental inheritance.
Uniparental inheritance is independent of zygote budding patterns As illustrated in Figure 5, two haploid yeast cells that mate form the opposite
a -
-Y
FIGURE5.-Illustration of the effect of bud position and incomplete mixing of mitochondria on mitochondrial gene recombination and transmission. See text for explanation.
I N H E R I T A N C E O F YEAST M I T O C H O N D R I A L G E N E S
637
ends of the dumbbell-shaped zygote. The zygote will produce buds from the narrow neck (central buds), or from either end (end buds), or any combination of these positions. Different crosses produce zygotes having different frequencies of end and central buds, and different zygotes from the same mating mixture may produce different bud patterns. STRAUSBERG(1976) showed that the mitochondria contributed by the two parents are not thoroughly mixed until some time after formation of the first bud. Prior to this time, substantial mixing occurs only in the neck of the zygote, so that first end buds contain low frequencies of recombinant genotypes and are very often pure for one parental genotype, while first central buds are less frequently pure for parental genotypes and tend to contain a high frequency of recombinant mtDNA molecules. Since the progeny of the first bud constitute about 50% of the cells of the entire zygotic clones, those zygotes with first central buds produce clones with a higher average frequency of recombination than zygotes with first end buds. A first end bud leaves the mother cell with a highly biased ratio of parental mitochondrial genotypes; such a bias reduces the frequency of detectable recombination events (DUJON,SLONIMSKI and WEILL1974). To study the effect of bud position on uniparental inheritance, we isolated by micromanipulation 93 zygotes from the cross p5 x ID4/1, which produces a high frequency of uniparental zygotes, and recorded the position of the first one, two, or three buds. After each zygote had produced a clone, the transmission of all three markers from the p5 parent (Cs, Es, and Os) was determined for each zygote. Nineteen zygotes were uniparental for one or more (usually all three) markers. The total frequency of zygotes uniparental at a locus, averaged over the three loci, was 17.6%, not significantly different from 20.2% for 553 zygotes from three control crosses analyzed by the usual method without manipulation; thus the manipulation and observation did not affect the operation of the uniparental inheritance mechanism. Table 8 compares the frequencies of different budding patterns in uniparental and biparental zygotes: x2 tests show no significant differences, whether one looks at the first bud only, the first two buds, or the first three buds. We conclude that the budding pattern of the zygote does not have a strong influence on whether or not the zygote will be uniparental. Three further conclusions follow: (1) Uniparental inheritance is not due to the death of a zygote following the production of one or two pure buds from the end of the zygote housing the majority mitochondrial genotype. Of the 19 uniparental zygotes, 12 produced three buds and six produced two buds during the period of observation. It is likely that all zygotes eventually produced more than three buds: STRAUSBERG (1976) and KLEESE1975) have found that zygotes rarely die and others (e.g.,FORSTER after producing only one or two buds. (2) It is a priori likely that the uniparental mechanism operates once, in the zygote, to identify the minority genotype and determine that the genotype will be eliminated. If this determination were made anew in each bud, it would be difficult for any zygote to become uniparental, as buds from the minority end would have a majority of such molecules, which would thus be rescued. Our
c . WILLIAM
638
BIRKY, JR. et
al.
TABLE 8 Position of early zygote buds and uniparental inheritance 1st
Bud position 2nd
3rd
Uniparental zygotes Number Percent
7 12 1 6
Biparental zygotes Number Percent
25 19
21
100 22 19 18 20
53
5
50 23
3 1
19 14
0 21 38 14 4 2 17 13 6
0
0
1
9 3 1 2
75 82
0 78 81 82 80 50 77 81 86 100
Bud positions were scored as central (C) or end (E). The first end of the zygote to form a bud was called E,, and the opposite end E,. The position of the first three buds was noted for 55 zygotes; the first two only for 92 zygotes; and the first bud only for one zygote.
data verify this, because they contain three uniparental zygotes in which the first bud came from one end and the second bud from the other end. In these zygotes either the first o r the second bud must have come from the minority end. We conclude that the minority molecules are identified and irreversibly determined for loss at least before the production of the second bud, and cannot be rescued by incorporation into a bud. The frequency of this E,E, budding pattern is approximately the same in uniparental and biparental zygotes. (3) These data provide further evidence against the gene conversion/random drift mechanism for uniparental inheritance. According to that hypothesis, zygotes with the highest frequencies of recombination, i.e., zygotes with first central buds, should be more likely to become uniparental than zygotes with first end buds. This relationship is in fact observed, but the difference is small and is not significant. Again, we cannot rule out some contribution of gene conversion/random drift to the mechanism of uniparental inheritance.
How are molecules determined for replication or loss? In most of the crosses we have studied, zygotes become uniparental for markers from only one parent, the one providing the majority input. To account for this observation, two general classes of models can be envisioned. In the first class, the mtDNA molecules from the two parents are marked in some fashion, e.g.. by modification of one or the other, or by modification of different sites in each, while they are still present in the parent cells. It is then necessary for the cell to ‘‘count” molecules in order to identify the minority genotype for loss. This could be done, f o r example, as shown in Figure 6, where loci closely linked to the mating type locus would produce a nuclease (analogous to restriction enzymes) in equal quantities but each one specific for the mtDNA molecules
639
I N H E R I T A N C E O F YEAST MITOCHONDRIAL G E N E S
input ratio
6:3:2:1
.1
output
4:l
Uniparental zygote FIGURE &-A “counting” mechanism for uniparental inheritance. Genes at or near the mating type locus produce enzyme Ma and Ma, which differentially modify mtDNA in the a and a parents. Nucleases Ra and R,, produced in the zygote by genes at or near a and a, degrade mtDNA not modified by Ma and Ma, respectively. Partial degradation produces a biparental zygote with amplified bias; further degradation produces a uniparental zygote.
contributed by the other parent. Progressive action of these enzymes, at the same rate, would eliminate the minority molecules first and result in some cells being uniparental for the majority genotype. (The “counting” is done by the nucleases.) An important feature of this model, and probably of all members of this class of models, is that it would amplify the input bias so that the output was more extremely biased in favor of the majority parent. The alternative class of models is composed of those in which the parental molecules are unmarked. This means that they cannot be counted; in order to insure that only minority molecules are eliminated, it is necessary to postulate
640
c. WILLIAM
input ratio
BIRKY, JR. et
al.
6:3-2:1
8 27
+ or
12 27
Uniparental zygote output 310
I) Biparental or
6 -
zygote output 2:l
I) Biparental
27 or
1 27
zygote output 112
I) Unip a renta I
zygote output 0:3
FIGURE 7.-Example of a hypothetical uniparental inheritance mechanism involving replication of a small random sample of mtDNA molecules. Only molecules attached to the three sites on the cell membrane survive enzymatic degradation. Four classes of zygotes are produced; because a real zygote will have about 100 or more mtDNA molecules, the frequencies of the classes are given approximately by the binomial distribution. The random diploid output = (2/3) = 2: 1. (8/27) * (3/3) (12/27). (2/3) (6/27) .(1/3)
+
+
I N H E R I T A N C E O F YEAST M I T O C H O N D R I A L G E N E S
64 1
some sort of competition between molecules for the privilege of replication (or escape from random degradation). An example is illustrated in Figure 7; it is assumed that there are a limited number of sites (membrane attachment sites, or replicating enzymes) for which all mtDNA molecules must compete. Alternatively, these sites might be required to protect molecules from enzyme degradation. A model of this sort will amplify the input bias only if the number of sites is greater than the number of molecules of the minority genotype. In the case of yeast, this would require so many replicating sites (ca. 50 or more) that no uniparental zygotes would be produced, unless the unit of replication is an entire, homoplasmic mitochondrion containing many mtDNA molecules. Experimentally, we can distinguish between these two models by determining whether the output bias is always or usually greater than the input bias. The input bias is known only if one knows the mtDNA content of cells of both mating types, a measurement that is difficult IO do on a large number of stocks. Alternatively, one can mate many different tester stocks to two strains whose mtDNA contents differ by a known factor. We have done experiments comparing the mutant uvsp5 with its parent strain N123; log-phase cells of p5 have approximately twice as much mtDNA per cell as N123 with either glucose or glycerol as the carbon source (MOUSTACCHI, PERLMAN and ~ H L E R1976). If the output bias equals the input bias (no amplification), then the output using these two testers can be related as follows: Let n equal the output frequency (and hence the input frequency) of markers from N123; then 1 - n equals the output and input from the tester. In the uvsp5 mating, the zygote receives again 1 - n molecules from the tester parent, and 2n from the uvsp5 parent. The expected output from the cross with uvsp5 is then 2n/(2n 1 - n) = 2n/(n 4-1 ) . The exact magnitude of the bias amplification predicted by a counting moldel cannot be specified at present, because it depends upon the details of the specific model and upon the value of several parameters. Table 9 summarizes the available data and the results of these calculations; it is clear that bias amplification is usually observed in crosses involving uvsp5. GOLDTHWAITE, CRYERand MARMUR (1974) worked with cultures which had markedly different mtDNA contents when grown on different carbon sources. Several crosses were strongly biased but the data show no consistent bias amplification. GUNGE(1975, 1976) has performed similar experiments using pairs of isogenic haploid and diploid strains; the diploids should have approximately twice the mtDNA content of the haploids (GRIMES,MAHLERand PERLMAN 1974). GUNGE’Sdata (1975, 1976) consistently show bias amplification when calculations are done as described above. We have preliminary data obtained with a different pair of haploid and diploid strains that show significant bias amplification with some tester strains, but not with others. These results are compatible with counting models as mechanisms for uniparental inheritance, and we conclude that such models are worthy of further examination. But the experiments do not conclusively demonstrate bias amplification; to do this, crosses must be done in such a way as to eliminate premating synthesis (e.g., by hydroxyurea treatment), which could change the effective
+
c. WILLIAM
642
BIRKY, JR.
et al.
TABLE 9 Bias amplification: obserued transmission of mitochondrial alleles from p5, compared to transmission expected on basis of crosses of same tester strain to NI23 i f bias is not amplified Tester
Transmission observed
Expected
Observedexpected
__
Xa
~~
1-1/1
ID-4/1
41-1 COP/152 COP/13
0.585 0.8031 0.79211 0.843% 0.890% 0.766s 0.615 0.693% 0.618 0.588s 0.84@$
0.54+4
0.516 0.650 0.625 0.747 0.801 0.782 0.588 0.593 0.395 0.429 0.683 0.259
0.069 0.153 0.167 0.099 0.089 -0.016 0.027 0.100 0.223 0.159 0.166 0.285
2.30 76.6 * 63.9 * 12.3 * 0.64 0.99 15.2 * 108 * 4.76** 35.5 * 154 *
Data for 1-1/1 and COP/152 are pooled for the C and E loci; for ID-4/1 and 41-1, data are pooled for the C, E, and 0 loci; for COP/19, data are pooled for the C, 0, and P loci. * P 0.001. * * P 0.05. Ethanol carbon source. 11 Glycerol carbon source. $ Data from DEMKO (1975). $ Data from RALPE KEIL (personal communication).
+
<