International Journal of Innovation, Management and Technology, Vol. 4, No. 1, February 2013
University Exam Scheduling System Using Graph Coloring Algorithm and RFID Technology Akhan Akbulut and Güray Yılmaz, Member, IACSIT
their unique student IDs. Card reader sends this bit string to the web service to query the database for exam details. The response returns from the web service and the collection of answer are listed in the screen. RFID technology is widely used in education and e-learning applications, even supply chain management, automatic payment and biotelemetry applications [3].
Abstract—In this study, we developed a system that provides a solution to exam timetabling problem in universities. The existence of large number of students and courses makes it difficult to schedule exams during midterm and final weeks. Each end of semester brings much work for the department to plan exams. Given solutions may not be always optimum for some students and lectures; double major or repeat students’ exams are not easy to plan manually without using any tools. Our system aimed to schedule different exams in same halls simultaneously. Thus, halls’ capacity will be used more efficiently and cheating attempts will be decreased considerably. Index Terms—Education graphcoloring, RFID.
planning,
exam
II. RELATED WORKS Different approaches are used to solve timetabling problems. Carter and Laporte considered timetabling problems in four categories; classification methods, sequential methods, generalized search techniques and constraint satisfaction approaches [4]. Classification methods after grouping exams that satisfy hard constraints, assign the exams in order to satisfy soft constraints as much as possible [5], [6]. Sequential methods assign the exams to given periods by using sorting methods so that they do not conflict with each other. In this method generally graph coloring techniques are used [7]. Generalized search methods are the most common ones. Some of them can be listed as tabu search, simulated annealing and genetic algorithms. Map coloring is a type of problem that can be solved by using graph coloring approach. This approach separates the area to more than parts. Without coloring the two adjacent parts to same color all map is colored. This method is used in time tabling problem in 1967 by Welsh and Powel [8]. Each node represents exams and the edge between nodes represents the conflict between these exams so that they cannot be colored to same color. Coloring an exam means scheduling it in a given period because each color represents a different time period.
scheduling,
I. INTRODUCTION Exam timetabling problem is faced each semester in universities. As the requirements and the constraints of the problem change depending on the students, lecturers, exams and halls a new timetable has to be constructed each semester. Computer supported timetabling systems help to decrease the required workforce. In this work we have considered the final exam weeks of the universities as our main problem to be solved. Basically, this problem depends on the exam-student, lecturer-exam relations. Solution of this problem is to schedule all exams in a timetable by considering common students that will be attending to these exams and halls‟ capacity constraints. This problem has some specific constraints. In literature they are known as „hard‟ and „soft‟ constraints. Hard constraints are important and they have to be satisfied in order to have a feasible solution. Soft constraints do not have to be satisfied but they make the solution more applicable. As a new point of view it is planned to schedule different exams in same halls at the same time period. The reason is to make use of the halls‟ capacity with 100% performance and decrease cheating attempts. The students which are taking different exams can seat closer so that the usage of capacity of the hall will increase. However, at this point the coordination problem of the students‟ seating positions will arise. The solution that we found to that is using student the identity cards of students that has a RFID tag [1, 2]. Card reader reads the scheduled exams of the student and displays in a screen. Student identity cards hold a bit collection which is matched with
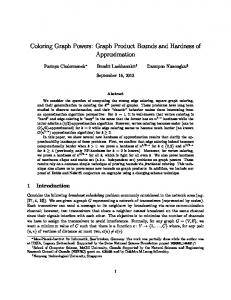
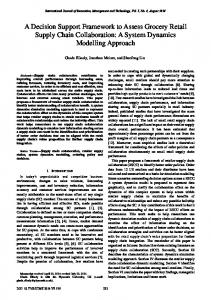
III. PROPOSED EXAMINATION SYSTEM In this part, two algorithms, Hybrid Approach and Graph Coloring Algorithm, flow charts will be explained in detail and then step by step execution will be examined with an example. These two methods are alternative solutions of the same problem and can be applied individually A. Architecture As illustrated in Fig. 1, system consists of three main parts. Exam data is transferred from Students affairs system database to system for processing. B. Main System Execution Fig. 2 illustrates how the program executes the process that must be completed in order to get the time table. Before
Manuscript received April 13, 2012; revised September 20, 2012. Akhan Akbulut is with the Computer Engineering Department, Istanbul Kültür University, Istanbul 34156 Turkey (e-mail:
[email protected]) Güray Yılmaz is with the Computer Engineering Department, Turkish Air Force Academy, Istanbul 34149 Turkey (e-mail:
[email protected])
DOI: 10.7763/IJIMT.2013.V4.359
66
International Journal of Innovation, Management and Technology, Vol. 4, No. 1, February 2013
and displays the user‟s scheduled exams.
examining the input details, constraints of the problem should be defined. In this system there are two types of constraints which are named as “Soft” and “Hard” constraints. The aim is to satisfy all hard constraints and to satisfy soft constraints as much as possible. These are the constraints of the problem and coefficient of each constraint is given in parenthesis;
Fig. 1. System configuration
•
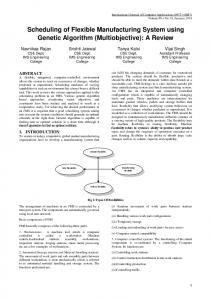
Hard – No student can be assigned to more than one exam in the same time period (100). • Hard – A student may have at most three exams in the same day (100). • Hard – The number of students attending to exams should not be more than the available halls‟ capacity in the same period (100). • Hard – Exams that are taking place in the same time period should have equal durations (100). • Soft – Exams that are most crowded should be placed in timetable primarily. (90). • Student is expected to have one exam in one day depending on the given ratio (80). • Soft – At most four exams should be held in the same period (70). These constraints will be used while implementing the algorithms and will be controlled dynamically. Here are the required inputs for the program execution. First, the required data to start up the system must be given by the user including; days, exams, halls that the exam will be held. Also configuration settings must be provided such that; number of periods in one day, number of exams that will be held at the same period, and maximum allowable ratio of common students between two exams that will be held in same day. At last periods that will not be used during scheduling will be taken from user. All these data will be saved into database. The next step is to create the timetable. In order to create the timetable two different approaches are applied. Details of the algorithms are explained in part 3. Exam timetable is saved in XML format, and tags of the structure are shown in Fig. 3. By using XML format, the timetable is displayed in HTML format to the screen. The output is illustrated in Figure 4. The second part of the system is used by students and lecturers to get information about exam details such that; exam day, hour, and hall. RFID technology is used for that process. Student/Lecturer uses his/her identity card with RFID card reader. System gets the identity tag related to user
Fig. 2. Main program execution
Fig. 3. XML format of schedule
67
International Journal of Innovation, Management and Technology, Vol. 4, No. 1, February 2013
Table II illustrates the common student ratio between exams. First column and row shows the course codes. TABLE II: RATIO BETWEEN EXAMS 101
007
190
310
009
540
006
012
101
100
0
33
0
0
66
33
33
007
0
100
66
0
0
0
33
33
190
33
66
100
0
0
0
33
33
IV. METHOD AND APPROACH
310
0
0
0
100
0
0
0
0
In order to create timetable two different algorithms is used. The algorithms are explained in details with given data set as follows. Data set for exams and students that are taking these exams are given in Table I.
009
0
0
0
0
100
0
0
0
540
66
0
0
0
0
100
0
50
006
33
33
33
0
0
0
100
0
Fig. 4. HTML format of schedule
Exams
A. Hybrid Approach This approach is an implementation of using arrays to gain performance in the execution of the program. The algorithm runs until all days and periods in each day is traversed. In order to schedule an exam into time period, the algorithm checks if the period is full or forbidden time (means that in configuration screen user may select a period as empty to not to place any exams), and all exams are traversed (Figure 5).
TABLE I: EXAMS AND STUDENTS DATA SET Students
CSE 101
S1, S2, S3
CSE 007
S4, S5, S6
CSE 190
S2, S5, S6
CSE 310
S7, S8
CSE 009
S9, S10
CSE 540
S1, S3,
CSE 006
S2, S4
CSE 012
S1, S5
Fig. 5. Hybrid approach flow chart
While placing exams in same period or same day, ratio control between two exams are checked. Ratio control shows the common percentage of students between two exams. According to hard constraints a student should not have more than one exam at the same period. This also satisfies the soft
constraint that the ratio between two exams cannot exceed the given limit. Then the time duration of two exams are checked if they are same, they can be placed in the same time period. In order to show the execution explicitly an example for a given data set will be examined as follows: 68
International Journal of Innovation, Management and Technology, Vol. 4, No. 1, February 2013 TABLE XI: TIMETABLE AFTER ITERATION 7 09:00 11:00
Configuration settings are given as; 3 days, 2 time period for a day and 2 exams per time period. The maximum allowable ratio is selected as 33%. Table III and Table IV illustrates the initial states of the Timetable and Exam Array. Exam Array stores exams which are selected by user to be scheduled. Exams are sequentially scheduled in the timetable. Iteration 1, 2 are illustrated in Table V, Table VI.
24.05.2010
101
007
310
25.05.2010
190
540
006
26.05.2010 TABLE XII: EXAM ARRAY AFTER ITERATION 7
101
TABLE III: INITIAL STATE OF TIMETABLE 09:00 11:00
007
190
540
09:00
26.05.2010 TABLE IV: INITIAL STATE OF EXAM ARRAY
190
310
009
540
006
012
006
012
101
11:00
24.05.2010
101
007
310
25.05.2010
190
540
006
26.05.2010
012
009
TABLE XIV: EXAM ARRAY AFTER ITERATION 7
TABLE V: TIMETABLE AFTER ITERATIONS 1 & 2 09:00 11:00 24.05.2010
009
TABLE XIII: TIMETABLE AFTER ITERATION 8
25.05.2010
007
310
As shown in Table XIII and Table XIV CSE012 is not scheduled in the timetable as it has a 50% ratio with CSE540.
24.05.2010
101
009
101
007
190
310
009
540
006
012
007
25.05.2010
B. Graph Coloring Algorithm In graph coloring algorithm each exam is represented by a node. Each node is used to construct a graph. Edges between nodes show the conflict between two exams and each edge has a cost depending on common student ratio. Each time period of a day represents a color so that two adjacent nodes cannot have same color. Also each color represents a time period of a day. Graph Coloring Algorithm execution is shown in Figure 6. In order to show the execution explicitly an example for a given data set will be examined as follows: Configuration settings are given as; 3 days, 2 time period for a day and 2 exams per time period. The maximum allowable ratio is selected as %33. According to given data set, all exams are turned into nodes and these nodes are sorted depending on number of students that are registered to the exam. The Fig. 7 shows the initial state of the graph. • In Fig. 7, numbers written in near the nodes shows the neighbor count of the node, • Numbers written in parenthesis shows the student count of an exam, • Numbers written on edges shows the ratio percentage between two exams. Colors are set at the start of the algorithm depending on the number of time period in a day. Each node has a color domain including these colors. After the algorithm executes for the first day the most crowded exam is selected which is CSE190. The first available color of CSE190 is yellow and it is colored to yellow. After coloring a node, this color is deleted from neighbors‟ color domain. Secondly CSE101 is selected from the rest as it is the most crowded one. CSE101 is neighbor of CSE190 so they cannot be colored to same color (Fig. 8). After these two exams are colored with the first color in their domains, next the left most crowded exams such CSE007 – CSE006 – CSE012 – CSE540 are taken but cannot
26.05.2010 TABLE VI: EXAM ARRAY AFTER ITERATIONS 1 & 2
101
007
190
310
009
540
006
012
As shown in Table VII and Table VIII, CSE190 is not scheduled in the timetable as it has a ratio that exceeds the specified limit which is 60% with CSE007. TABLE VII: TIMETABLE AFTER ITERATIONS 3 & 4 09:00 11:00 24.05.2010
101
007
310
009
25.05.2010 26.05.2010 TABLE VIII: EXAM ARRAY AFTER ITERATIONS 3 & 4
101
007
190
310
009
540
006
012
Iteration 5 & 6 same as iteration 1 & 2, so CSE190 and CSE540 are scheduled into timetable as illustrated in Table IX and Table X. TABLE IX: TIMETABLE AFTER ITERATIONS 5 & 6 09:00 11:00 24.05.2010
101
007
25.05.2010
190
540
310
009
26.05.2010 TABLE X: EXAM ARRAY AFTER ITERATIONS 5 & 6
101
007
190
310
009
540
006
012
As illustrated in Table XI and Table XII, CSE006 is scheduled into timetable in iteration 7. Hybrid Approach algorithm result for this example is shown in Table XIII. 69
International Journal of Innovation, Management and Technology, Vol. 4, No. 1, February 2013
are fulfilled with available colors. The execution of the program works for each selected date. Results of each step are shown in Fig. 9 and Fig. 10.
be colored with any color because there is no color left in their color domain. After these iterations, CSE009 and CSE310 are taken and colored to first color of their domain. When a day is completed, all non-scheduled nodes‟ domains
Fig. 6. Graph Coloring Flow Chart
Fig. 7. Initial State of the Graph
Fig. 9. Graph State after Step 2
Fig. 8. Graph State after Step 1
Fig. 10. Graph State after Step 3
70
International Journal of Innovation, Management and Technology, Vol. 4, No. 1, February 2013
In addition, Table XV illustrates the execution of Graph Coloring Algorithm and the states in every iteration.
D=1 190 = Y 101 = R RATIO RATIO 009 = Y 310 = R D=2 007 = Y 006 = R 012 = R RATIO D=3 540 = Y END
TABLE XV: GRAPH COLORING ITERATIONS 190 101 007 006 012 540 Y-R Y-R Y-R Y-R Y-R Y-R Y R R R R Y-R Y R R Y Y R R Y Y R R Y Y R R Y Y R R Y Y-R Y-R Y-R Y-R Y Y-R Y-R Y-R Y R Y-R Y-R Y R R Y-R Y R R Y-R Y-R Y -
009 Y-R Y-R Y-R Y-R Y-R Y Y -
V. RESULTS AND FINDINGS Hybrid approach and graph coloring algorithms are implemented for exam scheduling system. They also applied to different sized data sets. Different tests are applied by using this algorithm depending on the speed of the algorithm or satisfying the constraints. In order to compare the algorithms‟ efficiency the same data set is given to lecturer with soft and hard constraints. The timetable that is scheduled by him is given in Table XIX. In this timetable all hard constraints are satisfied however soft constraints are not fully satisfied.
310 Y-R Y-R Y-R Y-R Y-R Y-R R -
TABLE XIX: MANUALLY SCHEDULED TIMETABLE 09:00 11:00 24.05.2010
CSE101
CSE310
CSE009
CSE007
25.05.2010
CSE190
CSE540
CSE006
CSE012
26.05.2010
Graph coloring algorithm result for this example is shown in Table XVI.
Then the results of the algorithms are compared depending on the process speeds. Ten tests are applied and the results are given in Table XX.
TABLE XVI: GRAPH COLORING EXAMPLE RESULT 09:00 (Yellow) 11:00 (Red) 24.05.2010 190 009 101 310 25.05.2010 007 -012 006 26.05.2010 540 ----
TABLE XX: PROCESS SPEED OF THE ALGORITHMS Test Sequence Hybrid Approach Graph Coloring 1 253 ms 187 ms 2 78 ms 166 ms 3 130 ms 154 ms 4 139 ms 155 ms 5 74 ms 135 ms 6 87 ms 154 ms 7 90 ms 176 ms 8 94 ms 190 ms 9 79 ms 194 ms 10 185 ms 147 ms
C. Findings Halls for Each Scheduled Exams The exams and halls are listed depending on their sizes. Size of an exam means the number of students that will be attending to exam. Size of a hall represents the capacity of the hall. Algorithm first takes the smallest exam and continues through the list, then puts each exam in the smallest room it fits. If the size of the exam exceeds the capacity of the hall algorithm displaces the minimum number of students to the next bigger room. So that the combined size of the exams remaining is less than the size of the room, repeating with the next bigger room and so on. This execution will produce an assignment of exams to halls. According to result of Hybrid Approach which is illustrated in Table XIII, CSE101 and CSE007 are scheduled together into first time period, and CSE301 and CSE009 are scheduled together into second time period of the timetable. First CSE101 is taken and assigned to first hall that satisfies capacity constraint. Then CSE007 is placed to the next available hall. This assignment is illustrated in Table XVII.
The average time that it takes to schedule exam timetable by using the two algorithms and manually are given in Table XXI. As seen in the results two of the algorithms find optimal solutions in close time with each other. Although manual scheduling takes too much time, it cannot satisfy the constraints.
Average
TABLE XXI: AVERAGE PROCESS SPEEDS Hybrid Graph Manual Approach Coloring 110,9 ms 165,8 ms 25 min
According to information given in Table XXI, the efficiency of algorithms is calculated as follows; • Hybrid Approach satisfied all constraints and was 100% satisfactory. • Graph Coloring algorithm satisfied all constraints and was 100% satisfactory. • Manual scheduling could not satisfy all constraints and was 87.5% satisfactory.
TABLE XVII: ASSIGNMENT TO FIRST TIME PERIOD Halls Positioning of Exams Hall – 1 (5) CSE007 (3) Hall – 2 (5) CSE101 (3) CSE101 (3)
The execution continues for the next time period. CSE310 is placed in the first available hall then as sum of CSE009 and CSE310 do not exceed the capacity of the hall both can be placed into same hall. This is illustrated in Table XVIII.
VI. CONCLUSION In this study, exam timetabling problem is examined by using different artificial intelligence approaches. Blind search and brute force algorithms are used as a starting point as an hybrid approach. Also map coloring algorithm used as another approach to find different solutions to exam
TABLE XVIII: ASSIGNMENT TO SECOND TIME PERIOD Halls Positioning of Exams Hall – 1 (5) CSE310 (3) Hall – 2 (5) CSE310 (3) CSE009 (2)
71
International Journal of Innovation, Management and Technology, Vol. 4, No. 1, February 2013 [7]
timetabling problem. At the beginning of the work constraints of the problem are determined. These two algorithms are applied to same data sets and different results are interpreted. The results are examined depending on the process speed and efficiency. Each constraint has a coefficient and this is used to calculate the efficiency of each algorithm. As a second part of the project RFID card reader is used. A RFID card reader will be connected to computers and these computers will be located in common areas in university. As the system is developed web based a student / lecturer can get information of scheduled exams by using their university identity cards.
[8]
Akhan Akbulut received his BS in Computer Engineering (Istanbul Kültür University, 2001), M.Sc in Computer Engineering (Istanbul Kültür University, 2008), Ph.D candidate in Computer Engineering (Istanbul University, from 2009). He has worked as senior/lead software developer and project manager in software sector and participated in many middle and/or enterprise size projects. He works in the Computer Engineering Department of Istanbul Kültür University. His current research areas are software engineering, web and mobile based application development, wireless sensor networks and cloud computing.
REFERENCES [1] [2] [3]
[4]
[5] [6]
M. W. Carter “A survey of practical applications of examination timetabling algorithms,” Operational Research, vol. 34, no. 2, pp. 193-202, 1986 D. J. A. Welsh and M. B. Powell “An Upper Bound for the Chromatic Number of a Graph and Its Application to Timetabling Problems,” Comp. Jrnl., 1967.
C. M. Roberts, “Radio frequency identification (RFID),” Computers & Security, no. 25, pp. 18 – 26, 2006. H. B. Pine, “RFID and the Importance of Integration and Software,” ABI Research, 2005 Y. S. Xiao, Y. K. Wu, Q. Ni, C. Janacek, and J. Nordstad,“Radio frequency identification: technologies, applications, and research issues,” Wireless Communications And Mobile Computing, pp. 457–472, 2007 M. W. Carter and G. Laporte, “Recent developments in practical examination timetabling,” Practice and Theory of Automated Timetabling, ser. Springer Lecture Notes in Computer Science, E. Burke and P. Ross, Eds., vol. 1153, pp. 3-21, 1996 A. Schaerf, “A survey of automated timetabling,” Artificial Intelligence Review, vol. 13, no. 2, pp. 87-127, 1999 D. Werra, “The combinatorics of timetabling,” European Journal of Operational Research, vol. 96, no. 3, pp. 504-513, 1997
Güray Yılmaz is an Assistant Professor in Turkish Air Force Academy. He received his BS, MSc and PhD degrees from the Istanbul Technical University Computer Engineering Department in 1991, 1995 and 2002 respectively. He teaches Operating Systems, Parallel and Distributed Systems and Special Topics in Distributed Systems. His current research areas are parallel programming, object-based distributed systems, mobile agent systems, wireless sensor Networks and mobile ad-hoc networks.
72