5th International Advanced Technologies Symposium (IATS’09), May 13-15, 2009, Karabuk, Turkey
RECOGNITION OF DENGUE DISEASE PATTERNS USING ARTIFICIAL NEURAL NETWORKS a, *
B. Gultekin Cetiner a, Murat Sari b and Hani M. Aburas c
Faculty of Engineering, Department of Manufacturing and Materials Engineering, IIUM, Kuala Lumpur 50728, Malaysia. E-mail:
[email protected] b Pamukkale University, Faculty of Art and Science, Department of Mathematics, 20020, Denizli, Turkey E-mail:
[email protected] c Faculty of Engineering, Department of Industrial Engineering, KAU, P.O. Box 80204, Jeddah 21589, SA E-mail:
[email protected]
Abstract This research aimed at the recognition of the patterns for dengue disease patterns using Artificial Neural Networks (ANN’s). Real data was provided by Singaporean National Environment Agency (NEA), for academic purposes only. Obtained data was used to model the behavior of dengue cases based on the physical parameters of mean temperature, mean relative humidity and total rainfall. The set of data recorded weekly consists of dengue reported confirmed cases together with three aforementioned parameters and for a six-year period, January 2001 to April 2007.
period of 8-10 days [8]. Aedes mosquito rests inaccessible areas behind the human dwellings; hence, the collection of these mosquitoes by hand catch is very difficult. However, the adult mosquitoes are being collected by either manbiting/landing or netting. These methods are considered as unethical issues for measuring the adult population. Therefore, attempts are being made to collect these mosquitoes through different types of traps developed by different companies. In this study, various types of traps have been tested to choose the most efficient one for the collection of Aedes population. As per our study, Black Hole traps was considered as the most efficient traps, which was used in different parts of the study areas.
Keywords: Disease Pattern Recognition, Artificial Neural Networks
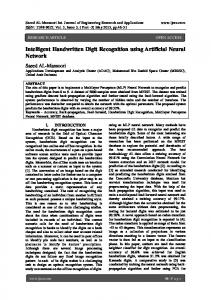
1. Introduction Dengue is an infectious disease transmitted from person to person by a mosquito, Aedes aegypti, which is a major vector for the virus in different parts of the globe; Ae. albopictus is also considered as a secondary vector, Fig 1. The first recorded epidemics of dengue like disease occurred in 1635 in French West Indies, Batavia (Jakarta), and Cairo [1, 2, 3]. Dengue out-breaks have also been reported from different parts of the world in the past two centuries. Over the past two decades, there has been a dramatic increase in the Dengue Hemorrhagic Fever (DHF) and Dengue Shock Syndrome (DSS) epidemics in South East Asian countries. World Health Organization (WHO) estimated that about 50-100 million cases of dengue are recorded from all over the world annually, and two fifth of the world population is at risk and more than one hundred countries have been affected by dengue or DHF/DSS epidemics. Since 1950, more than 500,000 hospitalized cases and approximately 70,000 deaths of the children have been recorded; infection rate among the children is as high as 64 per 1000 population [2]. Dengue is characterized by high fever, headache, pain in various parts of the body, prostration, rash lymphodenopathy, and leucopenia [1]-[4]. DHF is a severe febrile disease characterized by abnormalities of homeostasis and increased vascular permeability which may result into DSS [5]-[6]. Normally, cycles of dengue virus is transmitted from human-to-human by mosquito bites. Several species of mammals and lower primates act as reservoir of the dengue virus [7]. From feeding on an infected viraemic human, the female Aedes mosquito is able to transmit dengue virus after an extrinsic incubation
© IATS’09, Karabük University, Karabük, Turkey
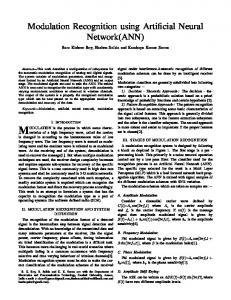
Figure 1: Dengue Transmitting Vector World Wide (Source:www.broad.mit.edu/news/links/dengue08172005.html, 2005) The main purpose of this study is to investigate the feasibility of applying the Artificial Neural Networks (ANN’s) technique to recognize dengue disease patterns based on the measured real parameters: mean temperature, mean relative humidity, total rainfall and reported dengue cases as corresponding output to those three mentioned parameters. ANN’s have been used herein due to their ability to learn from given examples which makes them perfect tools since there is no need to model each individual case mathematically. In this paper, we use Artificial Neural Networks to recognize the number of dengue-confirmed cases. The real data obtained from the Singaporean National Environment Agency (NEA) has been adopted to model the behavior of dengue confirmed cases based on the parameters of mean temperature, mean relative humidity and total rainfall. The set of data recorded weekly consists
Cetiner, B. G.,, Sari, M. and Aburas, H. M.
of dengue reported or confirmed cases along with the three aforementioned parameters. It covers six-year period, January 2001 to April 2007. The software component described in this paper has been utilized to embed ANN functionality into our prediction of dengue [9]. Architecture of the component is designed in an object-oriented fashion for the purpose of building such applications easily.
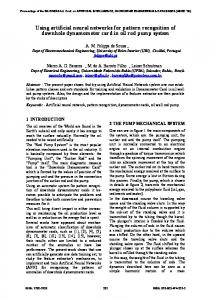
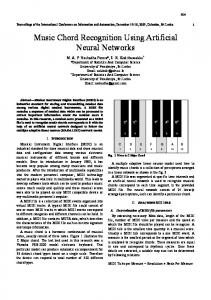
2. Data for Dengue Disease Patterns Three hundred and thirty data sets were collected in this study by the NEA. The data included weekly values of mean temperature, mean relative humidity, total rainfall and the total number of dengue confirmed cases. The considered data sets covers a six-year period, from the th first week of January 2001 to the 17 week of 2007. Fig. 2 demonstrates the number of confirmed dengue cases; it clearly shows a dengue outbreak in the 2005 and the number of weekly confirmed cases had declined afterwards and the outbreak of this infectious disease was under control.
Figure 2: Data set used for Dengue Prediction
The usage of data for training and testing of the networks has been explained in the following section.
3. Artificial Neural Networks Model for the Recognition of Dengue Confirmed Cases ANN’s have been used successfully for solving many engineering problems in many areas ranging from computer vision to business forecasting via the available data. Their ability to learn from given examples makes them perfect tools since there is no need to model each individual case mathematically. Neural networks are composed of a large number of interconnected units divided into input, output, and hidden nodes. A single processing unit merely sums up the weighted activation on its inputs, transforms this sum according to an activation function, and passes the resulting function to its output. Therefore, in general terms, information processing in neural networks consists of the units transforming their input into some output, which is then modulated by the weights of connections as inputs to other units.
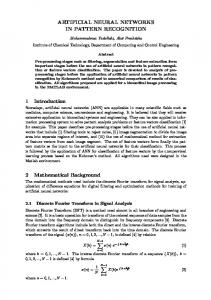
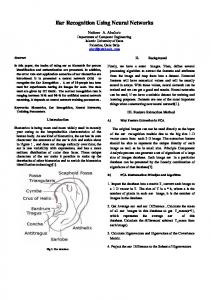
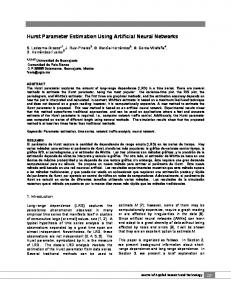
Learning in these systems is defined in terms of the total adjustments of the weights continuously so that the network’s output tends toward the desired output without involving changes to the structure of the network. Neural networks are trained by specifying some constraints such as learning parameters, network structure, and training examples. When learning is complete or stopped at an adequate level, knowledge is said to be represented by the optimized connection weights among processing units in the entire network. The advantage of ANN’s is their model-free behavior where a model in need of a knowledge base and necessary rules is not to be defined explicitly, since neural networks do not need rules. Instead, they generate rules by learning from given examples. This makes ANN’s general purpose classification tools to be used in pattern recognition and classification systems. Neural networks provide a closer approach to human perception and recognition than traditional computing. When inputs are noisy or incomplete, neural networks can still produce reasonable results. Possibility and ease of use in many areas make ANN’s an ideal solution for engineering problems; their ability to learn from given examples makes them perfect tools since there is no need to model each individual case mathematically. The ANN model with Back Propagation algorithm was used in this study [10]. The data set consisting of 330 weekly measurement or sets of mean temperature, mean relative humidity, total rainfall and number of dengue confirmed cases; it was split into two different data subsets called train data set and test data set, respectively. The main difference between train and test sets is that the train data set is used in training the neural networks and the test data set is the unseen data which is not presented to the network during training. The training data set was consisting of the two years’ data (104 weeks) and the remaining 226 data sets were used to validate the feasibility of the model and to test the performance of the ANNs. The ratio of the selection in number of data was 104/226 (0.46) which means pretty good validation if trained and tested successfully since the training data set contains less data than the testing set. All the ANN models employed had three layers namely input layer, hidden layer and output layer. The network model was consisting of 3 parameters only in its input layer namely mean temperature, mean relative humidity and total rainfall. The output was selected as the number of dengue confirmed cases. Fig. 3 shows the design of the Neural Network. The network performed generally well except for the prediction of the outbreak in 2005 as shown in Fig. 4. ANNs were trained and tested to see the correlation of networks with different structures. A high correlation of 0.85 was achieved as expected when using the same data set (330 patterns) for both training and testing. One hidden layer was decided to be optimum with four processing elements based on trial and error as illustrated in Table 1. Although twelve neurons in hidden layer produced better correlation, the four-hidden-neurons network was selected to avoid an overfitting of the network, a common problem in ANNs. As shown in Table
5th International Advanced Technologies Symposium (IATS’09), May 13-15, 2009, Karabuk, Turkey
1, correlation coefficients did not change for different number of neurons in the hidden layer. Since the results on testing sets are more important to measure the generalization capability of ANNs, the testing set was analyzed to find the optimum structure of the network model.
From the two alternatives, four-hidden neurons was adopted instead of the twelve one in order to avoid an overfitting and protect the generalization capability of the network. This network model yielded correlation coefficients of 0.84 and 0.76, for training and testing sets respectively .
Figure 3: The adopted ANN Structure
Figure 4: Recognition of Dengue Confirmed Cases
Table 1: Correlation Coefficients for Different Number of Neurons in Hidden Layer # Hidden Neurons 2 3 4 5 6 12 15 30
Training Set Correlation 0.85 0.84 0.84 0.83 0.84 0.85 0.86 0.88
Testing Set Correlation 0.77 0.74 0.76 0.75 0.75 0.77 0.76 0.77
© IATS’09, Karabük University, Karabük, Turkey
4. Analysis The Neural Networks trained converged to results in 1000 epochs and only in a few seconds. Figure 4 illustrates the actual and predicted results for the testing set.
The network was also used to predict the 2005 outbreak. The correlation coefficient was 0.70 for the 2005 period. There was a drop in correlation to 0.70 from 0.76. The problem in prediction exists between weeks 34 and 38 as illustrated in Table 2 in detail.
Cetiner, B. G.,, Sari, M. and Aburas, H. M.
Table 2: Problem in predicting weeks 34 to 38 in 2005 outbreak Week Actual Predicted Difference # Cases Cases 34 488 350 135 35 546 415 131 36 691 392 399 37 695 422 273 38 713 421 292
The drop in performance of the network during 2005 outbreak is clearly due to very low accuracy shown in Table 2. The network predicts all the data very well in the test data set based on the limited training data (of two years) except those five weeks. It shows that during this period there are some events which cannot be explained by three input parameters. Explanations are left to medical scientists since it is too late to introduce and collect additional input parameters for the past. However, for future studies additional measurements should be taken to have good predictions for similar cases to 2005 outbreaks. These additional parameters may include conventional indices used to monitor the vector populations for dengue virus transmission, such as House Index ( HI), Container Index ( CI), Breteau Index ( BI) and Aburas Index [11] to measure the adult mosquito populations. The model developed in this paper uses no direct timely information; therefore, the method may be used for any time period although it is suggested to be used in consequent basis. The performance of the network may be better when used with more data in train set. For example, all 6 years’ data may be used as training set and prediction may be made for future. The model may be applied to other medical data patterns similarly.
5. Conclusion The purpose of this paper was to examine the capability of Artificial Neural Networks to recognize the dengue confirmed cases on a six-year recorded data. Results showed that the three important features namely mean temperature, mean relative humidity, total rainfall and the total number of dengue confirmed cases sufficeint in predicting the number of dengue confirmed cases. The study gave very encouraging results except very few data sets, corresponding to five consecutive weeks in 2005 Dengue outbreak in Singapore. Finally, in future, researchers are advised to explore additional parameters to predict dengue confirmed cases such as the several traditional and newly developed indices for mosquito population prediction [10].
6. Acknowledgements The authors would like to express their thanks to Singaporean National Environment Agency (NEA) for providing the data sets for academic research purposes only.
References [1] Halstead DGH., A revision of the genus Oryzaephilus Ganglbauer, Including Descriptions of Related Genera. (Coleoptera: Silvanidae). Zoological Journal of the Linnean Society 69: 271-374, 1980. [2] World Health Organization. Key Issues in Dengue Vector Control Towards the Operationlization of Global Strategy Report of Consultation. Geneva:WHOCTD/FIL 96.1,1995. [3] Gubler D.J, Suharyono W.S. Wulur H, Jahja, E and Sulianti S.J. Virological Surveillance for Dengue Hemorrhagic Fever in Indonesia using the Mosquito Inoculation Technique. WHO Bull.57. 931-935, 1979. [4] Nguyen T., Malley R., Inkelis S.H., Kuppermann N., Comparison of prediction models for adverse outcome in pediatric meningococcal disease using artificial neural network and logistic regression analyses, Journal of Clinical Epidemiology, 55(7), 687-695, 2002. [5] Nimmannitya S. , Halstead S.B, Gohen S.N, Margotta M.R. Dengue and Chikungunya Virus Infection in Thailand 1962-64: Observations on Hospitalized Patients with Hemorrhagic Fever. Am. J. Trop. Med. Hyg 18:954-71, 1969. [6] World Health Organization. Dengue Hemorrhagic Fever: Diagnosis, Treatment Prevention and Control.2nd ed. Geneva, 1997. [7] Pham, D.T. and Liu, X., Neural Networks for Identification, Prediction and Control. Springer-Verlag, 1997. [8] Simmons, J.S., J.H. St. John and F.H.K. Reynolds. Observations on the Possibility of Hereditary Transmission of Dengue from Infected Female Aedes aegypti through the Egg to the Offspring. Philippine J. Sci. 44: 57-58, 1931. [9] Çetiner, B. G. and Aburas, H. M, Development of a Cross-Platform Artificial Neural Network Component for Intelligent Systems, JKAU: Engineering Science, vol. 16 no. 2, 117-137, 2006. [10] Lippman R. P., An introduction to computing with neural nets, IEEE ASSP Msg. 4, 4-14, 1987. [11] Aburas, H.M., Aburas Index: A Statistically Developed Index For Dengue- Transmitting Vector Population Prediction, Proceedings of World Academy of Science, Engineering and Technology, Volume 23, August 2007 151-154, 2007.