work is required to identify all the interior points. The process of identifying regions of interest can be di- vided into two steps. The first step is to identify points. 1 ...
Using Bitmap Index for Interactive Exploration of Large Datasets ∗ Kesheng Wu†, Wendy Koegler‡, Jacqueline Chen‡, and Arie Shoshani†
Abstract
velocity throughout a volume of air. Regions of interest are then identified as meeting some conditions based on these properties, e.g. regions in the volume where the air is very hot. Datasets can have hundreds of attributes such as pressure, concentrations, etc. Regions of interest may be defined based on any of the attributes in the dataset as well as combinations of different attributes. A scientist usually has to explore a number of different conditions before proceeding to subsequent analysis steps. The full tracking process, called feature tracking, is illustrated by Silver and Wang [14]. The spatio-temporal dataset is organized on the top level according to time. For each time step, snap shots of the fields are recorded. These fields are usually discretized and recorded as attribute values on grid points or cells. In [14], a region of interest was defined to be a connected region where an attribute is above a specified threshold value. A region of this type is also known as the thresholded region. The thresholded regions were identified in each time step and then tracked through time by comparing overlaps of regions from consecutive time steps. An Octree was used to facilitate the visualization and identification of regions of interest. Since the Octree is based on a partition of space, searching for points that satisfy conditions on attribute values typically requires one to examine a large portion of the tree. For this reason, identifying regions of interest using an Octree is considered an O(N ) process, where N is the total number of points. A number of alternative approaches scale better, as we shall discuss next. For visualization purposes, identifying a thresholded region is equivalent to identifying its boundary. Therefore, we may choose to use an isocontouring algorithm to determine the boundary instead of identifying the entire region. There are efficient algorithms for generating isocontours for visualization. For example, the NOISE algorithm √ is shown to have the worst case complexity of O( N + s), where s is the size of the isocontour [8]. More recent researches have demonstrated that the optimal complexity of O(s) is achievable with suitable preprocessing [4, 11]. Although potentially faster than the thresholded region algorithm [14], isocontouring algorithms only identify points on the boundary. Additional work is required to identify all the interior points. The process of identifying regions of interest can be divided into two steps. The first step is to identify points
Many scientific applications generate large spatiotemporal datasets. A common way of exploring these datasets is to identify and track regions of interest. Usually these regions are defined as contiguous sets of points whose attributes satisfy some user defined conditions, e.g. high temperature regions in a combustion simulation. At each time step, the regions of interest may be identified by first searching for all points that satisfy the conditions and then grouping the points into connected regions. To speed up this process, the searching step may use a treebased indexing scheme, such as a KD-tree or an Octree. However, these indices are efficient only if the searches are limited to one or a small number of selected attributes. Scientific datasets often contain hundreds of attributes and scientists frequently study these attributes in complex combinations, e.g. finding regions of high temperature and low pressure. Bitmap indexing is an efficient method for searching on multiple criteria simultaneously. We apply a bitmap compression scheme to reduce the size of the indices. In addition, we show that the compressed bitmaps can be used efficiently to perform the region growing and the region tracking operations. Analyses show that our approach scales well and our tests on two datasets from simulation of the autoignition process show impressive performance.
1
Introduction
One method available for scientific data exploration is to identify and track regions of interest [1, 7, 14]. The goals are to identify regions for further analysis and to visualize their evolution. In a spatial-temporal dataset, such as the results from a combustion simulation [5, 6], the physical phenomena to be studied can be described as a number of scalar or vector fields on a domain, e.g. temperature and ∗ This work was supported by the Director, Office of Energy Research, Office of Laboratory Policy and Infrastructure Management, of the U.S. Department of Energy under Contract No. DE-AC0376SF00098. † Lawrence Berkeley National Laboratory, Berkeley, CA. Email: {kwu, ashoshani}@lbl.gov. ‡ Sandia National Laboratories, Livermore, CA. Email: {wkoegle, jhchen}@ca.sandia.gov.
1
that satisfy the specified conditions and the second step is to group these points into connected regions. In later discussions, we refer to the first step as the searching step and the second as the region growing step. After the regions have been identified in each time step, the last step of feature tracking is to determine the relationship among the regions between time steps. We refer to this step as region tracking.
all three steps of the feature tracking process. Tests on two sets of data from an autoignition simulation verified this conclusion. On a 33 GB dataset, it takes on the average 10 seconds to identify and track regions of interests defined on four different attributes. Even in the worst cases, it takes less than a minute. The remaining of this paper is organized as follows. In Section 2, we review the basic concepts of bitmap indexOne important limitation of the searching schemes ing and give the optimal scheme for the searching step. In employed by the thresholded region algorithm [14] and Section 3, we review the compression scheme used and the isocontouring algorithms [4, 8, 11], is that they are give the basic reasons that it can perform bitwise logical only designed for regions of interest defined on one at- operations efficiently. The most important point of this tribute. To remove this limitation, a number of multidi- section is that we can represent regions of interest commensional indexing schemes can be applied to speed up pactly using O(s) words. Since the optimal bitmap index the search step. For example, Shi and Jaja (2002) ap- allows us to read only one compressed bitmap to answer a plied a packed Hilbert R-Tree to an earth science dataset threshold condition, this searching step has a complexity [12]. In database terms, each grid point is a record, and of O(s) in both space and time. In Section 4, we disthe spatial coordinates and the associated fields are at- cuss how the region growing process can be implemented tributes of the record. The algorithm used by Shi and Jaja in the same complexity. We also show experimental evcan process multi-attribute conditions. Its time complex- idence to support the theory. The region tracking proceity is O(v), where v is the volume of the regions of in- dure used in our tests is discussed in Section 5. The overterest. However, the packed Hilbert R-Tree and most of all performance characteristics of the bitmap based feathe multidimensional indexing schemes either suffer from ture tracking algorithm is discussed in Section 6. In secthe “curse of dimensionality” or are only efficient when tion 7, we summarize the current work on uniform grids queries involve all attributes. The “curse of dimensional- and discuss how we may extend the algorithms to irreguity” refers to the fact that their effectiveness rapidly dete- lar grids and adaptive grids. riorate as the number of attributes increases. Most of them are only useful when the number of attributes is small, say 2 Bitmap indexing ≤ 10. Most multidimensional indexing schemes reorder the records according to their attribute values. Although this reordering is crucial to achieve efficient search operations, it causes the region growing procedures to be very slow. The reordering of records according to values destroys spatial relation among the neighbors. This relation essentially has to be recovered during region growing. For example, in one study by Shi and Jaja [12], the search step is quite fast (∼ 0.1 seconds), but the region growing step is much slower (2–4 seconds). Among the multidimensional indexing schemes, the bitmap indexing scheme is known to not suffer from the “curse of dimensionality” and is especially efficient when the queries do not involve all of the attributes [9, 19]. More importantly, the bitmap index does not require one to reorder the records in a particular way, thus we can keep the records ordered to preserve neighborhood relation for the region growing step. In this paper, we apply a compressed bitmap index to the feature tracking problem. Applying the bitmap index to the searching step is relatively straightforward. The crucial point of this paper is that the compressed bitmaps can also be used efficiently for region growing and region tracking. Our complexity analyses show that we achieve the optimal complexity in
The bitmap index scheme has a long history in the database field [9, 10, 2]. It is very efficient for data warehousing applications where the data records are read-only and the queries usually produce a large number of data items [2, 3, 19]. The feature tracking problem is similar to the data warehousing applications. In both cases, the data are read-only and the results of queries are usually large. Another reason for considering a bitmap index is that it does not require one to reorder the records. We can simply leave the records in the order used in the computational procedure that generated the data. Compared to those that require reordering, it requires less time to create a bitmap index. In addition, the existing order of records is well-suited for the region growing and region tracking steps. A bitmap index can be considered as a set of precomputed answers to some simple conditions. Let X be an integer attribute with values in the range of 0 to 9. The range-encoded bitmap index precomputes all answers to the query of the form “X ≥ p”, where p is an integer [2, 3]. Let N denote the number of records, each bitmap contains N bits of 0s and 1s. For the bitmap representing “X ≥ 1”, the ith bit is 1 if the attribute X in the ith record is greater than or equal to 1, otherwise the bit is 0. 2
In the bitmap index for X, there are 10 bitmaps each corresponding to one distinct value of X, 0 to 9. For any user specified condition of the form “X ≥ p”, to find all the points satisfying the condition, we only need to read one of the bitmaps. Clearly, the size of this bitmap determines the time and space complexity of this searching step. In the next section, we discuss the use of compression to reduce bitmap sizes. In the remainder of this section, we discuss how to deal with continuous values and conditions involving multiple attributes. A bitmap index is usually defined for one attribute, however it is easy to process conditions involving more than one attribute. For example, with two range-encoded bitmap indices for both X and Y , to answer the query “X ≥ px and Y ≥ py ” one simply uses the indices for X and Y to first get the partial solutions to “X ≥ p x ” and “Y ≥ py ”, and then performs a bitwise AND operation on the two partial solutions.
ditions involved in identifying thresholded regions can be answered by retrieving one bitmap from a bitmap index. This process is expected to take O(N ) space and O(N ) time. However, it can be significantly reduced if the bitmaps are compressed. Most of the commonly used bitmap compression schemes are based on run-length encoding. If the physical problem has continuity in space, then preserving the neighborhood relation among the records tend to also improves the compressibility of the bitmaps. For a simple threshold condition on one attribute, we can show that the size of the compressed bitmap is O(s), where s is the size of the boundaries of the thresholded regions.
3 Bitmap compression
As mentioned in the previous section, compression is the crucial technique that reduces the complexity of the The bitmap indexing scheme can also be used for at- search operations when using the bitmap index. In this tributes with continuous values. In scientific applications, section, we demonstrate that on a uniform grid, the comthese attributes are typically represented as floating-point pressed bitmap size is proportional to the size of the values. The most straightforward option is to build one boundaries of the regions of interest, i.e., O(s). To find bitmap for each distinct value. This option ensures that thresholded regions using a range-encoded bitmap index all possible threshold conditions can be answered by read- we simply retrieve an appropriate bitmap from the bitmap ing one bitmap, however, it may generate a compressed index. If the size of this bitmap is O(s) bytes, the combitmap index that is larger than a B-tree index. To reduce plexity of the search operation is theoretically comparable the size of the bitmap index, we usually bin the floating- to the best algorithm for identifying the boundaries (isopoint values [13, 18]. For example, assuming an attribute contour) of these regions. The following analyses are for Z can be of any real value between zero and one, we 3D uniform grids and the illustrations use a 2D grid. may build a range-encoded bitmap index for the followOn a uniform 3-D grid, each grid point can be marked ing set of conditions, Z ≥ 0, Z ≥ 0.1, Z ≥ 0.2, . . ., with its indices along x, y, and z directions, i, j, and k. Z ≥ 0.9. This corresponds to having 10 bins with bin A simple way of ordering these grid points is the raster boundaries 0, 0.1, and so on. In this case, the performance scan ordering. Let the grid size be nx × ny × nz , and of searching step depends critically on the selection of the the indices i, j, and k go from 0 to n x -1, ny -1 and nz -1 bin boundaries. For example, if the threshold is 0.85, i.e., respectively. The global index of a grid point at (i, j, k) is the query condition is Z ≥ 0.85, all records satisfying i+j∗nx +k∗nx ∗ny using the raster scan order. A number Z ≥ 0.9 definitely satisfy the query condition, but all the of connected regions can be recorded by marking whether records satisfying Z ≥ 0.8 but not Z ≥ 0.9 have to be a point belongs to one of the regions. Using the bitmap examined. If commonly used conditions involving an at- index, the solution from the searching step is a bitmap of tribute are known, it is possible to devise an set of optimal N bits where the points inside the regions of interest are boundaries to minimize the number of records to be ex- marked with 1. amined. In the cases where a scientist is expected to use Let’s define the order line to be a line going through all the system, there are certain heuristics for maximizing the the grid points in order 0, 1, . . ., N − 1. The boundary chance that a user query falls on a bin boundary. For ex- of the regions will cut the order line into many line segample, a scientist is more likely to enter a condition like ments. A segment that contains grid points within the re“Z ≥ 0.1” than “Z ≥ 0.1001”, unless of course 0.1001 gions corresponds to a group of 1s in the bitmap. A group happens to have special meaning in the particular appli- of consecutive identical bits is called a fill. A fill with only cation. In the autoignition datasets, most of the attributes 0s is called a 0-fill and a fill with only 1s is called a 1have real values and the bin boundaries are typically of fill. The 0-fills correspond to line segments outside of the the form 10−8 , 2 × 10⁻⁸ , . . . , 10−7, 2 × 10⁻⁷ , and so on. regions of interest and the 1-fills correspond to line segIn general, users can select their own preferred bin ments inside the regions. If the points of the regions fall boundaries when creating the bitmap indices. By select- on sl line segments, the bitmap representing the regions ing bin boundaries that fit a specific application, con- contains no more than sl 1-fills separated by no more sl -1 3
outline of the region
Figure 1
line segments 8
Figure 2
7 6
order line
5 4
Y
26*0, 3*1, 6*0, 2*1, 2*0, 1*1, 6*0, 3*1, 1*0, 1*1, 6*0, 5*1, 7*0, 4*1, 8*0, 3*1, 15*0 16*0, 2*1, 2*0, 2*1, 4*0, 3*1, 11*0, 1*1, 4*0, 1*1, 4*0, 1*1, 6*0, 4*1, 3*0, 3*1, 4*0, 2*1, 6*0, 1*1, 4*0, 1*1, 4*0, 1*1, 9*0
Figure 3: Run-length encoding of the bitmaps representing the regions shown in Figures 1 and 2.
3 2 1
Figure 1
j= 0
Figure 2
X i= 0
1
2
3
4
5
6
7
8
9
10
Figure 1: A 2-D regular grid (11 × 9).
0000001C 00F00E00 0000661C 1C302108
0640E81F 00000000 0021081E 00000000
Figure 4: The Word-Aligned Hybrid (WAH) encoding of the bitmaps representing the regions in Figures 1 and 2. Code words are expressed as hexadecimal digits. In both cases, the last word contains only six useful bits.
outline of the region line segments 8 7
P2
P3
compressed bitmaps, we use a compression scheme called the Word-Aligned Hybrid (WAH) code [15, 16, 17]. The 5 order WAH scheme differs from the basic run-length encoding line in two ways. First, it only records long groups of 0s or 4 Y 1s using run-length encoding, the short groups are repre3 sented literally. Second, it requires the groups to be of cer2 tain size so that operations on the compressed data are effi1 cient. If a word contains 32 bits, WAH first groups the bits P0 P1 of a bitmap into 31-bit groups. Consecutive groups with j= 0 only 0s or 1s are encoded in one word called the fill word. X The remaining groups are represented literally, where the i= 0 1 2 3 4 5 6 7 8 9 10 31 bits plus a flag bit are stored in a 32-bit word. In the worst case, the 2sl +1 fills might take 4s l +3 words in WAH Figure 2: A 2-D regular grid (11 × 9) partitioned into four because each fill may turn into one literal word plus a fill blocks. word and the last few (N modulo 31) bits require a word to store. Typically, it takes less space than run-length en0-fills. There might be two additional 0-fills, one at the coding scheme, especially if many of the groups are small. beginning and one at the end of the bitmap. Altogether For the example shown in Figure 1, WAH encodes all bits there is a maximum of 2sl +1 fills. Using run-length en- in literal words and only four words are needed instead of coding, each fill can be represented in one word. A total 17. The WAH compressed version is shown in Figure 4. of at most 2sl +1 words may be used. Many of the com- In this case, there are only six useful bits in the last word. monly used bitmap compression schemes are based on We say a grid point in a region is exposed if one of its run-length encoding, therefore using one of these schemes neighbors on the grid is outside of the region. We dethe compressed bitmap should use O(sl ) words. Figure 1 fine the boundary size s of a region to be the number of shows an example of a 2-D grid. Only one connected re- points exposed. For most line segments, only their two gion is shown, but it is not a convex region. In this exam- end points are exposed. This suggests that the boundary ple, there are eight line segments, sl = 8, and 17 fills in size is about twice the number of line segments, s ∼ 2sl . the bitmap representing the region. Run-length encoding The example shown in Figure 1 has 16 points exposed to of this bitmap is shown in Figure 3. the outside while it has eight line segments. A line segTo improve the efficiency of logical operations on the ment can have more than two points exposed if the whole 6
4
A B A&B A|B
or part of the line segment is exposed. For example, the line segment with j = 2 in Figure 1 has three exposed grid points. It may contribute less than two points if it has only one point. For regions with complex outlines, we would expect s to be slightly greater than 2s l . A connected region with many single-point line segments along the x-axis should be rare. In short, an algorithm with complexity of O(s l ) also has a complexity of O(s).
0000661C 7FFFFFFE 0000661C 7FFFFFFE
0021081E 80000002 80000002 0021081E
1C302108
1C302108
Figure 5: Examples of bitwise logical operations on WAH compressed bitmaps.
The datasets we used were computed on a parallel machine and their grids were distributed to many processors, one piece of the grid, or a block, to each processor. In this case, the points and the blocks form a two-level grid. Within each level, the points are numbered in the raster scan order, see an illustration in Figure 2. This makes the order line more complex and increases the number of line segments inside a region, and therefore increase the size of the compressed bitmaps. The region and the grid shown in Figure 2 are exactly the same as shown in Figure 1, except that the domain has been partitioned into four nearly equal-size blocks. By partitioning the grid into four blocks, the number of line segments increases from 8 to 12. In the bitmap, the number of fills increases from 17 to 25. We may reduce the size of the bitmaps by reordering the grid points to follow the simple raster scan order, however we are not sure whether the extra preprocessing time is worthwhile at this time.
In this case, one word from B and two words from A are consumed to generate one word of the result. If there are nA words in A and n B words in B, in the worst case, a bitwise logical operation may generate nA +nB words in the result. Because of this linear relation, bitwise logical operations on WAH compressed bitmaps have the potential to outperform the same operations on the uncompressed bitmaps. Our earlier tests demonstrated that this is indeed the case [15, 16, 17]. Overall, using the WAH compression scheme not only reduces the storage requirement, but also improves the computational efficiency. An additional benefit of using WAH compression is that we can generate the bitmap indices efficiently. Using WAH compression, it is possible to only insert bits that are 1 when creating a bitmap index. In most cases, we found that generating the (equality encoded) bitmap index 1 has the computational complexity of O(N log(b)), where b is the number of bitmaps generated. This is significantly Logical operations on WAH compressed bitmaps can better than the complexity of generating an uncompressed work directly on the compressed data and generate combitmap index, O(N b). It is also better than multidipressed answers. Because of this, the time to perform mensional indexing schemes that require sorting. These these operations is proportional to the sizes (bytes) of the schemes have a complexity of at least O(N log(N )). bitmaps involved [15, 16, 17]. Proving this in detail is beyond the scope of this paper; the following example illustrates the main points of the proof. Let A be the bitmap 4 Region growing representing the region shown in Figure 2 and B be the bitmap representing a region the occupying the first block The searching step generates a bitmap representing all only. The two compressed bitmaps are shown in Figure 5. grid points satisfying the specified conditions. In previThe last words for both bitmaps contain six 0 bits and are ous sections, we have shown that this bitmap can be pronot shown to save space. In B, the 62 0-bit in the mid- duced and stored efficiently. For visualization purposes, dle is represented by a WAH code word 80000002. The we need to produce the boundaries of all connected refirst bit is 1, indicating it is a fill word. The second bit is gions. On uniform grids, the beginning and the end of ev0, indicating all the bits of the fill are 0. The remaining ery group of 1s must correspond to the two end points of a 30 bits contains the integer 2, indicating the fill consists line segment in the regions of interest. If the user does not of 2 31-bit groups. In other word, the fill is 62 bits long. demand a high quality border or the grid is fine enough, The procedures to perform bitwise logical operation can simply displaying these end positions might be sufficient. directly read these code words and generate code words of However, to display a smooth boundary, we need to dethe results. In general, to generate one word of a result, at termine the points that are exposed and their neighbors least one word of the two operands is consumed. For in- outside so that we can perform the necessary interpolastance, the first code word of A&B is generated by using tion. This would require us to associate each grid point to the bitwise AND operator on the first code words from A a connected region. A straightforward approach is likely and B. One word from A and one word from B are con1 The range-encoded bitmap index can be generated from the equality sumed in this case. The second code word in A&B is the encoded index by b − 1 bitwise OR operations. Our observation is that same as that of B because it is a fill of 0 bits. There is no the logical operation time is much smaller than the time to generate the need to examine the two corresponding code words of A. equality encoded index. 5
to yield an algorithm with complexity of O(v) because it has to work on each grid point [12]. However, on uniform grids, we can directly work with the line segments instead of working with each individual grid point. This reduces the complexity of the region growing step to O(s). For data involving uniform grids, converting a compressed bitmap into lists of line segments is a straightforward task. This work involves visiting every word that represents 1s, converting the global index of the first 1 into its i, j, k coordinates, and determining the number of 1s that follow. Since the number of words containing 1s is proportional to the number of line segments, s l , this conversion process has a time complexity of O(sl ). As we decode the compressed bitmap, the line segments are discovered in order of j and k, and can be used in the following comparisons without any additional work. After the line segments are identified, the next task is to generate a list of pointers to these segments for each connected region. This process can go according to the indices j and k. For each grid line defined by (j, k), we need to compare the line segments on it against those on (j-1, k) and (j, k-1) and possibly (j-1, k-1) depending on the definition of neighbors. Because the line segments along each (j, k) are ordered and do not overlap, determining whether two segments from (j-1, k) and (j, k) are connected requires at most two comparisons. Let sj,k be the number of line segments on grid line (j, k), then the number of comparisons required to identify whether segments on line (j, k) are connected to segments on line (j-1, k) is proportional to s j,k + sj−1,k . This operation is repeated for two other lines. The overall complexity of matching segment on line (j,�k) is O(3sj,k +sj−1,k +sj,k−1 +sj−1,k−1 ). Since sl = sj,k , the overall complexity of grouping line segments into connected regions is O(sl ). While comparing line segments from different grid lines, we can also determine what part of a line segment is exposed to the outside. This is a fixed amount of work each time two line segments are compared. Therefore this does not change the complexity of the region growing algorithm. Displaying the positions of all the exposed points should produce a better boundary than simply displaying the end points of the line segments. However, if this is still insufficient, we may further generate a smooth boundary through interpolation. This requires one to identify the outside neighbors of the exposed points and perform interpolation. This additional work is also linear in the number of grid points exposed. Therefore, displaying a smooth boundary also requires O(s) time. In preparation for the feature-tracking step, we convert the lists of line segments back to compressed bitmaps. In this case, each bitmap represents the grid points belonging to one connected region. We have implemented a proce-
region growing time (sec)
0.015
0.01
0.005
0 0
2000
4000 6000 8000 10000 number of line segments
12000
a) 600 × 600 grid (partitioned into 32 blocks)
region growing time (sec)
0.03 0.025 0.02 0.015 0.01 0.005 0 0
0.5
1 1.5 number of line segments
2
2.5 4
x 10
b) 1344 × 1344 grid (partitioned into 256 blocks) Figure 6: Time used by the region growing procedure plotted against the number of line segments in each test case. Each test case is shown as a green point, the red lines are based on linear regression. dure that takes O(sl ) time. The size of a bitmap is proportional to the number of line segments it represents. Since the region growing step does not change the number of line segments, the total size of the compressed bitmaps produced is about the same as the size of the input bitmap, i.e., their total size is O(sl ). Overall, the region growing process takes one bitmap and generates a number of bitmaps, one for each connected region. Most of the steps in this process have a complexity of O(sl ) and others have a complexity of O(s). Since s ∼ 2sl , the total time complexity is O(s) and so is the memory size requirement. To verify that the time required by the region growing procedure is proportional to the number of line segments, we have collected timing results from a large number of different test cases (see details in Section 6). The results 6
data index create are plotted in Figure 6. We observe that the points fall grid size time size size index close to the regression lines. Given that time reported is steps (MB) (MB) (sec) wall-clock time and the figure contains more than 66,000 600 × 600 69 795 495 621 test cases on two sets of autoignition data, it is remarkable 1344 × 1344 335 19,364 3,351 6,912 that there are so few outliers. Also note that the datasets use distributed grids, see Figure 2. This verifies that the linear relation holds for nontrivial grids. Another imporFigure 7: Basic information about the compressed bitmap tant observation is that the slopes of the two regression indices on eight attributes of the autoignition data. −6 −6 lines are remarkably similar, 10 and 1.25 × 10 , even though the two grids are significantly different in size. This indicates that the coefficients in the linear relation do can compute the overlaps efficiently. not depend on the grid size and that the time complexity In previous sections, we have compared our approach of the region growing algorithm is indeed O(s l ). with the isocontouring algorithm. Most isocontouring algorithms cannot be used easily for region tracking because they do not provide information about the interior 5 Region tracking of the regions. However, our approach can handle feaWhen analyzing a spatio-temporal dataset, one important ture tracking with ease because a compressed bitmap is a task is to track the evolution of the regions of interest compact representation of all points in the regions. A byproduct of our region growing algorithm is that in time [14]. One common approach is to determine the it can produce bounding boxes easily. These bounding correspondence among the regions from the neighboring boxes can be used to reduce the overall region tracking time steps based on the spatial overlap of regions. The cost since we only need to compute the overlap of regions most time consuming part of this process is the compuwhose bounding boxes overlap. tation of overlaps. Let v 1 and v2 denote the volumes of two regions to be compared. The straightforward approach of comparing every pair of points has the complexity of O(v 1 v2 ). Given that we represent each region as a compressed bitmap, for uniform grids, computing overlap is equivalent to counting the number of 1s in the result of a bitwise AND operation between two bitmaps. Let s1 and s2 denote the boundary sizes of the two regions, the sizes of the compressed bitmaps are O(s1 ) and O(s2 ). Since we can directly operate on the compressed bitmaps, the complexity of the bitwise logical operation is O(s1 + s2 ). The result of this is also compressed and its size is also O(s1 + s2 ). Because WAH is a simple compression scheme, counting the number of 1s is a linear operation. Overall, computing overlap between two regions has a complexity of O(s1 + s2 ) both in space and in time. Given that the regions are represented in O(s 1 ) and O(s2 ) bytes, computing the overlap in O(s 1 + s2 ) time and space is optimal because one must examine every byte representing the two regions to determine their overlap. In our test software, we use the overlaps to define a global identifier (an integer) for each connected region [7]. At the first time step, the regions are arbitrarily numbered. The regions of time step p are compared to the regions of time step p-1, a region in the later time step takes on the number of the region that it has the maximal overlap with; a region that does not overlap with any in the previous time step is again numbered arbitrarily. This is a very simple region tracking algorithm. The purpose of this test is to demonstrate that the bitmap based approach
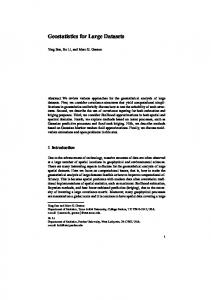
6 Performance on autoignition data This work was motivated by a need to efficiently analyze the datasets produced from a direct numerical simulation of hydrogen-oxygen autoignition process [5, 6]. We have applied our bitmap indexing software to identify and track the regions of interest on two datasets from this application. We report some timing results next. Two sets of data have been used to test the program. Both sets are produced on 2D models and both are produced on uniform grids partitioned into a number of blocks. The smaller dataset uses a 600×600 grid and contains 69 time steps. The larger dataset uses a 1344 × 1344 grid and contains 335 time steps. Figure 8 shows the regions of interest from two different time steps of the larger dataset. The outlines are labeled using the region tracking algorithm described in the previous section. For our performance test, we used randomly generated conditions on eight chemical species involving hydrogen and oxygen. We built indices for these eight attributes. The indices built were the range-encoded bitmap indices and 100 bins were used for each attribute. The total size of the indices and the time needed to create them are listed in a table in Figure 7. In this table, the data size refers to the total size of the eight attributes indexed, not the total size of all attributes. The total size of the smaller dataset is about 1.6 GB and the larger one is about 33 GB. Without compression, the bitmap index sizes would 7
5 1−attribute 2−attribute 3−attribute 4−attribute
4.5
search time (sec)
4 3.5 3 2.5 2 1.5 1 40
45
50
55
60
65
70
a) 600 × 600 grid, 69 time steps 40 1−attribute 2−attribute 3−attribute 4−attribute
35
search time (sec)
30 25 20 15 10 5 0 150
200
250
300
350
b) 1344 × 1344 grid, 335 time steps Figure 9: Search time used by the compressed bitmap indexing scheme to answer queries involving different number of attributes. Each test case is shown as a symbol in the plot, the lines with the same color as the symbols are based on linear regression.
Figure 8: Regions of interest (HO 2 > 10−7 on HO2 background) at selected time steps.
times that of the smaller dataset even though their sizes differ by a factor of about 25. Figure 9 shows the time used by the search step. The time reported is the time used to search through all the time steps in a dataset. More than 200 tests were performed on each dataset2 . To reduce clutter, only test cases that require more than one second on the smaller dataset and five seconds on the larger dataset are shown. The horizontal axes in the figures are the number of time steps containing nonempty regions of interest. The tests are conducted using conditions of the form “X > a and Y
be more than three times of the size of the original data, which is close to the sizes of B-tree indices on the same set of attributes. However, the sizes of our compressed indices are significantly smaller than the data sizes. The timing results reported in Figure 7 are wall clock time measured on a Sun e-450 machine. It uses an UltraSPARC II CPU with a clock rate of 450 MHz and 4 GB of memory. The files reside on a disk suite including five disks. We can usually expect about 20 MB/s throughput from the disk system. The index creation time should be linear in the data size. However, because the larger dataset produced relatively smaller compressed bitmaps, the time needed to create indices for the larger dataset was only 11
2 On the large dataset, since each test is applied to all 335 time steps, this generates a total of more then 66,000 test cases for the region growing procedure
8
a) 600 × 600 grid, 69 time steps # att search grow track 1 1.06 0.22 0.02 2 1.67 0.17 0.01 3 2.12 0.14 0.01 4 2.62 0.14 0.01
record oriented attribute oriented
Figure 12: Time (seconds) used to search the smaller dataset without an index.
b) 1344 × 1344 grid, 335 time steps # att search grow track 1 5.71 2.05 0.12 2 7.39 1.24 0.12 3 8.92 0.58 0.11 4 10.30 0.47 0.10
expected. The times required by the region growing step and the region tracking step decrease as the number of attributes in a query increases. This is because the conditions involving more attributes typically produce smaller regions of interest. Figure 11 shows the maximum time used by the extreme test cases. The total time is less than 40 seconds in all test cases on the large dataset. Much of this time is spent in waiting for the disk system to respond to read requests. For a typical thresholded region defined on one attribute, the search step on the smaller dataset takes less than two seconds and the search step on the larger one takes less than 20 seconds. As more attributes are specified, the worst-case time grows slower than linear. For example, for regions of interest defined on four attributes, it takes less than five seconds on the smaller dataset and less than 40 seconds on the larger dataset; see Figures 9 and 11. Figure 12 lists the time required to perform the searching step using the most naive algorithms on the smaller dataset. Clearly, these naive algorithms take more time than the numbers presented in the Figures 10 and 11. Depending how the data is organized the searching time is different. If data is organized in a record oriented fashion like in a relational database system, to search one attribute effectively requires one to read all pages. The alternative is to organize the data in an attribute oriented fashion, i.e., all values of an attribute are together on consecutive pages. This strategy is suitable for read-only data and is more efficient for feature tracking. In this case, it requires about 5 seconds to perform the searching step without an index. Since the average search step takes about one second with the compressed bitmap index, there is a saving of about four seconds. From Figure 7, we see that generating one bitmap index for the smaller dataset takes about 77.6 (621/8) seconds. It would take about 20 queries for the savings of using the bitmap index to equal to the time needed to create the index. Building the bitmap indices may not be worthwhile if the data is only searched a few times.
Figure 10: The average time (seconds) of different random tests. a) 600 × 600 grid, 69 time steps # att search total 1 1.91 2.51 2 3.70 3.82 3 3.98 4.13 4 4.62 4.77
75 5
b) 1344 × 1344 grid, 335 time steps # att search total 1 19.41 26.72 2 20.33 26.08 3 22.68 23.42 4 35.30 35.95
Figure 11: The test cases that used the maximal amount of total time (seconds).
> b” by randomly selecting the attributes and the threshold values. The linear regression lines are presented not to suggest a linear relation, but merely to guide the comparisons among the queries involving different numbers of attributes. Figure 10 shows the average time used by the three steps of feature tracking: searching, region growing and region tracking. In most test cases, the time required by the search step is a factor of 5–10 larger than the time required by the region growing step which is in turn about a factor of 5–10 larger than the time required by the region tracking step. This is dramatically different from performance data reported in the literature [12] where the region growing time is 20–40 times that of searching time. This is because the bitmap indexing scheme allows the data to be in an order that is efficient for region growing. Most other multidimensional indexing schemes do not allow this option. As the number of attributes in a query increases, the searching time generally increases. We expect the average search time to be proportional to the total index size. 7 Summary and future work The total size of indices for the larger dataset is about 6.7 times that of the smaller one. The average search times In this paper, we reported a set of compressed bitmap only differ by a factor of about 5. This is close to what we based techniques for feature tracking. The bitmap in9
dex is known to be efficient for searching read-only data like those in feature tracking problems. In this paper, we demonstrate that compressed bitmaps can also be efficiently used to perform region growing and region tracking tasks. On uniform grids, our bitmap based approaches for region growing and region tracking are theoretically optimal. Our tests on two sets of autoignition data confirm their efficiencies. On a 33 GB dataset, the worst test case takes less than a minute to process complex conditions involving four different attributes. On the average it only took about 10 seconds. We have shown that our algorithm for identifying regions of interests has the same theoretical complexity as the optimal isocontouring algorithm. However, because isocontouring algorithms can not be directly used in feature tracking, we did not actually implement any isocontouring algorithm. It would be interesting to actually implement one of them and compare the execution time. We might be able to improve the performance of the feature tracking process by reordering the grid points so that the grid is not partitioned into block. This should reduce the size of the bitmap indices and the space requirement during feature tracking. However, since the computational procedure produces data in blocks, the overhead of reordering them may be too high. We need to study this in the future. In this paper, both the analyses and the test data are for uniform grids. However, the algorithms used can be extended. For example, the region growing algorithm can be applied to any regular grid including the nonuniform regular grid and the rectilinear grid without affecting the complexity (O(s)). The searching step using bitmap index can be applied on any kind of grid, but the size of the compressed bitmap representation for a connected region is highly dependent on the order of the grid points. The algorithms may also be adopted to AMR (Adaptive Mesh Refinement) meshes. However, more work is required to implement and to verify the approaches. The compressed bitmap is a compact representation for line segments. On 3D grids, working with rectangles or cubes could be more efficient than working with line segments. Developing a compact data structure for these geometric objects might further enhance the overall performance of feature tracking programs.
References [1] C. Bajaj, A. Shamir, and B.-S. Sohn. Progressive tracking of isosurfaces in time-varying scalar fields. Technical Report TR-02-4, CS & TICAM, University of Texas at Austin, 2002. [2] C.-Y. Chan and Y. E. Ioannidis. Bitmap index design and evaluation. In SIGMOD 1998. ACM press, 1998.
10
[3] C. Y. Chan and Y. E. Ioannidis. An efficient bitmap encoding scheme for selection queries. In SIGMOD 1999. ACM Press, 1999. [4] P. Cignoni, C. Montani, E. Puppo, and R. Scopigno. Optimal isosurface extraction from irregular volume data. In Volume Visualization Symposium, pages 31–38, 1996. [5] T. Echekki and J. H. Chen. Direct numerical simulation of autoignition in non-homogeneous hydrogen-air mixtures, 2003. to be published in Combustion and Flame. [6] H. G. Im, J. H. Chen, and C. K. Law. Ignition of hydrogen/air mixing layer in turbulent flows. In Twenty-Seventh Symposium (International) on Combustion, The Combustion Institute, pages 1047–1056, 1998. [7] W. Koegler. Case study: Application of feature tracking to analysis of autoignition simulation data. In IEEE Visualization ’01, pages 461–464, 2001. [8] Y. Livnat, H. W. Shen, and C. R. Johnson. A near optimal isosurface extraction algorithm for structured and unstructured grids. IEEE Transactions on Visualization and Computer Graphics, 2(1):73–84, 1996. [9] P. O’Neil. Model 204 architecture and performance. In 2nd International Workshop in High Performance Transaction Systems, Asilomar, CA, volume 359 of Lecture Notes in Computer Science, pages 40–59, Sept. 1987. [10] P. O’Neil and D. Quass. Improved query performance with variant indices. In SIGMOD 1997, pages 38–49. ACM Press, 1997. [11] H. W. Shen, C. D. Hansen, Y. Livnat, and C. R. Johnson. Isosurfacing in span space with utmost efficiency (ISSUE). In IEEE Visualization ‘96, pages 287–294, 1996. [12] Q. Shi and J. F. Jaja. Efficient techniques for range search queries on earth science data. In SSDBM 2002, pages 142– 151. IEEE Computer Society, 2002. [13] A. Shoshani, L. M. Bernardo, H. Nordberg, D. Rotem, and A. Sim. Multidimensional indexing and query coordination for tertiary storage management. In SSDBM 1999, pages 214–225. IEEE Computer Society, 1999. [14] D. Silver and X. Wang. Tracking and visulizing turbulent 3D flow. IEEE Transcations on Visualization and Computer Graphics, 3(2):129–141, 1997. [15] K. Wu, E. J. Otoo, and A. Shoshani. A performance comparison of bitmap indexes. In CIKM 2001, pages 559–561. ACM, 2001. [16] K. Wu, E. J. Otoo, and A. Shoshani. Compressing bitmap indexes for faster search operations. In Proceedings of SSDBM’02, pages 99–108, 2002. LBNL-49627. [17] K. Wu, E. J. Otoo, A. Shoshani, and H. Nordberg. Notes on design and implementation of compressed bit vectors. Technical Report LBNL/PUB-3161, Lawrence Berkeley National Laboratory, Berkeley, CA, 2001. [18] K.-L. Wu and P. Yu. Range-based bitmap indexing for high cardinality attributes with skew. Technical Report RC 20449, IBM Watson Research Division, Yorktown Heights, New York, May 1996. [19] M.-C. Wu and A. P. Buchmann. Encoded bitmap indexing for data warehouses. In ICDE 1998, pages 220–230. IEEE Computer Society, 1998.