Blucher Design Proceedings Dezembro de 2014, Volume 1, Número 7 www.proceedings.blucher.com.br/evento/sigradi2013
Using Computational Fluid Dynamics to Design Natural Airflow at a Prototype House Interior Federico Casalegno Massachusetts Institute of Technology, USA
[email protected]
Sotirios D Kotsopoulos Massachusetts Institute of Technology, USA
[email protected] François Guermeur Ecole Nationale Supérieure des Mines, France antoine
[email protected]
Abstract This paper presents an airflow study with Computational Fluid Dynamic (CFD) software that was used to model the natural ventilation attributes at the interior of a prototype house. This study informed the design development phase of the house and guided the design of a dynamic curtain wall involving a matrix of 3 x 9 openable windows for its south façade. Alternative ways of modeling the building geometry were employed and different possible states of the house were examined to determine how change in the orientation and the basic dimensions of the envelope, and modifications in the number, distribution and angle of the open windows affect natural ventilation. Keywords: Performance-‐based design; Airflow; Computational fluid dynamics; Simulation.
Introduction Natural ventilation is of paramount importance in ensuring fine indoor living conditions (ASHRAE handbook, 1989) and securing cost effective environmental management in buildings (Banham, 1969). Even though interior ventilation typically involves a combination of natural and artificial sources, the operation of artificial Heating Ventilating and Air Conditioning (HVAC) systems is energy intensive and natural ventilation is favored. The ability to model the natural ventilation properties of a building during the design development phase, assists in establishing more informed design priorities, and points to environmentally responsible solutions. This paper presents how a series of airflow simulation studies with Computational Fluid Dynamics (CFD) software informed the development of the design for a prototype house located in Trento, N. Italy. The featured prototype consists of an open plan interior with a high thermal mass wooden envelope and an openable curtain wall facing south (Kotsopoulos et al 2012). The prototype integrates passive and active systems that are managed by a central control. The control compiles climatic data, ambient data and feedback from sensors, to supply real time performance evaluation and to optimize energy spending. The originality of this research is that the presented CFD simulations offered a test bed during the design development phase of the house. Alternative methods of modeling the house geometry and its various configurations of use were employed to determine how changes in orientation and dimensions, or modification in the number, distribution and angle of the open windows, affect natural ventilation. This knowledge provided assistance in developing a 3 x 9 matrix of openable windows for the south façade (Figure 1). The concern was that due to the oblong
geometry of the envelope and the large number of openable windows facing south and north, and the standard south-‐north air direction in Trento, the airflow could cause unwanted interior conditions. Furthermore, since the optimal functioning of the prototype depends on the precise adjustment of airflow, sunlight and heat, it was necessary to confirm that the incoming air could sufficiently ventilate the building. CFD simulations provided data on the airflow features of the envelope, leading to better understanding of the ventilation conditions in its interior.
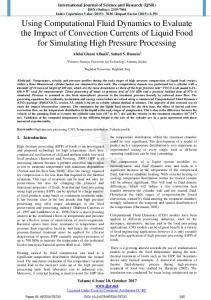
Figure 1: Exterior view of the openable south façade of the prototype house in Trento, N. Italy.
Kotsopoulos, Sotirios D; Guermeur, François; Casalegno, Federico; "Using Computational Fluid Dynamics to Design Natural Airflow at a Prototype House Interior", p. 373-377 . In: Proceedings of the XVII Conference of the Iberoamerican Society of Digital Graphics: Knowledge-based Design [=Blucher Design Proceedings, v.1, n.7]. São Paulo: Blucher, 2014. ISSN 2318-6968, DOI 10.5151/despro-sigradi2013-0071
Simulation
373
Background CFD is a known computational method to study single and multiphase in laminar or turbulent flow. Fluent software was used in our simulations. The differential expressions of the Navier-‐ Stokes equations for momentum, energy and mass balances, were solved by the control volume approach (Andersson et al. 2012). A CFD problem is typically divided in seven steps: 1) geometry modeling, where the geometry and the geometry boundaries are determined; 2) grid generation, where the geometry is divided into computational cells; 3) model definition, where the models for turbulence, chemical reaction etc. are determined; 4) properties setting, where the physical properties of the system are determined; 5) boundary and inlet conditions setting, where the initial conditions of the inflow, outflow and the states of the windows are determined; 6) solution, where the solver, numerical method, transient or steady state and the convergence requirements are determined; and 7) post-‐processing, where the results are interpreted and evaluated.
374
After suitable boundary conditions were determined the calculations were executed by iteration until the numerical error was sufficiently low. To solve non-‐linear equations, specific numerical methods were used, such as the Gauss Seidel algorithm. Discretization schemes were used to estimate the face value for each cell. The face values were calculated through the neighboring cell nodes. A suitable discretization scheme – first order, or second order – was used, based on the flow type. In the first order upwind scheme the face value is estimated by the nearest upstream node. This scheme is good when convection dominates and the flow is aligned with the grid. It is a good scheme to start the calculation and then continue with an upper order scheme, for more accuracy. In the second order upwind scheme the face value is estimated using the assumption that the gradient between the face value and the node is the same. The second order scheme uses two nodes to estimate the face value and it is more accurate but less robust. The simulation was based on the Reynolds decomposition that describes statistically the flow with the mean flow velocity and the turbulent quantities. The turbulent fluctuations were separated from the non-‐turbulent quantities for each time period. The transport of momentum by turbulence was approached as a diffusive process and the Reynolds stresses were modeled using turbulence viscosity. The k-‐epsilon (k-‐ε) model and the Reynolds Stress model were tested. The k-‐ε model does not apply to round jet, and flows involving significant curvature, sudden acceleration etc. The Reynolds Stress model is applicable to complex flow (swirl, flow separation and planar jets) and it takes in account the anisotropy, but it is computationally expensive. After a series of experiments it became clear that the variation in the results between the two turbulence models were small. This was due to the fact that the envelope does not generate complex flow as swirl, flow, separation, and planar jets. Thus in the presented simulations we used the standard k-‐ε model.
SIGraD i 2013
Finally, close to the wall the turbulence models are no longer applicable when the Reynolds number is decreasing and the flow becomes laminar. The velocity fluctuation is decreasing in the mean flow direction by kinematic blocking and in the tangential direction by viscous dampening. Hence, a wall function was used to apply boundary conditions at a close wall distance.
Design and Modeling A problem that one confronts each time it is necessary to model a schematic building envelope is how to partition it. The general scheme of the prototype house in Trento consists of an open plan rectangular interior with a large solar wall facing south (Figure 2). The wooden envelope secures high thermal resistance and low conductivity by conserving heat during the winter and preventing from excessive heat during the summer. A single pitched roof stands 1.95 m high on the north and pitches up to 2.65 m on the south thus exposing a wide façade area to the sun. The south glass façade aims at achieving three important objectives: (1) regulate airflow; (2) regulate the percentage of solar heat that penetrates the house; and (3) regulate interior daylight illumination. The windows of the south façade are automatically activated, and driven by a high-‐level control system. Various façade configurations can be achieved. The placement of the bathroom in the open plan scheme, and the distribution and number of the open windows on the façade, were the primary two factors influencing the interior airflow conditions, and the house performance. In order to mesh and simulate airflow in this envelope, we modeled the bathroom by “extrusion” as one continuous material block. The “cutting” and “slicing” commands was used to cut out the intersecting parts ensuring that the block goes through all the intersecting surfaces (Figure 3, up).
Figure 2: General plan scheme of the house in Trento consisting of an open plan rectangular interior with a large solar wall facing south.
for the windows a different component was included for the inlet velocity. Hence, if the windows are open with an angle of 45 °, the boundary condition is a component of 1 to the x direction and -‐1 to the y direction.
Design and Simulation
Figure 3: Up: The bathroom was modeled as one continuous material block. Down: The partitioning of the south (left) and north (right) façade modules.
Early design iterations of the house were coupled with simulations to confirm the hypothesis that higher efficiency could be achieved through the integration of two entirely opposite systems, passive and active, in the same building envelope. The integration of passive and active systems became the driving force of the design. Passive systems usually preserve a single state, constantly providing a standard level of performance, while active systems attain multiple states, providing variable levels of performance based on conditions. The passive systems of the house include the high thermal mass base and the northern section of the building envelope. The main active system of the house is the south openable façade. The simulations were used to address the problems of integrating the passive and active systems more explicitly. At the final stage, deciding to incorporate a large matrix of 3 x 9 openable windows 70 cm x 70 cm each, was a risky proposition.
Furthermore, the windows of the south façade were partitioned into five modules A, B, C, D and E. The dimension of each window 2 module was approximately 3 x 3.5 m . This allowed testing various window configurations without creating a complex model. The openings of the north façade were organized into three modules, namely A, B, and C (Figure 3, down). To allow the application of different boundary conditions on these openings, a thin volume was created for each window and door. To yield accurate results, this solution required the application of a very fine mesh. An alternative way to achieve equally accurate results was to divide the surfaces by an existing command in Fluent.
The wind and sun conditions in the area of Trento were carefully analyzed and consecutive simulations with CFD software made possible to understand the precise effects of such a wide openable façade in the house interior. Each of the inlet modules A, B, C, D, and E on the matrix of the south façade is independently operable and the same applies to the outlet modules A, B, and C on the north façade. Cross ventilation is possible when inlet windows (W) and outlet windows (W) or doors (D) facing south and north are open simultaneously. Diagrams of turbulence intensity and velocity for 12 distinct simulation studies with CFD software are presented next in Figure 5. The input values for these simulations appear in Table 1.
Simulation of turbulent flow requires knowing the flow in each part of the boundaries from where the flow enters in the computational domain. These domains are the inlet, the outlet, and the walls. The air velocity is specified at the inlet. For a turbulence model with two equations the turbulent kinetic energy k and the dissipation rate ε are specified at the inlet. An alternative of these boundary conditions is to specify the turbulent intensity and a characteristic length scale. In our simulations, the turbulence intensity was defined by the ratio of the fluctuating component of the velocity, to the mean velocity. The average air velocity was specified for Trento to be 4 m/s. The outlet condition was specified for the north windows at the outflow to avoid reversed flow in the building.
To simulate the orientation of the windows on the south façade it was assumed that the wind is a vector. As a boundary condition
Figure 4: Two extreme systems of sustainability were combined: passive/north (left) and active/south (right).
Simulation
375
376
Figure 5: Coupled diagrams of turbulence intensity (up) and velocity (down) for each of the 12 distinct CFD simulations of interior airflow. Table 1: Input conditions of the 12 distinct simulations of airflow with CFD software Fluent. Sim 1 2 3 4 5 6 7 8 9 10 11 12
Inlet Windows (W) (W) A, B, C, D, E (W) A (W) B (W) D (W) E (W) E (W) E (W) A (W) A (W) A (W) A, B, C, D (W) A, B, C, D
Outlet Windows (W), Door (D) (D) north, (W) center, (W) north (D) north, (W) center, (W) north (D) north,(W) center, (W) north (D) North, (W) center , (W) north (D) north (W) center (D) north, (W) center, (W) north (D) north (W) center (D) north(W) center, (W) north (D) north, (W) center, (W) north (D) north, (W) center, (W) north
The CFD simulations provided quantitative information on the changes in interior airflow for different possible configurations of the house windows (W) and doors (D). The concern was that due to the open plan oblong geometry and orientation of the envelope, the standard south-‐north air direction in Trento, and the number, angle, and distribution of the open windows, the airflow could cause unwanted turbulence conditions at the house interior. Furthermore, CFD airflow and temperature simulation allowed understanding the optimal window angle settings permitting to
SIGraD i 2013
Velocity (m/s) 4 4 4 4 4 4 4 4 4 4 4 4
X
Y
Z
1 1 1 1 1 1 1 1 1 1 1 1
0 0 0 0 0 0 0 0 0 0 -‐1 -‐1
0 0 0 0 0 0 0 0 0 0 0 1
cool or heat the interior during the different seasons, at minimum HVAC use. Table 1 shows that in simulation 1 all the windows (W) of the south and north façades are completely open, and so is the north door (D). The inlet velocity is 4 m/s, the x-‐component of the flow direction is set to 1, and the y and z components to 0. The average velocity value at the house interior was calculated to be 3.090856 m/s. The values of average velocity for the above 12 simulation studies are presented in Table 2.
Table 2: Average velocity values at the house interior based on 12 distinct simulation studies. Simulation
Average Velocity (m/s)
1
3.090856
2
1.108957
3
1.204766
4 5
1.333071 1.182033
6
1.252435
7
1.601249
8 9
0.7995199 1.172581
10
1.471582
11
2.365855
12
2.192086
The values of average velocity for 12 distinct configurations of open windows and doors show that for an inlet of 4 m/s, which is the average wind velocity in the region of Trento, the maximum average velocity in the house interior is 3.09 m/s. This value is satisfactory, and it is equal to the average velocity when a smaller number of windows in specific subsections of the façade is open, to ventilate a specific subpart of the house interior (i.e. ventilating only the kitchen, etc.). To reduce the airflow velocity, it is necessary to limit the number of open windows. The simulation 11 shows that holding all the house windows open at a 45° angle, makes the average velocity drop to 2.37 m/s. Hence, a reduction of more than 23 % in average velocity can be achieved. In order to verify the effect of envelope dimension change to airflow, an additional simulation was performed in which the house width was reduced from 7.98 m to 5.98 m. This test followed the inputs of simulation 1. Reducing the width by 2 m, with air direction south-‐north and the windows completely open, caused an increase in the average velocity by 0.14 m/s, yielding a value of 3.23 m/s. This result confirmed the expected raise in the turbulence intensity: a small interior volume leads to more turbulence than a larger one. Finally, the orientation is an important factor affecting airflow velocity. The prototype house has its main openable curtain wall facing south and the air direction in Trento is south-‐north. Simulation showed that if the house is built with an angle of 45° from the north-‐south axis, and the windows are kept partially open at an angle of 45°, the air is also entering the house at an angle of 45°, resulting to a 0.18 m/s drop of the average velocity, yielding a value of 2.19 m/s.
during the design development phase of the house, and guided the design of its principal, openable south façade. The prototype house in Trento is an example of environmentally responsible architecture that points to certain visionary technological possibilities. It combines two extreme concepts of passive and active sustainability. The passive systems of the house include the high thermal mass base and the northern part of the envelope, securing high thermal resistance and low conductivity to conserve heat during the winter and prevent from excessive heat during the summer. The main active system of the house is the south façade incorporating a matrix of 3 x 9 openable windows, 70 cm x 70 cm each. The south façade allows the precise adjustment of natural ventilation and solar heat in order to minimize the use of the HVAC system. Based on the yearly energy performance, the material constitution and thickness of the southern and northern sections of the house envelope were developed in parallel to insulate the interior from the exterior environment while allowing a precise control of the incoming natural elements. The combination two extreme design concepts in the same enevelope was a risky design decision. The main concern was that due to the open plan, oblong geometry of the envelope, the large total number (30) of openable windows facing south and north, and the standard air direction in Trento (south-‐north), the airflow could cause unwanted interior conditions. Furthermore, since the optimal functioning of the prototype depends on the capacity to adjust airflow, sunlight and heat, it was necessary to affirm that natural airflow could sufficiently ventilate the building. Consecutive CFD simulations provided data on the airflow properties of the envelope, leading to accurate prediction of the natural ventilation conditions in its interior. The simulation settings represented different combinations of parameters, corresponding to various settings of the envelope. And the software Fluent that was used in the simulations, allowed modifying the turbulent models, the numerical schemes, the inlet condition and the mesh density.
Acknowledgment This research was conducted within the Green Home Alliance between the Mobile Experience Lab at the Massachusetts Institute of Technology and the Fondazione Bruno Kessler, in Trento, Italy.
References Andersson, B., Andersson, R., Hakansson, L., Mortensen, M., Sudiyo, R., & VanWachem, B. (2012). Computational Fluid Dynamics for Chemical Engineers. Cambridge University Press.
Conclusion
ASHRAE Handbook. (1989). Physiological Principles: Comfort and Health.
This paper presented a study of the airflow conditions at the interior of a prototype house using CFD software. Multiple experiments were performed in a geometry that was appropriately modeled to permit flexible simulation of various configurations of the house elements. The originality of the research is that the presented CFD simulations provided a test bed
Banham, R. (1969). The Architecture of the Well-‐tempered Environment. Architectural Press. Kotsopoulos, S.D., Casalegno, F., Ono, M., & Graybill W. (2012). Window Panes Become Smart: How responsive materials and intelligent control will revolutionize the architecture of buildings. Proceedings of the First International Conference on Smart Systems, Devices and Technologies, Stuttgart, Germany, 112-‐118.
Simulation
377