Signal Processing 132 (2017) 110–120
Contents lists available at ScienceDirect
Signal Processing journal homepage: www.elsevier.com/locate/sigpro
Using graph clustering to locate sources within a dense sensor array ⁎
Nima Riahi , Peter Gerstoft
crossmark
Scripps Institution of Oceanography, University of California San Diego, La Jolla, CA92093, United States
A R T I C L E I N F O
A BS T RAC T
Keywords: Seismic arrays Source localization Graph clustering Non-parametric estimation
We develop a model-free technique to identify weak sources within dense sensor arrays using graph clustering. No knowledge about the propagation medium is needed except that signal strengths decay to insignificant levels within a scale that is shorter than the aperture. We then reinterpret the spatial coherence matrix of a wave field as a matrix whose support is a connectivity matrix of a graph with sensors as vertices. In a dense network, wellseparated sources induce clusters in this graph. The geographic spread of these clusters can serve to localize the sources. The support of the covariance matrix is estimated from limited-time data using a hypothesis test with a robust phase-only coherence test statistic combined with a physical distance criterion. The latter criterion ensures graph sparsity and thus prevents clusters from forming by chance. We verify the approach and quantify its reliability on a simulated dataset. The method is then applied to data from a dense 5200 element geophone array that blanketed 7 km × 10 km of the city of Long Beach (CA). The analysis exposes a helicopter traversing the array and oil production facilities.
1. Introduction Large and dense sensor arrays are becoming more common as the cost for sensor and communications hardware decreases. Examples of such arrays are the USArray initiative in seismology with 500 stations covering large parts of the continental US [1] or the seismic exploration array with 5200 sensors as presented here. As array sizes increase the occurrence of within-aperture source events that cause coherent signals over only a small fraction of all sensors becomes more common. This work addresses the problem of localizing such weak sources in a complex and unknown environment. For known or well-characterized media this problem has been addressed using frameworks such as matched field processing (MFP), maximum likelihood methods, or migration techniques in, e.g., acoustics [2–5], seismology [6–10], infrasound acoustics [11,12], and electromagnetics [13,14]. The eigen-structure of the array covariance matrix or its inverse plays an important role in these approaches, in particular for data-adaptive implementations using, e.g., MVDR [15] or MUSIC [16]. A possible solution to locate sources in dense networks without relying on medium information is the spatiotemporal analysis of signal intensity [17,18]. However, using power alone cannot detect sources near or below the noise floor. We present a model-free analysis approach that can work also for weak signals through the use of coherent averaging. The only assumption made is that source signals enter the noise floor within a distance that is much smaller than the array aperture. That requirement is ⁎
realistic for large arrays based on wave propagation in moderately attenuating media such as the earth. We follow a graph-based analysis paradigm [19,20]: The sensors are arranged as vertices in a graph with edges between vertices existing if the corresponding sensors share a common coherent signal. Thus the graph connectivity matrix is defined as the support of the array coherence matrix. For long observation times, we demonstrate that finding weak within-aperture sources is tantamount to identifying connected components in this graph (here referred to as clusters). Such clusters can be found through an eigenvalue decomposition of a matrix (the graph Laplacian) that is derived from the connectivity matrix [21]. In the limited-data case stochastic fluctuations in the coherence can create spurious connections in the graph, thus leading to large connected components, a well-known phenomenon studied in random graph theory. To prevent such spurious clusters from forming we additionally limit the connectivity to the physical neighborhoods of the sensors. The general applicability of the method comes at the cost of lower precision compared to model-based localization methods: a source is only identified through the sensors on which it has had a significant impact. For the large geophone array (analyzed above 10 Hz) we find that the sensor clusters mostly correspond to a small fraction of the array, indicating that high-frequency sources are well determined. We are not aware of any existing techniques that identify such sensor subsets that sense a common source. The rest of this paper is organized as follows: Section 2 defines the coherence hypothesis test, introduces some graph concepts, and
Corresponding author. E-mail addresses:
[email protected] (N. Riahi),
[email protected] (P. Gerstoft).
http://dx.doi.org/10.1016/j.sigpro.2016.10.001 Received 19 February 2016; Received in revised form 2 October 2016; Accepted 3 October 2016 Available online 07 October 2016 0165-1684/ © 2016 Elsevier B.V. All rights reserved.
Signal Processing 132 (2017) 110–120
N. Riahi, P. Gerstoft
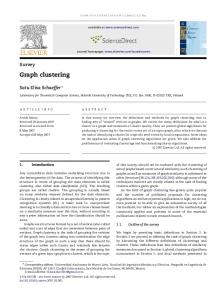
xj are uncorrelated and each i.i.d. complex Gaussian with a variance that depends on the snapshot index. Fig. 1A shows the simulated pdf of lijc for the three scenarios (based on 106 realizations). The pdf of the C lijc substantially deviates from the stationary case for sample coherence C the two non-stationary scenarios considered. This instability with lijc a poor choice for a hypothesis respect to heteroscedasticity makes C lij for the same test against independence. Fig. 1B shows the pdf of C scenarios as before and demonstrates how the distribution of this statistic is invariant for the considered heteroscedasticity scenarios.
describes how a graph is constructed from the array coherence matrix. In Section 3 a proof is given that within-array sources induce clusters in that graph in the asymptotic case assuming sufficient spatial signal decay. We verify and test the reliability of finding sources using these clusters on simulated data in Section 4. This is followed in Section 5 by an application to real data from a 5200 sensor geophone array that covered 70 km2 of the city of Long Beach (CA) with a sensor spacing of about 100 m. 2. Coherence matrix defines a graph
2.1.2. Hypothesis test We describe a hypothesis test with robust test-statistics to establish the support of the array coherence matrix Γij Eq. (3). We test for the two alternative hypotheses:
Consider a large aperture array with N sensors distributed densely over spatial locations {ri}i =1, …, N . The arrays we consider are quasiuniform, but different configurations are applicable. This section first describes a hypothesis test to find the support of the coherence matrix of these sensors and then describes how to use this support to construct a graph and find its clusters. Finally, we investigate the clustering behavior in a source-free network.
H0: Γij = 0, H1: Γij ≠ 0,
i.e. the signals observed at locations ri and rj are uncorrelated (H0) or correlated (H1). We use the magnitude of the robust sample coherence lij Eq. (5) to test the hypothesis. If H0 is true, then C lij will be C distributed according to a pre-computable PDF (Fig. 2 shows the PDF for M=19 derived by simulation). The hypothesis H0 is accepted if lij ≤ cα and rejected otherwise. The threshold coherence magnitude cα C is set such that the probability of falsely rejecting the hypothesis is α, formally cα = cdf−1(1 − α ), where cdf−1(·) is the inverse of the cumulalij estimated by simulation (blue plot in tive distribution function of C Fig. 2). Fig. 3 shows how cα decreases monotonically with increasing number of snapshots M. For M = 19 we have cα = 0.484 . Note that if the travel time difference between two sensors exceeds TW then the contribution of that source to the coherence is zero. While a large M is preferred for statistical reasons, due to the non-stationary sources M cannot be too large. To provide an idea about the likelihood of falsely accepting the nullhypothesis (e.g. a misdetection) Fig. 2 also shows the simulated PDF of lij for the case where there is a signal present: xi = s + ni and C xj = s + nj where Ps = var(s ) and Pn = var(ni ) = var(nj ) and SNR = Ps / Pn = 3, i.e. H1 is true. The false acceptance probability for H1 is 0.0768 (area under orange curve below cα).
2.1. Coherence hypothesis test 2.1.1. Robust coherence We compare the behavior of two definitions of magnitude of coherence for uncorrelated and heteroscedastic signals, i.e. stochastic signals with time-varying variance. Consider a zero-mean signal uj(t) observed at location rj and captured by a window of Q samples at intervals Δt . Its discrete Fourier transform over a period TW = QΔt during the m-th window (snapshot) is defined as: Q −1
xj (m, f ) =
∑ wq uj (mQΔt + qΔt ) e−ı2π (qΔt ) f , (1)
q =0
k , TW
k = 0, …, Q /2 and the where the frequencies are discretized f = weights wq control spectral leakage [22]. All the considerations in this paper are made in the Fourier domain. Let xi(m) and xj(m) be a sequence of snapshots of two such signals in the frequency domain, m = 1, …, M . The sample covariance is defined as lij = 1 Γ M
M −1
∑ xi (m) x*j (m), m =0
(2)
2.2. Graph preliminaries
with the actual covariance reached for infinite snapshots: →∞ lij ⎯M⎯⎯⎯⎯⎯ Γ →Γij .
An undirected (symmetric) and unweighted graph G consists of N vertices {vi}i =1… N and edges {eij }j ≥ i ∈ {0, 1} where eij = 1 means that vi and vj are connected. The edges define a binary and symmetric connectivity matrix E with Eij = eij . The number of edges connecting to vertex vi is its degree di. The mean vertex degree γ of a graph is the average over the vertex degrees of all its vertices. If γ approaches a constant as N increases the graph is sparse [24]. A connected component U ⊂ G is a subset of vertices and edges in G for which every pair of vertices v, v′ ∈ U is connected directly or indirectly through a sequence of edges in U (see Fig. 4). Finding
(3)
The sample covariance estimate will be affected by the variances in xi and xj that are unrelated to any physical relation between the two sensors. A customary attempt to reduce the impact of such variations is to compute the coherence as a normalized covariance. We compare two definitions of magnitude of coherence. A full-sample normalized coherence:
lijc = C
1 M −1 ∑ xi (m ) x*j (m ) M m =0 , 1/2 ⎞1/2 ⎞ ⎛ 1 M −1 ⎛ 1 M −1 2 2 ∑ ∑ | ( )| | ( )| x m x m ⎟ ⎟ ⎜ ⎜ i j ⎠ ⎠ ⎝ M m =0 ⎝ M m =0
Table 1 Three scenarios considered for M=19 snapshots of the noise processes xi and xj (see Fig. 1). xi(q) refers to the q-th snapshot of process xi.
(4)
and a version relying only on phase-information:
lij = C
1 M
M −1
∑ m =0
xi (m ) x*j (m ) . |xi (m )| |xj (m )|
(6)
(5)
The coherence (5) only relies on phase information and is invariant against heteroscedasticity, i.e. signals with time-varying intensity [23]. This is important because such signals are common in seismic and acoustic time-series. To illustrate the effect of heteroscedasticity we consider three scenarios for xi and xj as shown in Table 1, where xi and
Scenario
Variance xi
Variance xj
Stationary
σi2 (1⋯19) = 1
σ j2 (1⋯19) = 1
Heteroscedastic 1
σi2 (1⋯5) = 10
σ j2 (1⋯5) = 10
σi2 (6⋯19)
=1
σ j2 (6⋯19) = 1
σi2 (1⋯5) = 10
σ j2 (1⋯14) = 1
σi2 (6⋯19)
σ j2 (15⋯19) = 10
Heteroscedastic 2
111
=1
Signal Processing 132 (2017) 110–120
N. Riahi, P. Gerstoft
Fig. 4. A sample graph G with N=9 vertices (circles) and four edges (lines). The connected component U consists of the vertices and edges within the dashed area. Vertex vj has degree dj=3 and vi degree dj=2. The mean vertex degree γ = (5*0 + 1 + 2*2 + 3)/9 = 8/9 .
connected components is a basic task in graph analysis [25] and is an example of spectral clustering for non-overlapping clusters. In this context the connected components are found using the eigen-vectors of the graph Laplacian, which is derived from the connectivity matrix E [21]. We assume now that there are K fully connected components Uk in G, i.e. each vertex in Uk connects to all other vertices in Uk. Let uk = [u1k , …, uNk ]T be the vertex indicator vector of Uk (uik = 1 if vik ∈ U k and 0 otherwise). The connectivity matrix of G is then (see Appendix A):
Fig. 1. (A) The PDF of the sample coherence (4) for uncorrelated signals xi and xj. A stationary and two heteroscedastic scenarios are considered (see Table 1). (B) The pdf of sample coherence (5) for the same three scenarios (lines overlap).
E=
∑ uk uTk , k
(7)
where k indexes the set of connected components of G. Note that any graph where the same vertices are connected in groups has the same or a smaller support than E . Finally, consider the random, unweighted graph G0 (N , p ) with N vertices where all pairs of vertices have the same probability p of being connected. The mean vertex degree in G0 (N , p ) is therefore γ = (N − 1) p because every vertex can connect with all N − 1 other vertices with equal probability. A large fraction of vertices in a random graph tend to be connected when γ > 1 with about 90% being connected when γ > 2.5 [24]. Such a high connectivity, e.g. 90%, will thus occur above a threshold probability of
lij (5) for uncorrelated noise, Fig. 2. The PDF (blue) of the magnitude sample coherence C
p0 = 2.5/(N − 1),
Γij = 0 , for M=19. The decision threshold cα=0.484 is exceeded with probability α=0.01. lij for the case of Γij ≠ 0 with a common signal present in the noise The PDF (orange) of C
(8)
i.e. for an edge probability above p0 most vertices will be connected. This upper limit decreases as the graph grows larger. For a graph with N=300 vertices this threshold is already below 0.01. As we will see later, preventing large clusters from forming by chance is important because the clusters will be used to detect sources within a sensor network.
of the two recordings (SNR = 3). (For interpretation of the references to color in this figure caption, the reader is referred to the web version of this paper.)
2.3. Constructing an array graph Armed with the hypothesis test in Section 2.1.2 we construct a coherence graph G0 with the following connectivity matrix:
⎧1 if C lij > cα Eij0 = ⎨ ⎩ 0 otherwise,
(9)
i.e. two vertices are connected if the corresponding signals exhibit significant coherence. This straight-forward construction of an array graph, however, is insufficient because of the statistical fluctuations of the hypothesis test. Even if the array is sensing N uncorrelated noise lij > cα is α for all receiver pairs. signals the probability of observing C This means that G0 is a random graph G0 (N , α ). As seen in Eq. (8) a
Fig. 3. The decision threshold cα (α = 0.01) as a function of number of snapshots M. For M=19 we have cα = 0.484 .
112
Signal Processing 132 (2017) 110–120
N. Riahi, P. Gerstoft
procedure is repeated 200,000 times. Fig. 7 gives the fraction of simulations where the vertices exceeded a given number. For the later analysis for noise affected array data we are interested in a minimum size criterion that rejects as many random components as possible while not being overly conservative. Note that large values for these criteria will increase the cluster size and hence the resolution with which sources can be localized. Requiring a minimum of seven vertices seems a safe criterion because none of the simulations gave rise to such large components. But this would unduly limit the size of the smallest resolvable cluster. The smallest tolerable minimum cluster size is four vertices, which occurred in 10.8% of simulations. This fraction seems high at first, but upon closer scrutiny we find that of the clusters in these simulations only 9.3% contained four or more edges, with all the others having three edges. We therefore settle on a minimum criterion of four vertices and four edges, in which case only 10.8% × 9.3 %= 1.0% of random simulations would pass the criterion.
graph with, say, 300 sensors will likely have a giant connected component if α > 2.5/(300 − 1) = 0.008. For graphs constructed with a less conservative threshold any attempt to find smaller connected components that are not due to chance is thus futile. We modify (9) to define a localized coherence graph G (cα ) with connectivity matrix:
⎧1 if C lij > cα and i ∈ N ( j ) Eij = ⎨ ⎩ 0 otherwise,
(10)
where N ( j ) is the index set of the nearest neighbors of sensor j. For a regular lattice, the nearest neighbors are here limited to eight sensors as shown in Fig. 5. Besides being coherent any two connected sensors are thus also required to be spatial neighbors. Enforcing spatially short connections limits the number of neighbors any vertex can connect to in a way that is independent of the global graph size and the graph therefore remains sparse for large arrays. The criterion equation (10) thus reduces the chance of forming clusters by chance, even for values of α that are above the threshold suggested by (8). Sensor clusters can still have a spatial extent beyond that given by the nearest neighbors as long as the vertices in the cluster are contiguous in space. To characterize the spatial extent of each connected component Uk a two-dimensional Gaussian probability density function is estimated from the sensor locations of the vertices of Uk with mean and covariance, respectively:
mk =
1 |U k |
∑
ri Σk =
i∈Uk
1 |U k |
∑
(ri − mk )(ri − mk )T ,
i∈Uk
3. Sources induce graph clusters The relation between sources within an array and the clusters of a graph constructed from the array data has been presumed so far. Combining signal features for clustering purposes to analyze sources was used implicitly in a heuristic approach in [26] for the difficult case of an ad hoc and dynamic sensor network with communication constraints. In this section we make the relation between sources and network clusters explicit for the asymptotic case of infinite observation time without communications constraints but under the assumption that source-to-receiver coherence is insignificant after some physical distance. Consider again a large aperture array with N sensors distributed densely over spatial locations {ri}i =1, …, N . It is assumed that there are weak sources within the aperture that produce signals that propagate through space. For a given frequency the channel between any such source location ρ and sensor location ri is characterized by a Green's function, g (ri, ρ). Let the vector g (ρ) = [g (r1, ρ), …, g (rN , ρ)]T ∈ N be the frequency domain response of the array to a source at location ρ. Consider then ρk to be the location of K sources {ρk }k =1, …, K with an associated response g (ρk ) ≡ g k and source signals sk . The measured signal at the N array sensors is thus modeled as:
(11)
k
|U k |
is the number of vertices in U . The source area is the region where where the point source is likely located and is here defined as the ellipse that contains a probability mass p of the Gaussian defined in (11): 2 Ωk ( p ) = {r|(r − mk )T Σ−1 k (r − mk ) < χI ( p )}, 2
(12)
2
where χI is the cumulative inverse χ -distribution with two degrees of freedom (because the Gaussian is 2D). An effective source diameter d eff of a disk with the same area A (Ωk ) as the source ellipse Ωk is defined as:
d eff = 2 A (Ωk )/ π .
(13)
For a source within the array aperture Ω is the geographic area within which the source is estimated to be. As will be seen in Section 4 this definition of source area works well for the simulation considered, but source directionality, physical obstacles or attenuation heterogeneities in the propagation medium can cause Ω to be not centered around a source. Sensor geometry such as array gaps and boundaries will also cause a cluster to move away from its source. In those special cases the identified clusters can, however, still serve to select a data subset for follow-up analysis with other array processing methods since by definition its sensors contain significant signal levels from a common source. E.g. conventional beamforming using just the data from the vertices in Uk.
K
x=
∑ sk gk + n, k =1
(14)
2.4. Size of connected components in noise-only array As discussed before the distance constraint in (10) prevents connected components to form by chance even in large arrays. We demonstrate this for a rectangular array of size 2.8 × 2.8 km with sensor spacing of ∼100 m and 841 sensors (gray triangles in Fig. 6). We consider M = 19 snapshots of random complex Fourier coefficients, as this is the number of snapshots also used later in the analysis, Sections 4 and 5. For each vertex, the M=19 snapshots are simulated as random complex numbers drawn from the complex Gaussian distribution and lij Eq. (5) is formed. The corresponding the sample coherence matrix C array graph G (cα=0.01) is constructed and the number of vertices and edges of the connected component with the most vertices is stored. The
Fig. 5. Connections between a sensor are only allowed to its nearest neighbors. The eight nearest neighbors (red open triangles) are shown for two example sensor locations (red triangles). (For interpretation of the references to color in this figure caption, the reader is referred to the web version of this paper.)
113
Signal Processing 132 (2017) 110–120
N. Riahi, P. Gerstoft
Fig. 6. Simulation layout showing 841 sensors in a regular configuration (gray triangles). The four sources are located at the center of the red circles. An interpolated map of signal power across the array averaged over M = 19 snapshots is shown in the background. The log-normally distributed noise power prevents the sources from appearing as distinguished peaks. (For interpretation of the references to color in this figure caption, the reader is referred to the web version of this paper.)
Fig. 8. (A) The sensor graph constructed from the simulated data for SNR = 10 and α = 0.01. The plot shows the array (gray triangles) with the graph edges (gray lines). Connected components with more than four vertices and four edges are highlighted with an ellipse Ω (0.50) following Eqs. (11) and (12). In addition, for a North–South line of sensors (yellow asterisks) all nodes connecting to it are shown (black asterisks). (B) Nonlij for the column of nodes in (a) (yellow zero entries of the localized coherence matrix C
Fig. 7. Histogram over the largest cluster size in 200,000 random realizations of a localized coherence graph G (cα ). In most random graphs the largest cluster has three vertices. Of all simulations 11% contained at least one cluster that had four or more vertices, but only 0.08% had four or more vertices as well as four or more edges.
asterisks). Only the 32 nearest elements to the diagonal element are shown. (C) The connectivity matrix Eij corresponding to (B). (For interpretation of the references to color
where n = [n1…nN ]T ∈ N is a multivariate i.i.d. noise process. From (14) the covariance matrix is:
∑
We now define Eij = 0(Γ) as the connectivity matrix of a graph G with N vertices (sensors), i.e. there is an edge between vertices i and j if Eij = 0(C)ij = 1. As shown in Appendix A such a graph G will have exactly K connected components, i.e. K non-overlapping subsets S k ∈ G whose vertices are indicated by 0(g k). The connected components thus correspond to the sensor clusters that sensed the K sources. Finding connected components is a standard task in graph analysis [25]. In Sections 4 and 5 we use an approach from spectral clustering [21] which uses the eigendecomposition of the graph Laplacian, which is derived from the connectivity matrix as
K
K
Γ = xxH =
in this figure caption, the reader is referred to the web version of this paper.)
sk sl* g k g lH
k , l =1
+ nnH =
∑
sk sl* g k g lH + D
k , l =1
K
=
∑ 〈|sk |2 〉gk g kH + D,
(15)
k =1
where (·) H is the complex conjugate transpose and 〈·〉 is the expectation over infinite time. Here we exploit the mutual independence between the source and noise processes si n*j = 0, ni n*j = si s*j = δij , ∀ i , j , and D is a diagonal matrix with Dii the noise variance of sensor i . We assume that there is a distance δ smaller than the array dimensions such that g (ri, ρ) is small if ∥ ρ − ri ∥2 > δ , i.e. signals cannot be detected beyond δ . This is used to form connected graph for each source. If all sources are separated by at least 2δ, ∥ ρk − ρl ∥2 > 2δ ∀ k ≠ l , then the corresponding support sets of the sources do not overlap. Let 0(v) be the support indicator function of a vector or matrix v . The lack of overlap of the g k and the support-indicator function properties (see Appendix B) allow us to write the support of the sum in (15) as
⎞ ⎛K 0(Γ) = 0⎜⎜∑ |sk |2 g k g kH ⎟⎟ = ⎠ ⎝ k =1
K
k =1
N
with K a diagonal matrix with Kii = ∑ j =1 Eij . Let the eigen-decomposition of L be
L = USUT .
k =1
(18)
Following [21], Proposition 2] there will be exactly K eigenvectors with eigenvalue 0 and the column vectors in U corresponding to those eigenvectors will each indicate one of the K connected components through its non-zero entries.
K
∑ 0(gk g kH ) = ∑ 0(gk) 0(gk)T .
(17)
L = K − E,
(16) 114
Signal Processing 132 (2017) 110–120
N. Riahi, P. Gerstoft
Fig. 9. The sensor graph constructed from the simulated data for (first column) SNR = 0.1, (second column) SNR = 1, (third column) SNR = 10 , and (fourth column) SNR = 100 and (first row) α = 0.005, (second row) α = 0.01, (third row) α = 0.05, and (fourth row) α = 0.1. Each plot shows the array (gray triangles) with the gray lines showing graph edges. Connected components with more than four vertices and four edges are highlighted with an ellipse Ω (0.50) following Eqs. (11) and (12).
purely a function of local noise. lij for Given xi (m ) we use (5) to obtain a sample coherence matrix C M = 19 snapshots. From this a graph G (cα=0.01) is constructed using (10) and the connected components with more than four vertices and four edges (see Section 2.4) are identified as potential source indicators. The location and size of the estimated source area is calculated from Eqs. (11) and (12) as m and Ω ( p = 0.5). To demonstrate how the connected graph is constructed we focus on the SNR = 10 and α = 0.01 case in Fig. 8A. Computing the coherence for a sequence of sensors fromsouth to north (yellow asterisks) and applying the nearest neighbor localization introduced lij , Fig. 8B, where in Eq. (10) gives a banded localized coherence matrix C the sensors are numbered column-vice from southwest to northeast. The center diagonal corresponds to the sensor itself and is set zero, the first off-diagonal corresponds to the sensor above and below in Fig. 8A. Since each column has 29 sensors, the 3 sub-diagonals ± 29 entries lij > α away corresponds to the 3 left and right sensors. Testing if C defines the graph connectivity matrix Eij according to Eq. (10), see Fig. 8C. Each element Eij = 1 represents a connection between sensors i and j . The black asterisks in Fig. 8A show all connections other than those to the yellow asterisks. In Fig. 9 , we perform a simulation for four fixed sources over a wide range of SNR and α values. It is apparent how higher SNR and higher α tend to increase the size and the number of detected clusters. Note that a cluster indicates all sensors that are sensing the signal with sufficient strength, explaining why at high SNR a larger cluster size is obtained. As can be seen with the blue clusters in Fig. 9 for high SNR
4. Verification on simulated data Consider a homogeneous half-space with medium propagation velocity c = 340 m/s and a square array on its surface with aperture 2.8 km × 2.8 km . The sensors are placed in a regular lattice configuration spaced 100 m apart, i.e. N = 29 × 29 = 841 sensors at positions r1, …, rN (Fig. 6). Four point-sources are simulated at random locations ρk (red circles) with uncorrelated complex Gaussian source signals, with signal power sk (t ) ∼ *5 (0, σk2 ), k = 1, …, 4 , with signal power σk2 = R . Furthermore, each sensor is affected by some additive noise ni (t ) ∼ *5 (0, σi2 ), i = 1, …, N . The noise intensities σi2 are spatially uncorrelated and follow a log-normal distribution, as empirically observed in real data [18]. The time-domain observation at location ri is:
4
u i (t ) =
∑ k =1
⎛ |ri − ρk | ⎞ sk ⎜t − ⎟ ⎠ ⎝ c + ni (t ). ∥ ri − ρk ∥2
(19)
The signal-to-noise ratio is defined at a distance of 100 m to the source R as SNR = 2 , where P is the average noise power over all sensors. 100 P The simulated data is transformed into the Fourier domain, xi (m ), using (1). Fig. 6 shows an interpolated map of measured seismic power at 20 Hz over the array at SNR = 1. The simple localization of the sources by means of finding peaks in this map is prevented by the log-normally distributed noise power: it leads to many high power locations that are 115
Signal Processing 132 (2017) 110–120
N. Riahi, P. Gerstoft
Table 2 Fraction of sources enclosed by a cluster ellipse (source detection rate) based 500 Monte Carlo simulations (above) and average area spanned by the largest ellipse relative to the entire array area (bottom).
and α this can limit resolution as the clusters of two or even three distinct sources coalesce into one, occasionally losing some sources in the process (e.g. bottom right panel). High SNR and low α or low SNR and high α tend to create spurious clusters but mostly yield cluster ellipses that capture the true source locations. The clusters formed at low SNR are likely due to random fluctuations as discussed for a random graph in Section 2.4. From this visualization we can qualitatively infer that the method should be able to detect sources well at intermediate SNR . As discussed above the clusters can coalescence for high SNR and α . However, source clusters tend to be more highly connected near the location of their coherence-inducing source as opposed to periphery, especially if the number of nearest neighbors in the localization step, Eq. (10), is increased. In that case there is evidence that even coalesced clusters can be disentangled using graph analysis techniques of community detection [27–29]. The performance over 500 Monte Carlo simulations is quantified for SNR from 0.5 to 5 and four α values in Table 2. In each simulation there are four actives sources placed at random locations within the array, yielding a total of 2000 sources. We compute the fraction of these sources that are enclosed by the Ω (0.5) ellipse of any of the detected clusters (source detection rate). To capture how specific these detections are the area covered by the largest ellipse that occurred in the simulation is observed. Note that the source detection rate deteriorates for when moving to high SNR and α . This is attributed to the coalescence of several ellipses into one larger and more centered ellipse which can miss some sources as discussed earlier in Fig. 9. Once
Fig. 10. Fraction F of sensor pairs for which the null hypothesis is rejected at α = 0.01 versus sensor separation dij = ∥ ri − r j ∥2 (at 20 Hz). The data was taken from a 12 h period on March 10th 08.00–20.00 h. The shaded area indicates the 10–90 percentiles.
a cluster is identified further analysis, e.g. using matched-field processing on the largest clusters, could identify the source location more precisely or find several sources within the cluster.
5. Long Beach (CA) geophone array To demonstrate the above technique we apply it on a geophone array that was deployed over an area of 7 × 10 km in Long Beach (California, US) as part of an industrial seismic survey [18,30–34]. The dataset is purely observational and there is little ground truth available for it. For this reason, the following exposition will serve as a rough qualitative assessment of the technique. The array consisted of more than 5200 geophones (OYO CT32D vertical velocity sensors with 10 Hz corner frequency) sampling at a 116
Signal Processing 132 (2017) 110–120
N. Riahi, P. Gerstoft
Fig. 11. Connected components of the array graph are used to find coherent sensor clusters in the Long Beach geophone array. (A) The clusters at 20 Hz from four 10.2 s windows after 10:48 h on March 11th. The spatial extent of the clusters Ω (0.5) is indicated by dashed ellipses (12). (B) A North-to-South helicopter transect is captured in a sequence of coherent clusters at 47 Hz over consecutive analysis time periods (starting at 05.53 h). The colors change from red to blue as the analysis windows advance in time. The arrow points to the receiver from which the spectrogram (C) was computed around the time of increased coherence. Coordinates are given in the Universal Transverse Mercator (UTM) coordinate system. (For interpretation of the references to color in this figure caption, the reader is referred to the web version of this paper.)
of width 25 m. The average spacing is 110 m. For distance bin k (i.e., 0 < dij − k*25 < 25) the fraction of pairs that rejects the null hypothesis is computed:
Fk =
lij > cα} #{i , j in bin k|C #{i , j in bin k}
,
(20)
where #{} is the cardinality of the set. A high value of F thus indicates that the signals measured by receiver-pairs within a distance bin tend to be coherent. The process is repeated for all time segments from March 10th 08.00–20.00 h (all time indications are local time). Fig. 10 shows F versus receiver-pair distance for frequency 20 Hz. Its value, and thus coherence, is clearly elevated for shorter distances but reaches the level α = 0.01 at distance above about 400 m. This indicates that local coherent phenomena occur regularly in the data. As indicated in Section 2.1.2 the coherence must drop to zero for travel time differences above the analysis window length TW = 1.02 s. We can therefore give a rough estimate of average wave speed across the array as 400 m/1.02 s ≃ 400 m/s . Continuing with the coherence matrices at 20 Hz a localized array graph G (cα=0.01) is defined and all connected components are identified. Fig. 11A shows the coherent groups found over four consecutive 10.2 s analysis windows starting on March 11th, 10:48:48 h. For clarity, only clusters with more than nine vertices are shown in order to focus on larger phenomena. The period contains a 40 s stretch during which a seismic vibrotruck is known to have been operating in the Southeast of the array, which is confirmed by a cluster in that area. This source dominated over the background and was also broad-band (about 10– 80 Hz) and therefore corresponds to the type of source that was also detected with the energy-only approach reported in [18].
Fig. 12. The median effective diameter d eff of detected clusters versus time-of-day (Thursday, March 10th).
period of Δt = 4 ms (array configuration shown in Fig. 11A). For the most part the array had a quasi-regular layout with a relatively even spatial sampling. The ground velocity data stream of each geophone is transformed following (1) into a sequence of Fourier coefficients xi (m, f ) using Q = 256 samples (TW = 1.02 s) and a Hanning window wj with time lij (5) is computed windows overlapping by TW /2 . The coherence matrix C for 41 frequency bins from 9.8 to 48.8 Hz using M = 19 snapshots (TW /2 × (M + 1) = 10.2 s). A matrix with about 5200 2 ≈ 27·10 6 entries is therefore computed for every frequency bin and time period. In a 24 hour analysis period there are about 9400 time windows. First, an analysis of the spatial scale of coherence is performed. The receiver-pairs are grouped by spatial distance dij = ∥ ri − rj ∥2 into bins 117
Signal Processing 132 (2017) 110–120
N. Riahi, P. Gerstoft
Fig. 13. All clusters identified during March 10th in the frequency range 9.8–18.6 Hz (A) and 43.9–47.9 Hz (B). Each dot represents the center of a sensor cluster. Of those clusters 90% consist of less than 19 sensors, corresponding to 0.4% of array sensors.
regions in the map are highlighted. Region 1 contains several pump jacks and drill rigs while region 2 contains a central pump facility. Note how the spatial distribution of detections differs for the two bands. Region 3 highlights the area around the Long Beach convention center. The localizations there are much less scattered for the low-frequency band which may indicate that source in those frequencies are more stationary.
Fig. 11B shows a sequence of coherent groups at 47 Hz for consecutive windows starting March 11th at 05.53 h. They show a north–south transect over 6 km during the course of about 95 s. The average velocity along the trajectory is 60 m/s (134 mph). Fig. 11C shows a spectrogram from a receiver within the trajectory of the moving source computed around the time the coherence was observed. 60 60 The observed Doppler shifts of fhigh / flow ≃ 1.4 ≃ (1 + 340 )/(1 − 340 ) are consistent with the approximate velocity estimate. The narrow-band harmonics at multiples of 12 Hz suggest that the passage of a helicopter was captured. We perform the above analysis with the same parameterization for all frequency bins from 9.8 to 48.8 Hz for 24 h starting at 00.00 h on March 10th. For every detected coherent sensor cluster we store the mean of the coordinates (11), the area Ω (0.5) of the cluster ellipse, and the frequency and time at which the cluster is observed. More than 150,000 clusters satisfied the conditions given in Section 2.4 (more than four vertices and more than five edges) for the analyzed time period and frequency bands. Only a small fraction these are false detections and they should be scattered randomly on the map. Fig. 12 shows the median diameter d eff Eq. (13) versus time of day. The diameters are typically in the range 200–300 m but increase significantly between midnight and 5am for the higher frequency clusters (44–48 Hz). We speculate that this may be due to fewer noise sources at higher frequencies during the night which would increase the SNR and hence the cluster diameter. Another possibility is that downward refracting atmospheric propagation conditions, which are more common at night, were causing signals to propagate farther at those particular frequencies. The maps in Fig. 13 show the geographic location of the identified cluster centers for the 24 h period in the frequency bands 9.8–18.6 Hz and 43.9–47.9 Hz, each containing 10 frequency bins. Three particular
6. Conclusion We have proposed a model-free technique that can approximately localize weak sources within dense arrays. The approach requires that source signals exhibit significant coherence only over a small distance within the array. The support of the array coherence matrix is reinterpreted as a connectivity matrix of a graph with sensors as vertices. For the long observation times we show that non-overlapping clusters in this graph indicate sensor groups that are affected by a common source. The area spanned by these clusters can therefore serve as a location estimate. The support of the covariance matrix is estimated from short-time coherence estimates combined with a nearest neighbor approach. The latter prevents large clusters in the graph from forming by chance. The method was verified on simulated data from a dense array with 2.8 km × 2.8 km aperture and sensor spacing of 100 m containing four simultaneously emitting sources. For signals with SNR = 2 at 100 m from the source the retrieved localization areas have a diameter of about 2–3 times the sensor separation (200–300 m). For higher SNR this diameter increases which limits resolution as the clusters of nearby sources tend to coalesce. Applied on a real data example from a 7 km × 10 km seismic array with 100 m sensor separation, the method 118
Signal Processing 132 (2017) 110–120
N. Riahi, P. Gerstoft
Inc. for sharing the data, in particular the efforts of Dan Hollis and Robert Clayton. This work is supported by NSF grant no. EAR-0944109 and by the Swiss National Science Foundation.
reveals anthropogenic source details such as a helicopter transect and oil production facilities. Acknowledgments The authors thank NodalSeismic LLC and Signal Hill Petroleum
Appendix A. Connected components and the connectivity matrix Let G be a graph with N vertices and let U k ∈ G, k = 1, …, K be sub-graphs that do not overlap, U k ∩ U l = ∅, ∀ k ≠ l . Define the indicator vector of the vertices in U k as (an italic index i denotes the i -th vertex of G):
uk = [u1k , …, uNk ]T
⎧1 if i ∈ U k where uik = ⎨ ⎩ 0 if i ∉ U k
(A.1)
The following statements are equivalent: 1. The graph G has K (and only K ) connected components U k that are not connected with each other, i.e. eij = 1 only if i , j ∈ U k . K 2. E has a support that is equal or smaller than ∑k =1 ukuk T . Sketch of proof:. Consider first the fully connected case, i.e. uik = 1 ∀ i ∈ U k . If the first statement is true, then uik ujk = 1 if i , j ∈ U k or 0 otherwise. K
But this means that Eij = ∑k =1 uik ujk > 0 only if i , j ∈ U k for some k and the second item is true. The other direction follows a similar logic. Because the fully connected component contains all possible edges within a set of vertices any lesser connected components will contain a subset of those edges, i.e. the connectivity matrix can only have fewer non-zero values.□ Appendix B. Algebra on indicator vectors Define the support indicator function of a vector v ∈ N :
vl = 0(v)
⎧1 if vi ≠ 0 where vli = ⎨ ⎩ 0 if vi = 0
(B.1)
and analogously an indicator function 0(V) for a matrix V . We then have:
llT 0(vw H ) = vw
(B.2)
0(a v) = vl
(B.3)
(for a ≠ 0)
l+W m − (V l ○W m), 0 ( V + W) = V
(B.4)
where ○ is the Hadamard operator (element-wise multiplication) and assuming we do not have Vij = −Wij ≠ 0 . Assume that the supports of v and w l = 0 , the zero-vector. Therefore do not overlap, i.e. vl○w
llT )○(ww llT ) = (vl○w l)(vl○w l)T = 0 (vv
(B.5)
is the zero matrix and consequently, from Eqs. (B.4) and (B.5)
llT + ww llT − (vv llT ○ww llT ) = vv llT + ww llT . 0(vv H + ww H ) = vv
(B.6)
In other words, if the support of vectors v and w do not overlap, then the support of the sum of their outer products is simply the sum of the outer products of their support-indicators.
[10] M. Corciulo, P. Roux, M. Campillo, D. Dubucq, W.A. Kuperman, Multiscale matched-field processing for noise-source localization in exploration geophysics, Geophysics 77 (5) (2012) KS33–KS41. http://dx.doi.org/10.1190/geo20110438.1. [11] M.A.H. Hedlin, D. Drob, K. Walker, C. de Groot-Hedlin, A study of acoustic propagation from a large bolide in the atmosphere with a dense seismic network, J. Geophys. Res.: Solid Earth 115 (B11), 2010. [12] K.T. Walker, R. Shelby, M.A.H. Hedlin, C. de Groot-Hedlin, F. Vernon, Western U.S. infrasonic catalog: illuminating infrasonic hot spots with the USArray, J. Geophys. Res.: Solid Earth 116 (B12). [13] D.F. Gingras, P. Gerstoft, N.L. Gerr, Electromagnetic matched-field processing: basic concepts and tropospheric simulations, IEEE Trans. Antennas Propag. 45 (10) (1997) 1536–1545. [14] P. Valtr, P. Pechac, V. Kvicera, M. Grabner, Estimation of the refractivity structure of the lower troposphere from measurements on a terrestrial multiple-receiver radio link, IEEE Trans. Antennas Propag. 59 (5) (2011) 1707–1715. [15] J. Capon, High-resolution frequency–wavenumber spectrum analysis, Proc. IEEE 57 (8) (1969) 1408–1418. [16] R.O. Schmidt, Multiple emitter location and signal parameter estimation, IEEE Trans. Antennas Propag. 34 (3) (1986) 276–280. http://dx.doi.org/10.1109/ tap.1986.1143830.
References [1] R.A. Kerr, Geophysical exploration linking deep earth and backyard geology, Science 340 (6138) (2013) 1283–1285. [2] H.P. Bucker, Use of calculated sound fields and matched-field detection to locate sound sources in shallow water, J. Acoust. Soc. Am. 59 (2) (1976) 368–373. [3] A. Baggeroer, W. Kuperman, P. Mikhalevsky, An overview of matched-field methods in ocean acoustics, IEEE J. Ocean. Eng. 18 (4) (1993) 401–424. http:// dx.doi.org/10.1109/48.262292. [4] J.C. Chen, K. Yao, R.E. Hudson, Acoustic source localization and beamforming: theory and practice, EURASIP J. Adv. Signal Process. 2003 (4) (2003) 1–12. [5] A. Beck, P. Stoica, J. Li, Exact and approximate solutions of source localization problems, IEEE Trans. Signal Process. 56 (5) (2008) 1770–1778. [6] J.F. Claerbout, Toward a unified theory of reflector mapping, Geophysics 36 (3) (1971) 467–481. [7] G. McMechan, Migration by extrapolation of time-dependent boundary values, Geophys. Prospect. 31 (3) (1983) 413–420. [8] P.M. Shearer, Global seismic event detection using a matched filter on long-period seismograms, J. Geophys. Res.: Solid Earth 99 (B7) (1994) 13713–13725. [9] D.B. Harris, T. Kvaerna, Superresolution with seismic arrays using empirical matched field processing, Geophys. J. Int. 182 (3) (2010) 1455–1477.
119
Signal Processing 132 (2017) 110–120
N. Riahi, P. Gerstoft
EURASIP J. Adv. Signal Process. 2003 (4) (2003) 1–7. [27] M.E.J. Newman, Finding community structure in networks using the eigenvectors of matrices, Phys. Rev. E 74 (2006) 036104. http://dx.doi.org/10.1103/ PhysRevE.74.036104. [28] S. Fortunato, Community detection in graphs, Phys. Rep. 486 (3–5) (2010) 75–174. [29] S. Sobolevsky, R. Campari, A. Belyi, C. Ratti, General optimization technique for high-quality community detection in complex networks, Phys. Rev. E 90 (2014) 012811. [30] F.-C. Lin, V.C. Tsai, B. Schmandt, Z. Duputel, Z. Zhan, Extracting seismic core phases with array interferometry, Geophys. Res. Lett. 40 (6) (2013) 1049–1053. http://dx.doi.org/10.1002/grl.50237. [31] B. Schmandt, R.W. Clayton, Analysis of teleseismic p waves with a 5200-station array in Long Beach, California: evidence for an abrupt boundary to inner borderland rifting, J. Geophys. Res.: Solid Earth 118 (10) (2013) 5320–5338. [32] D. Bowden, V. Tsai, F. Lin, Site amplification, attenuation, and scattering from noise correlation amplitudes across a dense array in Long Beach, CA, Geophys. Res. Lett. 42 (5) (2015) 1360–1367. [33] N. Nakata, J.P. Chang, J.F. Lawrence, P. Boué, Body wave extraction and tomography at Long Beach, California, with ambient-noise interferometry, J. Geophys. Res.: Solid Earth 120 (2) (2015) 1159–1173. [34] J.P. Chang, S.A.L. de Ridder, B.L. Biondi, High-frequency Rayleigh-wave tomography using traffic noise from Long Beach, California, Geophysics 81 (2) (2016) B43–B53.
[17] D. Li, Y.H. Hu, Energy-based collaborative source localization using acoustic microsensor array, EURASIP J. Adv. Signal Process. 2003 (4) (2003) 985029. http://dx.doi.org/10.1155/S1110865703212075. [18] N. Riahi, P. Gerstoft, The seismic traffic footprint: tracking trains, aircraft, and cars seismically, Geophys. Res. Lett. 42 (8) (2015) 2674–2681. http://dx.doi.org/ 10.1002/2015gl063558. [19] D.I. Shuman, S.K. Narang, P. Frossard, A. Ortega, P. Vandergheynst, The emerging field of signal processing on graphs: extending high-dimensional data analysis to networks and other irregular domains, IEEE Signal Process. Mag. 30 (3) (2013) 83–98. [20] A. Sandryhaila, J.M. Moura, Big data analysis with signal processing on graphs: representation and processing of massive data sets with irregular structure, IEEE Signal Process. Mag. 31 (5) (2014) 80–90. [21] U. von Luxburg, A tutorial on spectral clustering, Stat. Comput. 17 (4) (2007) 395–416. http://dx.doi.org/10.1007/s11222-007-9033-z. [22] W.H. Press, Numerical Recipes: The Art of Scientific Computing, 3rd ed., Cambridge University Press, Cambridge, UK; New York, 2007. [23] A.D. Chave, D.J. Thomson, M.E. Ander, On the robust estimation of power spectra, coherences, and transfer functions, J. Geophys. Res.: Solid Earth 92 (B1) (1987) 633–648. [24] M.E. Newman, The structure and function of complex networks, SIAM Rev. 45 (2) (2003) 167–256. [25] S.E. Schaeffer, Graph clustering, Comput. Sci. Rev. 1 (1) (2007) 27–64. [26] D. Friedlander, C. Griffin, N. Jacobson, S. Phoha, R.R. Brooks, Dynamic agent classification and tracking using an ad hoc mobile acoustic sensor network,
120