the Weibull function utilizes the shape, shift, and scale parameters to describe the ... probability distribution performs better than the occurrence-based fingerprint ...
Journal of Global Positioning Systems (2010) Vol.9, No.2 :122-130 DOI: 10.5081/jgps.9.2.122
Using Inquiry-based Bluetooth RSSI Probability Distributions for Indoor Positioning Ling Pei, Ruizhi Chen, Jingbin Liu, Heidi Kuusniemi, Tomi Tenhunen, Yuwei Chen Department of Navigation and Positioning, Finnish Geodetic Institute, FGI, Masala, Finland
Abstract Fingerprinting is a common technique for indoor positioning using short range Radio Frequency (RF) technologies such as Wireless Location Area Network (WLAN) and Bluetooth (BT). It works in two phases: The first phase is a data training phase in which a radio map for the targeted area is generated in advance, while the second phase is the real-time location determination phase using the radio map. Considering the work amount for generating the radio map, only a few samples of the Radio Signal Strength Indicator (RSSI) are typically collected at each reference point. The limited samples are not able to represent the real signal distribution well in the conventional fingerprint approach such as in an occurrence-based solution. This paper presents a new solution using the Weibull function for approximating the Bluetooth signal strength distribution in the data training phase. This approach requires only a few RSSI samples to estimate the parameters of the Weibull distribution. Compared to the occurrence-based solution, the Weibull function utilizes the shape, shift, and scale parameters to describe the distribution over the entire RSSI domain. This study indicates that the reliability and accuracy of the fingerprint database is improved with the Weibull function approach. A Histogram Maximum Likelihood position estimation based on Bayesian theory is utilized in the positioning phase. The test results show that the fingerprinting solution using the Weibull probability distribution performs better than the occurrence-based fingerprint approach. Keywords: Bluetooth, indoor positioning, RSSI, fingerprint, Baysian estimation _____________________________________________ 1.
Introduction
Location-based Service (LBS) is now becoming one of the standard features in mobile devices. More and more research concentrates on the personal navigation for both outdoor and indoor environments. However, Global Navigation Satellite System (GNSS) technologies are still struggling for indoors due to the unavailability or
attenuation of the GNSS signals. There are many radio technologies such as cellular networks, Wireless Local Area Network (WLAN), and Bluetooth (BT) that are now adopted for indoor positioning without modifying neither the user terminals, nor the existing infrastructure. Radio Signal Strength Indicator (RSSI), a standard measure in most radio technologies, has attracted a lot of attentions (Bahl & Padmanabhan, 2000 and Ekahau Inc.) for being adapted as measurements in indoor positioning. Bluetooth is a technology with low power consumption for short-range wireless data and voice communication (Muller, 2001). It has been utilized in the communication and proximity market (Naya et al., 2005) for a long time. As widely supported by mobile devices, Bluetooth is a potential technology to become an alternative for indoor positioning (Simon & Robert, 2009, Anastasi et al., 2003, Bargh & Groote, 2008, Jevring & Groote, 2008, Huang, 2005, Bruno & Delmastro, 2003, Hallberg et al., 2003, and Pandya et al., 2003). The effective range of the radio signal of a class 1 Bluetooth device (e.g. the Bluegiga Access Point(AP) 3201) is up to 200 meters, while that for the class 2 device (e.g. the Bluetooth module in a smart phone) is about 20-30 meters according to the specifications of Bluetooth 2.0 (Specification of the Bluetooth System, Core Specification v2.0+EDR, 2004). Bandara et al. (2004) developed a multi-antenna Bluetooth AP for location estimation based on RSSIs. The test obtained 2 meters of error in a 4.5m x 5.5m area with four antennas. Sheng and Pollard (2006) modified the Bluetooth standard to estimate the distance between a reference transmitter and a mobile receiver, using RSSI measurements and a line-of-sight radio propagation model within a single cell. The high-density Bluetooth infrastructure is necessary to acheive an accurate position in the above two approaches. In order to minimize the Bluetooth infrastructure, Damian et al. (2008) used only one class 1 Bluetooth AP for a home localisation system, which combined the measurements of the link quality, RSSI, and celluar signal quality to obtain room-level accuracy. In this paper, we present a Bluetooth locating solution in a reduced Bluetooth infrastructure area by using RSSI only.
Pei, et al.: Using Inquiry-based Bluetooth RSSI Probability Distributions for Indoor Positioning 123
2.
The RSSI Measurement
Bluetooth
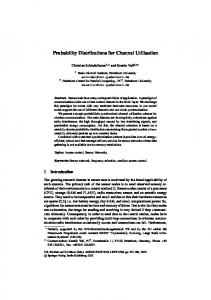
There are two types of possible solutions for acquiring the Bluetooth RSSI measurements: the connection-based solution and the inquiry-based solution (Naya et al., 2005). In the connection-based solution, a communication connection between an AP and a mobile phone is needed to establish before carrying out the RSSI measurements. The RSSI measurements can be updated at a frequency of 1 Hz via the established communication channel. However, APs might continually adjust the transmission power of the communication link to reduce the transmission errors and save the energy. The transmission power adjustment makes it impossible to use the RSSI measurement to infer the distance between a mobile phone and an AP. Nevertheless, this is not the case for the inquiry-based solution because it retrives the RSSIs from the inquiry response that utilizes static transmission power instead of the adjustable one. Therefore, the RSSI measurements of the inquiry-based solution reflect the distances between the mobile devices and APs. After the above analyzing, the inquiry-based solution is adopted in our study even though the RSSI update frequency is lower than that of the connection-based solution. As shown in Figure 1, the components of the proposed inquiry-based Bluetooth locating system in this paper consist of two parts: the Bluetooth network and mobile phones. The server connected with several APs over a WLAN/Ethernet network is responsible for the system kernel functions, especially positioning calculations. The APs are synchronized by the Server when inquiring the mobile phones in their surroundings and relay the positions from the Server to mobile phones. Whenever RSSI measurements are needed for positioning, the server will send a trigger to all APs to scan the mobile devices in their surroundings. Mobile device might be miss-detected for three reasons: 1) The time or frequency domain between the mobile device and AP does not overlap during the inquiring process; 2) the mobile device is waiting to answer the inquiry from another AP. One mobile device can only answer one AP at a time; and 3) the inquiring process times out without obtaining a successful measurement for a reason e.g. that the communication between the AP and the corresponding mobile phone is blocked. The probability of being miss-detected for each device will increase when the number of participating APs increases (Peterson et al., 2006a) as shown in Table 1. The occurrence of the miss-detected cases will decrease the number of RSSI measurements in a certain sampling duration.
WLAN/Ethernet
Server Mobile Phone Access Point
Mobile Phone Access Point
Mobile Phone Access Point Mobile Phone
Figure 1: System components of the inquiry-based Bluetooth indoor locating system. Table 1. Rates of missed-detection Number of Missed-detection Rate participating APs After 6.4 s 1 0% 2 7.5% 3 8.3% 6 8.9% Having completed the inquiring task, all APs will send the RSSI measurements back to the server either for the purpose of calculating the current positions of the mobile devices or generating the radio map database. 3.
Fingerprinting with RSSIs
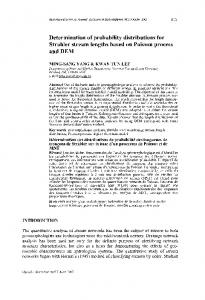
As mentioned above, fingerprinting with RSSIs consists of two phases: the data training phase and the positioning phase as shown in Figure 2. The training phase includes the steps of obtaining a radio map for the targeted area based on a RSSI training data set, while the positioning phase includes the steps of finding a location based on the fingerprints stored in the radio map. For the data training phase, the targeted area is divided into cells. The center of the each cell is considered as a reference point. The coordinates of the reference points (x n , y n ) are determined in advance. The RSSI measurements at each reference point from all “visible” APs are collected and stored as fingerprints in the database of the radio map.
Pei, et al.: Using Inquiry-based Bluetooth RSSI Probability Distributions for Indoor Positioning 124
D = [R1 , R2 ,..., Rw ]
(3)
where w is the maximum number of the reference points in the radio map. To speed up the computation process, a bin-based solution is adopted. The signal strength distribution is divided into p bins. The fingerprints for the i-th reference point can be redefined as P( A1 B1 | Ri ) P( A2 B1 | Ri ) P( A B | R ) P( A B | R ) 1 2 i 2 2 i Ri = P( A1 B p | Ri ) P( A2 B p | Ri )
Figure 2: Two phases for Bluetooth positioning
P( Ak B1 | Ri ) P( Ak B 2 | Ri ) (4) P( Ak B p | Ri )
During the positioning phase, the unknown coordinates (x u , y u ) of a mobile device are estimated by matching the snap shot of the current RSSI measurements to the fingerprints stored in the radio map (Youssef et al., 2003 and Roos et al., 2002).
In the conventional occurrence-based solution, at the i-th reference point, the probability of the RSSI measurements within the bin Bn for AP Am can be expressed as
3.1 Fingerprint Database At each reference point, the RSSI probability distributions of all APs are stored. If we denote the fingerprint for the i-th reference point as Ri , then, we have
P( Am Bn | Ri ) =
P ( A1O1 | R i ) P ( A2 O1 | R i ) P( A O | R ) P( A O | R ) 1 2 i 2 2 i Ri = P ( A1Ov | Ri ) P( A2 Ov | Ri )
P ( Ak O1 | Ri ) P ( Ak O 2 | Ri ) (1) P( Ak Ov | Ri )
where A stands for the AP, while O refers to the RSSI measurement. In the conventional fingerprinting approach, the probability of a RSSI measurement On between the reference point
Ri and the AP Am can be expressed as
P( Am On | Ri ) =
C On Ni
(2)
where CO is the number of occurrences that the RSSI n
measurement On appeared in the training data set of the i-th reference point. Here N i is the total number of training samples collected at the i-th reference point. The entire fingerprint database is expressed as
j < En
CO j
j ≥ En −1
Ni
∑
(5)
Where E n −1 and E n are the left and right edges of bin
Bn respectively. C O j stands for the number of occurrences that the value of the RSSI measurement appeared within the range of E n −1 , E n ) . All the RSSI
[
measurements in the bin Bn are cumulated for counting the occurance probability. 3.2 Modelling Fingerprints with the Weibull Function The bin-based solution requires a large training data set in order to obtain a good estimate of the RSSI probability distribution. In this paper, we introduce the Weibull function to proximate the RSSI probability distribution. The Weibull function is a traditional method for modelling the signal strength of radio propagation (Sagias & Karagiannidis, 2005). The probability density function can be expressed as
k x − θ k −1 −( xλ−θ ) k ) e ,x ≥θ ( f ( x) = λ λ 0, x


![Percentile Methodology for Probability Distributions [PDF]](https://m.moam.info/img/260x300/percentile-methodology-for-probability-distributio_6479b9de098a9e525c8b4621.jpg)