Using Low-Rate Flow Periodicities for Anomaly Detection: Extended ISI-TR-661, August 5th, 2009 Genevieve Bartlett
John Heidemann
Christos Papadopoulos
USC/ISI Marina del Rey, CA
USC/ISI Marina del Rey, CA
Colorado State University Fort Collins, CO
[email protected]
[email protected]
[email protected]
ABSTRACT
matic communication include automatic application or reporting of updates to the operating system or applications and automated tracking of information for later consumption, such as RSS feeds, aggregator polling for new feeds and auction bots checking the current status of an auction. Finally, long-running applications such as peer-to-peer file sharing coordinate periodically to share data and maintain an overlay network. While much of this automatic communication is beneficial to users, not all automatic communication is necessarily desirable. Some applications may share more information than a user may prefer, such as web assistants that report the user’s click-stream to advertisers. Other applications inject ads into user activities, periodically polling their controlling sites for updates and new ad content. Finally, compromised computers are connected by increasingly sophisticated control networks, often operating over decentralized, peer-to-peer schemes to form botnets of hundreds of thousands of computers. Frequently, hidden communication is periodic and happens at timescales of minutes to hours. Application and OS updates often happen at a regular interval set by the vendor or user, usually from hourly to weekly. Applications which poll for new information do so on a periodic basis. For example, web sites such as cnn.com use a refresh HTML directive to cause web browsers to reload the page each half-hour. For one-time communications, such as reports of a new operating system or application installation, personal firewalls such as ZoneAlarm often alert users to some of this non-user-driven communication. For behind-the-scenes periodic communication however, a personal firewall does not typically alert a user every time the communication occurs, and such alerts would be quickly ignored if they could not be correlated with an activity. This paper presents a new approach to understand low-rate, periodic communication of network flows. By low-rate, we mean communication that occurs every
As desktops and servers become more complicated, they employ an increasing amount of automatic, non-user initiated communication. Such communication can be good (OS updates, RSS feed readers, and mail polling), bad (keyloggers, spyware, and botnet command-and-control), or ugly (adware or unauthorized peer-to-peer applications). Communication in these applications is often periodic but infrequent, perhaps every few minutes to few hours. This infrequent communication and the complexity of today’s systems makes these applications difficult for users to detect and diagnose. We show that there are several classes of applications that show low-rate periodicity and demonstrate that they are widely deployed on public networks. In this paper we present a new approach to identify changes in low-rate periodic network traffic. We employ signal-processing techniques, using discrete wavelets implemented as a fully decomposed, iterated filter bank. This approach allows us to cover a large range of low-rate periodicities, from seconds to hours, and to identify approximate times when traffic changed. Network administrators and users can use our techniques for network- or self-surveillance. To measure the effectiveness of our approach, we show that it can detect changes in periodic behavior caused by events such as installation of keyloggers, an interruption in OS update checks, or the P2P application BitTorrent. We quantify the sensitivity of our approach, showing that we can find periodic traffic when it is at least 5–10% of overall traffic.
1. INTRODUCTION As systems become more complicated, system maintenance and inter-machine coordination has become increasingly automated. As a result of this automation, communication is no longer strictly driven by user actions. Instead, computer-initiated communication is now common. Such automatic network communication means that users are increasingly unaware of with whom and when their machine communicates, and what information is being shared. Positive examples of this auto1
few minutes, hours, or days. By periodic, we mean new connections which occur at relatively fixed intervals. We show that such traffic is common in classes of both wanted and unwanted applications, and that these applications are widely present on computers today (Section 6.5). Finally, we show that we can identify changes in periodic behavior that can indicate the presence of malware or termination of automatic updates (Section 6.3). Our contribution is three-fold. First, we identify lowrate periodicity as a phenomena in network traffic (Section 5). Second, we develop a novel method for detecting low-rate periodic signals in network traffic using flow-level periodicity and full wavelet expansion (Section 4). Although wavelets have been widely used for compression [21], and have been sometimes applied to traffic [2,6,13], we are the first to apply full expansion to detection of very low-rate periodic traffic. We show how our approach works (Section 6.1) and quantify its sensitivity to background traffic (Section 6.2). Finally, we show how detecting changes in periodic communication can help protect users against unwanted and malicious applications (Section 6.3), for a range of applications that are pervasive in today’s networks (Section 6.5).
tifying low-rate periodicity in applications and changes in such behavior, not general characteristics of aggregate traffic. Host-based malware detection represents another class of application-detection schemes related to our work. Tools such as virus- and spyware scanners run locally on a host and use signatures specific to each malware program to either identify unwanted files on the local system or unwanted incoming downloads. Part of our work looks at detecting new installations of programs such as keyloggers and adware, but unlike typical malware detection, we are the first to look at general network behavior to identify some of these applications.
2.2
Spectral Analysis
Recent research has applied spectral techniques to identify network anomalies, and study network characteristics such as routing and congestion. Current application of spectral techniques look for high-frequency occurrences to identify anomalous behavior [2, 4, 11, 16]. Hussain et al. apply spectral techniques to timeseries of packet arrival times. Based on spectral characteristics, they are able to distinguish between single- and multi-source attacks [11], and identify repeat attacks [12]. Barford et al. use wavelets to analyze SNMP and flow-level information to identify DoS attack and other high frequency anomalies [2]. Magnaghi et al. detect anomalies within TCP flows using a wavelet-based approach to identify network misconfigurations [16]. Spectral techniques have also been employed to to identify bottleneck links [8, 9] and routing information [20]. We differ from previous work in three main ways. First, the majority of spectral analysis in computer networks studies events at the packet level. Our work looks at periodicity between flows — not within a flow — to identify hosts which maintain regular contact. Second, most prior work considers high frequency behavior; we instead consider events which occur at much lower frequencies (sub-1Hz) and use long observation windows (hours to days) to see such events. Lastly, our application of full decomposition of iterated filtering differs from previous network applications of spectral analysis. Finally, there has been some work exploring general approaches to applying signal processing to network traffic [18]. Our work represents a specific instance of this approach as applied to low-rate periodicity.
2. RELATED WORK Our work builds on two general areas of related work: network-based detection of application and classification, and the application of spectral techniques to network traffic.
2.1 Application Detection There are several ways to detect applications in the network or on the host. Port and payload-based signature detection is widely used to identify applications and classify traffic. Although widely used in intrusion detection systems and traffic classification system today, port assignments can be easily changed and payload can be encrypted or randomized. An alternative to such signature-based schemes is identification of behaviors unique to specific applications, such as patterns of communication with other computers. Examples of such schemes include work by Karagiannis et al. [14, 15], Constantinou and Mavrommatis [5], and Bartlett et al. [3] where behaviors such as port usage, protocol usage and number of connections made aid in classifying traffic. Our work also looks at network behavior to identify applications; however, we look at the previously unexplored behavior of low-rate periodic communication. Another class of network-based detection tools identify traffic anomalies. These systems characterize normal traffic and then watch for unexpected divergence using traffic entropy [7,19] or through signal-processing techniques [2]. Unlike this prior work, we focus on iden-
3.
BACKGROUND
At the core, our work focuses on identifying and separating a periodic network behavior, the signal, from other network traffic, noise. We show that important kinds of traffic show periodic behavior, providing the signal. The fields of signal processing and detection theory provide decades of research to build upon; we ex2
2B
B
B
4B
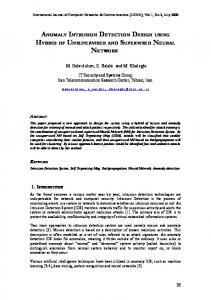
Each pass with a high and low-pass filter pair splits the frequency spectrum roughly in half, decomposing the signal. The resulting set of wavelet coefficients contain both time and frequency information. Thus iterated application (Figure 1(c)) produces a particular split of frequencies (Figure 1(a)). The filter bank in Figure 1(c) is widely used in image compression. However, other configurations are possible. The filter bank in Figure 1(d) selects a different set of frequencies (Figure 1(b)). With very low-rate periods, this ability to “focus in” on the important parts of frequency domain and ignore less interesting parts has potential to improve performance.
f
(a) Frequency split from fil- (b) Frequency split from filters in Figure c ters in Figure d Original Data L L
H H
L
H
B
B
Original Data
2B
4B
L
H
L 2B
H
4B
L
H
B
B
(c) Filters resulting in Fig- (d) Filters ure a Figure b
resulting
in
4.
METHODOLOGY
As just described, wavelets and iterated filter banks are a useful mechanism to identify periodicity in traffic. Although wavelets provide a well developed mathematical theory, and there has been some work applying them to network traffic before, discovering infrequent periodic traffic is particularly demanding because of the long-timescales involved. In this section we describe the four main parts of our approach (roughly following the outline of applying signal processing to networking [18]): extracting a timeseries of events from network traffic, decomposing the timeseries using an iterated filter bank, visualizing the resulting multi-resolution representation, and detecting the presence of a periodic signal. Our focus on long-timescales influences each of these steps.
Figure 1: Filter bank implementation and resulting split in the frequency domain. tend this work to develop processing techniques specific to our application, and to show that those techniques can successfully detect low-rate periodic activities in aggregate Internet traffic. Both Fourier and wavelet analysis are widely used to study periodicity in signals. We choose wavelets analysis for two reasons. First, it is well suited to analyzing non-stationary signals with low signal-to-noise events. The wavelet transform represents complicated signals as a function of wavelets [24]. Each wavelet is a version of a basis function, possibly scaled in space or translated in time. We use the Haar wavelet as our basis function. The discrete Haar wavelet is: i=0 1 −1 i=1 ψ(i) = 0 otherwise
4.1
Timeseries Extraction
To apply signal processing to network traffic we first must generate a timeseries of events that represent network traffic [18]. We begin by discarding all traffic that is not of interest, then map events of interest into a fixed-interval timeseries of events per time period. Our first step is to subset traffic. As we show later (Section 6.2.2), the signal-to-noise ratio governs our ability to detect behavior of interest. Any irrelevant traffic we can discard decreases the rate of background noise, improving our sensitivity. Exactly what can be discarded depends on the application, and we use different rules in different cases. In general, we consider all TCP flows, but as one example, when searching for malware that is known to be sent over web connections, we could discard all traffic other than TCP connections to port 80. Next, we define an event of interest. We are interested in long-duration interactions, so we monitor TCP flows rather than individual packets. The arrival of a SYNACK packet in the input packet stream defines the time of an event denoting a new TCP flow. (We use SYNACK since it indicates a complete three-way handshake with two active parties.) Malicious traffic with forged
Our choice of Haar as our basis function is motivated by both theoretical and practical factors. Mathematically, the simple square shape of the Haar wavelet is a good match for the sharp changes that occur when new connections are represented as unit impulses. Practically, the Haar wavelet admits a very simple and fast implementation where all operations are differencing or averaging. Although we find Haar a good match, exploration of alternative wavelets is potential future work. The second reason we chose wavelets is that they let us focus on frequency or time, or some combination of both. We use their ability to focus on frequency to indicate the presence or absence of periodic traffic (Section 6.1), and their temporal resolution to identify when that traffic starts and stops (Section 6.3). Discrete wavelets are scaled and translated only in discrete steps. One helpful way to view wavelets is as iterated filter banks, where a single wavelet acts as a band-pass filter, and scaling is in effect a low-pass filter. 3
SYN-ACK packets may taint this data, but is unlikely to show long-term periodicity and so does not alter our results. After extracting and sampling events, we create a timeseries covering the duration of analysis. We use fixed-duration bins, and count the number of new connection events per bin. Since our target events are infrequent (minutes or hours apart), we study durations of at least 18 to 96 hours so we observe multiple instances of an event. We use a bin size of 1s, chosen to support a large range of periods (from several seconds to several hours). We must pick a sampling rate high enough to keep enough precision for high frequency events, but low enough to avoid excess filtering.
B
B
B
B
B
B
B
f
(a) Frequency split from filters in Figure b Original Data L
H
L
H
H
L
L
H
H
L
L
H
H
L
B
B
B
B
B
B
B
B
(b) Filters resulting in Figure a
4.2 Multi-resolution Analysis
Figure 2: Full decomposition of a filter tree, with “flip” in covered frequency bands.
The timeseries provides observations from the network, but our goal is to find periodic behavior in those observations. In Section 3 we described how discrete wavelets can be implemented as an iterative filter bank. Figure 3 showed who different combinations of filters can focus attention on different portions of the frequency spectrum. That figure illustrates two different filter configurations that extract particular bands. Using a different path through the filter tree, efficiently gives more resolution in a target frequency range. This ability to “focus in” on a range is useful if the target range is know a priori. However, in our work we do not have a pre-determined, specific range of frequencies we are interested in. Instead, we want to look for all possible low-rate periods— anything from a period of a few seconds to a few hours may be of interest. If we consider all the combinations of low- and high-pass filters, the full set can be viewed as a complete binary tree, which we will refer to as a filter tree. Therefore, we perform a full decomposition, and use all paths through the filter tree. Figure 2 shows a filter bank configured for a full decomposition and the logical frequency bands we extract. Although wavelets are a relatively mature analytic approach, to our knowledge, we are the first to use a full decomposition to simultaneously explore large ranges of frequencies in network traffic. Full decomposition requires multiple operations on a single timeseries and appears quite expensive. We employ two optimizations that make our analysis quite efficient. First, because we use the Haar wavelet as our basis function, we can employ simple differencing and averaging implementations of our high- and low-pass filters. Given timeseries X, we get XH =
B
xn−1 + xn x1 + x2 x3 + x4 x5 + x6 , , , ..., 2 2 2 2 Second, we cease to expand nodes in certain cases, which significantly reduces the total number of filtering operations we perform. We discuss this optimization in Section 4.6. The duration of the original timeseries, and the sampling rate determine the number of levels we can expand. XL =
4.3
Periodic Events and Energy
Given a multi-scale decomposition of observations, we must determine how to identify periodic events. The wavelet coefficients define the energy for a given timeseries X at some path P in the decomposition tree: e(X P ) ≡ ss(X P L ) + ss(X P H ) n X x2i ss(X) ≡ i=0
A concentration of energy in a narrow frequency range indicates the presence of a periodic signal. We show how we use energy to automate detection in Section 4.5.1. One benefit of the Haar wavelet is that energy is conserved at each level of decomposition, e(X) = e(X L ) + e(X H ). We can therefore normalize energy and evaluate the energy of each decomposition as a percentage of total energy. Finally, it is possible to undershoot or overshoot a given frequency in the filter tree. With insufficient levels of decomposition, energy is spread uniformly across large frequency ranges. With excessive decomposition, imperfections in real-world periods cause traffic is dispersed across several ranges. These constraints again motivate our desire to adaptively expand the tree until
x2 − x1 x4 − x3 x6 − x5 xn − xn−1 , , , ..., 2 2 2 2
and 4
appear. While we use visualization to observe a decomposition and assist our intuition, differences can be subtle, particularly in real data and when traffic with different periods is mixed. We therefor next present a quantitative detection method.
4.5
Energy and Frequency to Detection
We have shown how periodic events correspond to energy (Section 4.3), and how to relate that energy to frequencies (Section 4.4). We now combine these to describe our detection algorithm, exploiting the temporal structure of wavelets to identify the start and stop times of a periodic behavior.
Figure 3: Perfect artificial period of 8s (window aligned).
4.5.1
Detection
We detect events by comparing the energy in a given frequency range to an energy threshold. Energy from non-periodic events will disperse as we perform further decomposition, and narrow in on smaller and smaller frequency ranges. Conversely, energy from periodic events will remain concentrated around a specific frequency throughout decomposition. Therefore, to identify a periodic set of events, we must look for strong energy in a narrow range of frequencies. We ignore detections when the frequency range is too wide. A range is narrow enough to consider detection if the range of periods covered is within a set percentage of its center period. From low to high frequency nodes we linearly decrease this percentage from 10% to 1%. This relaxes the definition of “wide” for lower frequencies, since we expect lower frequency periods to have more jitter (a few seconds of jitter on a half-hour period is not as significant as a few seconds off on a 5 second period). Our energy threshold is dependent on where in the filter tree we are making a detection decision. Further down in the tree at higher levels of decomposition, we lower the energy threshold since each bin represents a narrower frequency band and overall energy will be dispersed over more bins. Specifically, we exponentially decrease the energy threshold, such that the threshold for node n is
we find periodic behavior.
4.4 Filter to Frequency While energy identifies the presence of periodic behavior, we also must know where that behavior occurs— at what frequency. We therefore must map a position in the filter tree to a specific range of periods. At first glance, filter mapping seems easy: low- and high-pass filters each separate the low and high frequency bands. Unfortunately, because filters are symmetric, repeated application of high pass filters “flip” the covered frequency bands. If we define < as “covers lower frequencies than”, and X ab as applying filter a then b to timeseries X, then X L < X H and X LL < X LH , but X HH < X HL . We discuss this flipping further in Appendix A. The correct mapping of filters to frequencies is essential for proper detection, and it also supports visualization of energy over the frequency space as well. Figure 3 shows 6 levels of expansion of an artificial signal that occurs every eight seconds. In this figure, each row corresponds to one level of decomposition of the filter tree, the scale of the decomposition. The top row is scale 0, indicating the original timeseries, the next is scale 1, showing X L and X H , and so on. Each row is divided into several blocks, showing increasing frequency from left to right. The top row shows one block, by definition capturing 100% of the energy across all frequencies. Each lower row shows twice as many blocks, each representing energy over bands of half the previous frequency. Finally, we represent energy on the z-axis, using both color (white is large amounts of energy, black little) and a numeric value representing percentage of total energy. Because frequency bands become narrower at each level, we scale color in each row to the maximum energy in any band of that row. Thus in Figure 3, all blocks are either black or white since energy is perfectly distributed with in this case, but in later examples intermediate cases
tenergy = (cℓ /n) where the empirically derived constant cℓ , is set based on the tree depth. We currently start cℓ at 0.6 for the first 5 levels and then increase it linearly. Although we expect events occurring at interval p to provide energy at frequency f = 1/p, they also give energy to harmonics at small integer multiples of f . We therefore choose the lowest frequency range in a harmonic set as the period of an identified frequency. We can misdetect the true frequency for several reasons. We see energy at half the base frequency, or at half of a harmonic of the base frequency. Noise and window 5
mis-alignment (frequencies that are not a power of two) also affect the strength of signals; we look at these effects in Section 6.2. Typically we correctly find the base frequency, but occasionally a harmonic is stronger.
4.5.2
Locating Events in Time
Once we have identified the frequency range of a periodic series of events, we can estimate when the events started and stopped by looking at the timeseries of coefficients corresponding to that frequency range. Recall that each node in path P in the decomposition contains a timeseries X P . Each element i in this timeseries indicates a time xP i . To find the beginning and ending of an event in time, we look for a consecutive series of strong coefficients xP i . Our current simple approach is to compute the mean µ = E[X P ], then search backwards in time to find the first xP b < µ as the beginning, and forwards through the signal xP i > µ to find the < µ, giving a period b ≤ i ≤ e. Often, the next xP e level of decomposition which identified the frequency range contains too little information in the time domain to make any useful statements about timing. In these cases, we can back up the filter tree two or more levels and examine coefficients at a level with better temporal resolution.
Figure 4: Periodicity in traffic to a BitTorrent tracker. (Single client, 300s period, 0.42 SNR). tructure. The results presented in this paper are taken from off-line analysis of selected traces to allow controlled, repeated evaluation. Our paper uses one main dataset, a four-day trace [23] consisting of the majority of traffic entering and exiting the main USC border router. All of our traces are freely available by request from the authors.
4.6 Pruning to Reduce Computation
5.
Although our filters reduce to a simple set of additions and subtractions, we can reduce the amount of work done by pruning out certain paths through the filter tree. We prune branches from the filter tree for two reasons. First, we cease expansion in frequencies that exceed our sampling rate. Second, we stop expansion if there is minimal energy in the node. In practice, we find that frequency-based pruning is very effective, eliminating 70% of expansion after three levels. We discuss the number of filtering steps pruning saves us in Section 6.6.
To give a rough idea of how our approach works, we next show several examples of periodic behavior in network traffic. Through these examples, we wish to demonstrate first that popular classes of applications generate periodic traffic and that we can find such behavior. In the next section we move from these demonstrations to a more systematic exploration of the effectiveness of our approach. Here, we look at two different applications that show strong periodicity: BitTorrent and an RSS news feed aggregator. We first consider BitTorrent. We build a timeseries of all TCP flows originating from a single host running several applications, including a BitTorrent client, a web browser, and an e-mail reader. We selected the host from our four-day trace [23] based on port-identification; we manually verified that it was running BitTorrent by connecting to the tracker with which it was conversing. We then extracted all TCP flows from the host (the host’s client was not accepting incoming connections). Figure 4 shows our visualization of TCP flows from this host. The tracker is used to coordinating peers sharing a resource (file). In this case we see a strong periodicity around 300s: at the 11th decomposition (the lowest row), 4% of the energy is in the frequency range corresponding to a 292–315s period. We confirmed that this BitTorrent client contacts the tracker (to coordinate data exchange) every 600s. Although we do not see particularly strong energy at 600s, 300s is a harmonic
4.7 Implementation and Datasets Previous sections describe our approach; we next describe our implementation. We have implemented our detection method as a plug-in to the LANDER system at USC [10]. LANDER provides anonymized packet traces taken from multiple taps into our regional network. Our module takes packet traces and returns a list of possible periods for any periodic communication detected (Section 4.5.1) as well a location in time of when the periodic communication was active (Section 4.5.2). Sources and destinations can then be isolated with further filtering. We have carried out analysis on-line (in near-realtime) and off-line. We have run our system for several weeks in on-line mode, identifying periodic behavior in traces provided by LANDER’s continuous trace infras6
PROOF OF CONCEPT
Figure 5: Periodicity in an RSS News feed reader (SNR: 0.62).
Figure 6: Perfect artificial period of 9s (nonwindow aligned).
of this frequency, as is 150s that also shows strong energy. We conclude that our approach can detect regular control messages in BitTorrent traffic, and later in Section 6.2 we explore why the frequency of the periodic network behavior does not always correlate to the strongest concentration of energy. Figure 5 shows traffic from a single host running an RSS feed aggregator (the Wizz plug-in for Firefox). Again, we found this host in our four-day dataset, this time by identifying it by traffic with FeedBurner, a large hosting site for RSS feeds. The RSS aggregator has a configuration that polls for new information every 600s. As with BitTorrent, application our our approach shows energy indicating strong periodic behavior, although again it is strongest at 300s, a harmonic of the true application period. These examples have shown real applications have low-rate periodic behavior, and that our approach can pick that behavior out of aggregate traffic. Although both of these applications are benign, we will show later that malicious applications are detectable (Section 6.3.1) and common in our network (Section 6.5). We next look more carefully at how detection process works.
We begin by evaluating our method with artificially data. We start here because artificial data provides complete control ground truth, allowing us to understand the benefits and limits of our approach. In this section we present three cases of increasingly complex input.
6.1.1
Best case: aligned, artificial data
We earlier presented the cleanest possible case in Figure 3. That figure used and artificial timeseries with an event every 8s with 1s time bins. This case is ideal because 8s is a power of two, and our filters decompose time in powers of two, so this case is aligned with our analysis window. Figure 3 shows this case. The first four levels of decomposition show uniform energy across all frequencies. At additional levels of decomposition, though, energy emerges at 8s (0.125Hz), and at 2s, 2.66s and 4s, harmonics of this period (2, 3, and 4× the basic frequency). Because of window alignment, energy between these harmonics is zero. We conclude that decomposition works very well with clean data, although harmonics are as strong as the injected frequency.
6.1.2
Unaligned artificial data
While the results of a ideal data are clear, real-world data is unlikely to be periodic on a perfect power-of-two multiple of our estimate frequency. We therefore next evaluate a perfect artificial timeseries with period of 9s. We expect a nosier result. Figure 6 shows the the first seven levels of decomposition of a 9s artificial timeseries. We expect that there will be energy near 9s (0.111Hz). We see this energy, but it is split between to adjacent bins with 4% and 5% of the energy around a 9s period, and again at the 4.5s harmonic—the energy is now “blurred” between two adjacent bins. We also see strong energy near harmonic energies 3s and 2s (3× and 4× the base frequency 0.111Hz).
6. EVALUATION We next systematically evaluate our approach. We begin with artificial data to understand how observations of known behavior are affected by our our system (Section 6.1). In Section 6.2 we then define and explore noise, the primary impediment to detection, and demonstrate that we can detect changes in behavior (Section 6.3). Finally we show the range of applications that show periodic behavior (Section 6.4) and in Section 6.5 that those applications occur and are detectable in real networks.
6.1 Does Identification Work? 7
Figure 7: Long-duration artificial period of 600s.
Figure 8: Mix of foreground traffic (600s period) with Surge simulated background traffic.
This example shows that, even with perfectly periodic data, real-world, unaligned periods will be nosier than our ideal case.
6.1.3
of noise to exercise our system. We then shift to replays of real-world traffic from trace replay to better capture current network traffic. Since web traffic remains the dominant use of the network in terms of flows, we therefore focus on web models to simulate background noise. We use the Surge web traffic model to generate controlled background traffic [1] (version 1.00a). We use the example Surge parameters, but we reduce the number of total documents retrieved to better model a single client (instead of a server). We then extract the traffic for one client and concatenate multiple such instances to generate an 18 hour trace. After Surge generates a web workload, we reduce this workload to a timeseries (TCP flow starts per unit time) as described in Section 4. Finally, we mix this traffic with our artificial signal by simply summing the timeseries, element-by-element. We use the 600s periodic signal from Section 6.1.3. Before we quantify effects of background noise, we first show visually how it changes our observations of the signal. We expect two kinds of interference: web traffic will induce other periodic signals (we know it has strong periodicities at small timescales [6]), Second, interference may blur the signal, similar to the distortion caused by non-alignment (Section 6.1.2). Figure 8 shows the levels 6-12 of decomposition for our periodic signal and the combined Surge background traffic. By comparison, Figure 7 showed the same traffic without background traffic. We see the same periods and harmonics as before (around 600s, 300s, 200s, and 150s), but rather than 4–5% of energy, they show up as 1–2%. Thus, the main result of this simulated background traffic is a large increase in the “DC component” of our signal in the left-most bin (consistent application of low-pass filters). This result strongly suggests the importance of quantified (non-visual) methods for detecting periodic behavior. It also suggests the importance of quantifying noise to allow us to quantify sensitivity. We explore this question next.
Low-rate periodicity
Our goal is to discover low-rate periods: events that occur every few minutes or hours. In the two prior artificial examples we explored periods of less than 10s because they show up quickly with six levels of decomposition, To explore further decomposition, we now look at an artificial timeseries with an event every 600s. Such sparse events require additional levels of decomposition; our graphs now omit the top levels since they would simply show all energy spread uniformly across all blocks. Figure 7 shows the visualization for an artificial timeseries with an event every 600s (1.6milliHz). We expect to see energy around 600s, but since 600s is not aligned, we expect some blurring. The figure shows strong energy (5%) in the 588–625s. We also harmonics around 300s, 200s, and 150s. We conclude that, with sufficient levels of decomposition, our approach can detect lowrate periodic behavior.
6.2 Effects of Noise The previous section showed how our methodology worked with pure signal. Real network traffic will of course mix the traffic we are looking for, the signal, with other traffic, the noise, that may distort and obscure our traffic of interest. In this section we explore the effects of adding background noise to a controlled (artificial) periodic signal. Our goals are to evaluate how different types of noise distort the signal, and to define a measure of the signal-to-noise ratio (SNR) for our system to quantify interference.
6.2.1
Controlled noise
In this section we look at two types of background traffic as noise. We begin with simulated background traffic, since it can provide a perfectly controlled level 8
consistent above SNR values of 0.15—when there is at least one flow of signal to seven of background. With sparser signals, the percent of energy quickly drops off. We applied our detection algorithm (Section 4.5.1), and found good detections as long as the energy at the target period was at least 40% of original, suggesting our approach might work reasonably to SNR values as low as 0.05 (one flow in 20 is signal). While Surge provides an easily controlled background load, the model is now fairly old and may not reflect current web traffic. We therefore chose three web clients at random from our week-long dataset and extracted 18-hour timeseries for each client. We chose the 18hour period when each client was most active. As with our artificial background traffic, we combine each web client’s timeseries with varying frequencies of periodic events to study the effect of SNR on detection. These values are shown as scatter plots of three different symbols on Figure 9. As with Surge, the strength of the signal to the three web clients are consistent and large for large SNRs (above 0.15), where noise only degrades the signal by 30% or less. However, as SNR falls, we begin to see inconsistent results—the fraction of original energy will be 60–80% for a signal at one period and 20–40% for a signal that is only 100s different. We believe this large variability is because of “accidental” low-rate periodicity in today’s web traffic. We conclude that our approach works well provided the signal is at least 10% of the selected traffic. Because of variation in background traffic, our ability to detect lower SNRs varies a great deal and should not be assumed.
Percent of Original (no noise) Coefficient Energy
100 90 80 70 60 50 40 30 20 Web Client 1 Web Client 2 Web Client 3 SURGE generated
10 0 0
0.1
0.2
0.3
0.4
0.5
0.6
Linear Signal to Noise Ratio (SNR)
Figure 9: Effect of SNR on Coefficient Energy
6.2.2
Quantifying Noise with SNR
Figure 7 shows that background traffic greatly reduces our ability to observe low-rate periodicity. To quantify this effect, we next define the signal to noise ratio (SNR) for our environment and estimate what SNR values allow detection. SNR is defined as the “amount” of signal to interfering background traffic. We quantify the amount of traffic with the number of flow starts, since these are the events in our timeseries. We now wish to vary the SNR in a controlled manner. There are several strategies that change this ratio, either varying the intensity of foreground or background traffic, or changing the period of the foreground. We wish to draw on traces of real traffic, so we cannot easily vary the rate of background traffic (at least, without possibly altering the nature of the application and TCP control loops). We therefore vary the period of the periodic foreground traffic, considering a range of values from periods of 1800s down to 1000s by 100s increments, then by 50s increments below. To quantify the change, we establish a target frequency range that shows the strongest energy with just foreground traffic at a specific level of decomposition (the level of decomposition is dependent upon the foreground traffic). In all cases this was the dominant frequency (the frequency at the period of the foreground traffic). We then compare the fraction of total energy energy in that bin with and without background traffic, and we report the fraction of original (foreground-only) energy that appears with mixed traffic. Figure 9 shows the effect of the SNR on the original coefficient energy for varying foreground signals, and for four different background traffic loads: Surge (the squares connected with a line), and web traffic extracted from traces of three different clients. First we consider the Surge results. We see signal energy is fairly
6.3
Identifying Changes in Periodic Behavior
In the previous sections, we demonstrated that malware shows periodic behavior that can be identified, even in the face of noise. In this section we look at identifying changes in periodic behavior, and when these changes occur. We wish to identify changes in the periodic behavior of a given computer to help users understand their computer. All operating systems, and an increasing number of applications automatically poll for updates periodically. In addition, spyware and adware often reports back to or requests new information from its external master. In fact, application updates have sometimes not disclosed the presence of automatic polling, or how much information they disclose. When desired, a user will want to know when such automatic checks stop, and if not expected, a user will want to know about the addition of an automatic reporting service. We consider two examples, one negative and the other positive changes: detecting installation of a keylogger and detecting presence of OS updates. 9
this very long period requires 16 levels of decomposition.) While these before-and-after pictures show a strong visual change, more compelling is the ability to use wavelets to locate in when in time keylogging began. Note that wavelets can trade-off precision in frequency against in time, but cannot be precise in both dimensions simultaneously. We manually examined the filter bank coefficients at level 15, to provide temporal resolution of about about 9-hour, then look for changes in coefficients similar to the approach used in Section 6.3; we then relate these periods to time using temporal discovery as described in Section 4.5.1. We then observe that change in energy indicates a change in traffic sometime between 12pm and 9pm on the second day of our experiment, bracketing the 4pm installation time. This experiment shows we can detect regular but lowrate traffic correlated with a known spyware tool. We anticipate that this approach could be used by a network administrator to monitor a large number of usercontrolled machines for malicious activity. Although centralized companies could do such monitoring more easily by modifying software individual machines, some companies (for example, Google) and most ISPs do not have this ability. While such network monitoring is possible today with centrally maintained blacklists, our approach detects behavioral changes that would apply to malware before the control site is blacklisted. After detection, network administrators could take action to further investigate, perhaps notifying the machine’s owner or subjecting that host to more invasive monitoring or quarantine.
(a) Traffic without keylogger (before installation).
(b) Traffic with keylogger (after installation).
Figure 10: Visualization before and after installation of a keylogger.
6.3.1
Detecting a keylogging application
Many keyloggers report on user activity at specified intervals, to inform their supervisors what they have learned and that they are still operational. Both SpyBuddy and Keyboard Guardian have supervisor-configurable reporting intervals. To investigate if we can detect keylogger reporting we installed Keyboard Guardian on a dedicated Windows computer. We monitored all TCP flows from the test machine for a three day period while using the test machine for occasional e-mail and web browsing (dataset [22]). On the second day of the experiment, we installed Keyboard Guardian at 4pm, and configured Keyboard Guardian to email reports every three hours. Our periodic use of the computer provided an SNR of 0.1. Figure 6.3.1 shows the visualization of traffic periodicity before and after the keylogger was installed. In Figure 10(b) shows strong periodic traffic around our reporting period (10,800s, 92µHz), at double the frequency (around 21,600s) and at harmonics (around 5400s, 3600s, and 2700s). Surprisingly, the base frequency is not very strong, less than 1%. (Note that 10
6.3.2
Detecting operating system updates
Our approach applies to positive uses of polling as well as negative uses. The security policy of all operating systems and many applications include automatic polling for updates with periods from 30 minutes to weekly. Just as network administrators wish to detect bad behavior, they may also wish to detect the absence of good behavior. In addition, automatic updates are often disclosed to users only in the fine print of an enduser license agreement, so users may wish to know when a newly installed application regularly contacts its developers. To confirm we can see a change in update checks we monitored a lab machine running the Fedora 10 distribution of Linux for three days (dataset: [22]). By default, Fedora polls update servers every hour using yum-updatesd. During the second day of the experiment, we disabled update checks at 2pm. The machine was lightly used for web browsing and e-mail over the three day period. Figure 6.3.2 shows traffic periodicity with and without OS update checks. In the 16th level of decomposi-
In the previous sections, we demonstrated when and how often we can identify traffic that contains a set of periodic events occur, even in the presence of noise. We now look at the variety of applications which exhibit periodic behavior that can be detected with our approach. As shown in Section 6.3, application range from the beneficial to the malicious. We enumerate important classes and examples next. OS and application updaters: Nearly every current operating system today Windows, MacOS, and most distributions of Linux including Fedora, Ubuntu, SUSE includes an automatic update service—such as service is a necessity given the large number of Internetfacing programs that may have vulnerabilities. As attacks have become more sophisticated, an increasing number of applications also include automatic updates, including web browsers (Firefox, Google Chrome), tools for browsing web content such as Adobe Acrobat, and programs where the applications change frequently, such as peer-to-peer file sharing clients. Update polling periods vary, from once an hour to once a week. We have demonstrated we observe Fedora OS updates in Section 6.3.2. User services: Many user services poll the network regularly to track weather, stocks, news, and other things users may care about. Weather monitoring services exist for every OS, for example, WeatherEye for Windows and MacOS, weather sidebar of gadgets for Windows, weather dashboard widgets for MacOS, and the Clock applet in Gnome on Linux. These services often poll a single site every 30 to 120 minutes. RSS News Feeds: While weather or stock monitors poll a central server, some applications users use watch user-selected sites. RSS News Aggregators and podcast trackers are probably the most commonly used example of such applications. Specific examples of RSS readers include the Wizz plugin for Firefox, NewzCrawler and FeedDemon for Windows, Shrook and Cyndicate for MacOS, Liferea and Akregator for Linux. Different tools use different default polling intervals, typically 30 minutes to an hour. Some tools adapt their polling frequency to the monitored website. We saw periodic traffic with one RSS news reader Figure 5. Web Counters: Many web pages include counters and JavaScript to monitor when and how long a web page is seen. Examples include Google Analytics, Yahoo Web Analytics, Microsoft adCenter Analytics, and the Livejournal counter. These tools often insert code into a web site, so that every browser which views the site also contacts the count server. They create periodic behavior because many of the web pages in which they are embedded automatically refresh at regular intervals, often from 5 to 30 minutes. Even without of browserside scripting languages, these refreshes can quickly gen-
(a) Traffic with automatic polling for OS updates.
(b) Traffic without automatic update polling.
Figure 11: Visualization before and after removal of OS update checks. tion of Figure 11(a) we see OS update polling as energy at the base frequency of one hour (3600s, two adjacent 3% bins), and at harmonics at double and two-thirds the frequency (7200s, 4% energy, and 2400s, 3% energy). Disabling updates, by contrast, shows no energy below the 14th level of decomposition (Figure 11(b). We were also able to narrow down when updates were disabled. Looking at decomposition level 15 with time resolution of roughly 9 hours, we determined OS update polling ceased sometime between 12pm and 9pm, consistent with our known time of 2pm. This example of OS update polling confirms that our results for keylogging detection apply to the useful periodic behavior of OS update polling. Again, while in some cases system administrators may be able directly monitor OS update polling if they have administrative access to the machines in question, we suggest our approach could be useful when only network access is possible. In addition, monitoring periodic checks is robust to a potentially changing set of servers hosting OS updates.
6.4 Variety of applications that show periodic behavior 11
erate a large amount of periodic traffic. We have seen such updates at news sites such as CNN, ESPN, and MSNBC. Peer-to-peer protocols: Peer-to-peer protocols must coordinate activities between peers, possibly mediated by a central tracker. Trackers can therefore be identified by regular polling from peers. We observe this periodic traffic at a BitTorrent tracker in Figure 4. We expect that the periodic traffic used to maintain the Kademlia ring will show strong periodic behavior [17]; Kademlia is the DHT protocol behind several widely used peerto-peer services such eDonkey. Gnutella keep-alives are also often periodic. Peer-to-peer protocols coordinate fairly frequently, typically every 20 minutes or so. Adware: A number of tools derive revenue from showing users advertising. Although sometimes chosen by users, these tools are often installed without complete user consent. Such tools often report back to their designers, either to fetch new ads to display user, or to report back on the what the user is doing. There are hundreds of adware programs; we observed 36 in our incomplete survey of USC traffic (Section 6.5). We also reproduced periodic behavior in a Gator adware component that appeared in a Kazaa version 2005. These tools often probe very few minutes to few hours. Some adware aggregates reporting on the user and ad updates with user-initiated search, and we did not expect them to cause periodic traffic on their own. However, in one case (the ISTbar from 180 Solutions), we see periodic traffic. Perhaps this traffic is an auto-update service. Sypware and keylogging: A step more malicious than adware, spyware surreptitiously monitors what a user is doing. The most benign may collect demographic information to support while others harvest passwords and bank accounts. We discuss detection of one keylogging application in Section 6.3.1. Botnet command and control: Finally, many botnet systems employ command and control systems. Because these are adversarial we expect them to be difficult to detect, but they often use peer-to-peer protocol that cause traffic at regular intervals. We have shown that we can identify example applications in several of these classes. This range of applications, and the growing use of periodic traffic for both good and ill suggests that our ability to remotely detect such applications is an important new tool for network administrators, particularly to identify changes in their network (Section 6.3). The problems created by some of these applications are sufficient to support an industry of adware and spyware detectors and removers. Blacklists and host-based malware scanners offer protection against a variety of malware, but they rely on external sources to maintain
12
up-to-date information. The ability to identify the who, when and where of periodic behavior, can help classify traffic and hosts (by looking at periodic services) and identify new adware without the need of a new signature (by looking at periodic contact with ad servers). Additionally, detection of new types of periodic traffic may support “zero-day” detection of malware that has not yet been identified and placed on a blacklist. Finally, by basing discovery of adware on network traffic, rather than with host-invasive software, allows network administrators to identify malware on user machines.
6.5
Prevalence of applications in real networks
We have outlined categories of applications that have periodic behavior (Section 6.4), and specific examples of such applications. However, example applications don’t characterize how widespread hosts exhibiting malware with periodic behavior are. To evaluate how prevalent such malware is, we looked for malware in our four-day trace from USC [23]. We compared this traffic with a widely referenced blacklist of IP addresses that have been identified has serving malware such spyware and adware [26]. This list represents a candidate list of questionable applications in four of the categories we identified in Section 6.4. We performed two levels of subsetting before applying multi-scale analysis. First, for each blacklisted address we took all flows to that destination. We found that many destinations had a mix of one-off connections as well as periodic behavior, so for a second level of subsetting, we selected subsets of source hosts in USC that transmit to that destination in groups of up to twenty. This step improves sensitivity because while periodic traffic may be lost in the aggregate of thousands of hosts, it can show up more strongly in smaller aggregates. Finally, we used our detection method (Section 4.5.1) to identify subsets that have strong periodic traffic at periods of 600s or longer. For destinations that have some periodic traffic, we then count all IP addresses at USC that contact that destination. Although these steps could be automated and applied systematically to the network by a monitoring appliance, we are not suggesting they provide a practical implementation of such a service. However, this process could be inverted, so that each user (or potentially, each group of users on a LAN segment) monitor their traffic for changes in periodic behavior (as we describe in Section 6.3). Table 1 shows the results of this analysis. We found traffic to 181 of the blacklisted destinations from our campus. About 45,000 IP addresses at USC had traffic to some of these sites, nearly one-third of all active campus addresses. (The presence of dynamic addresses means that this count may not correspond exactly to 45,000 users, since one user may occupy multiple ad-
Group active to anywhere active to blacklisted Non-periodic Periodic User Services Web Counters Ad Servers Other
Blacklisted Destinations – – 181 (100%) 120 (66%) 61 (44%) 5 (3%) 15 (8%) 36 (20%) 5 (3%)
Unique IPs (users) 128,614 [100%] – – n/a n/a n/a n/a 22 [0%] 16,405 [13%] 31,277 [24%] 6 [0%]
Table 1: Prevalence of malware seen participating in periodic behavior on our monitored network. Figure 12: Depiction of pruning. F=Pruned due to frequency resolution. E=Pruned due to low energy, P=Parent already pruned.
dresses, and vice versa.) For the 61 blacklisted hosts that had periodic traffic, we manually examined the site and classified it in one of four categories (user services, web counters, ad servers, and other). We expected to see wide use of web counters and ad servers, since both support the advertising driven nature of current Internet. This observation strongly supports the presence of servers that periodic traffic, and the pervasive contact with those servers. While our approach cannot pick such traffic out of aggregate traffic (an area of planned future work), it could easily be used by a user to monitor their own computer for suspicious outgoing traffic. In addition, the large number of users accessing known adware sites (24% of active USC IP addresses) and the strong periodic nature of such traffic suggest that that is a promising target for future automated detection.
6.6 Advantages of Pruning As described in our methodology, while we normally expand each node in the filter tree, we reduce the number of filtering operations we perform by pruning branches which appear “uninteresting” (Section 4.6). We define branches as uninteresting for two reasons. First, we prune if further division of the frequency domain gives us unnecessary resolution, such as resolution higher than our sampling rate. Second, we prune if the energy in the frequency band is insignificantly low. In this section, we demonstrate the advantages of performing pruning by quantifying the reduction of filtering steps we perform. We demonstrate the advantages of pruning through two examples. First we show the simple case of an artificial periodic signal with background noise. We then show filtering reduction in the presence of background noise. We start with the simple case of a timeseries with a periodic signal, and no background noise. In this example, we demonstrate the effectiveness of pruning and that pruning is performed both for frequency resolution cutoffs and low energy. Figure 12 shows an 8s artificial signal, sampled at 1 second, with no background noise. Frequency bands marked with F or E are bands that we 13
Figure 13: Percent of nodes pruned at each level. stop filtering due to our frequency or energy thresholds respectively. Frequency bands marked with P are frequency bands we never reach because their branch was pruned further up the tree. In six levels of decomposition, we prune nearly as often for low energy (6 times) as we do frequency resolution (8 times) and skip nearly 70% of the filtering steps we would have performed in the absence of pruning. In the simple case of no background noise, pruning proves advantageous. We next look at how background noise effects pruning decisions. While background noise has no effect on pruning due to frequency resolution, we expect some effect on pruning due to low energy. To understand this effect we look at an artificial signal with a period of 8 seconds, sampled at 1 second but with real network background traffic with a SNR of 0.7. We expect that due to background energy being present in many frequency bands, we will be unable to identify ranges of low energy as early as when dealing with signals with no background noise. Figure 13 shows at each level of decomposition, the
percent of nodes we are able to prune. While in the absence of background noise, we were able to prune as early as level 4 (see Figure 12), with background noise we are unable to prune due to low energy until level nine. However, pruning three nodes in level nine, saves us 96 filtering steps in 14 levels of decomposition. In all, we were able to prune eight times due to low energy, and skip 280 filter steps (about 2% of the total filtering steps). Pruning on low energy is less effective in the presence of noise, however we are still able to easily save a large number of extra steps. In the previous two examples we showed pruning on both low energy and frequency resolution proves advantageous. While pruning on frequency resolution remains constant and is based only on the sampling rate of the initial timeseries, the effectiveness of pruning on low energy depends heavily on the amount of background noise. The more dissipated energy in the background noise, the fewer branches we are able to prune. Even in cases where we have a moderate amount of background noise, pruning on low energy still saves filtering steps.
Percent of Original (no jitter) Coefficient Energy
1 0.9 0.8 0.7 0.6 0.5 0.4 0.3 0.2 0.1 0 0
10
20
30
40
50
Jitter as a Percentage of Period
Figure 14: Effect of jitter on coefficient energy. Original period 128s. a time-bin we use, and how many levels of decomposition we perform. To increase our ability to find longer periods, we must increase the time-bin size, effectively performing a low-pass filter. For longer periods, further levels of decomposition might be necessary to see the low frequencies, and our observation period must be sufficiently long to observe several periods. A detailed study of these effects is an area of future work. However, we can describe the trade-offs: a longer bin size allows detection of longer periods, but reduces the temporal sensitivity and may increase nose (as more traffic is grouped into individual bins).
7. ROBUSTNESS In previous sections we demonstrated that we can detect and identify changes in periodic behavior. In this section we briefly look at the robustness of our scheme, and discuss it sensitivity to parameter settings.
7.1 Evasion As with most security protocols, detection of lowrate periodicity can be evaded by a determined attacker. Evasion can be accomplished in one of two ways. First, as shown in Section 6.2, our detection is sensitive to noise. Decreasing the SNR to lower than 5% effectively hides all periodic behavior from our current implementation. Thus, a determined attacker can decrease the frequency of his traffic or generate spurious other traffic. Second, an application can evade our detection scheme by adding jitter to its periodic behavior. By increasing jitter, the energy of the signal is diffused. As a simple example, we can vary the period of an artificial signal and study the effect this jitter has on the coefficient energy in a target frequency range. Figure 14 shows an artificial signal with a 128s period as the period varies up to 50%, based on an observation period of 2-hours. In this case, jitter of more than 15% is relatively effective at hiding the signal. Of course, the countermeasure to this behavior is to employ a longer observation period.
8.
CONCLUSIONS
In this paper we have shown that low-rate periodicity is common to several broad classes, both good (OS updates), bad (keyloggers and malware), and ugly (adware), and that these applications are widely deployed on public networks. We have explored a wavelet-based approach to identify such periodic behavior, and begun to explore the sensitivity and robustness of this approach. A promising application of such analysis is self-surveillance, as a user watches his or her own traffic to detect unexpected changes.
9.
REFERENCES
[1] Paul Barford and Mark Crovella. Generating representative web workloads for network and server performance evaluation. In Measurement and Modeling of Computer Systems, pages 151–160, 1998. [2] Paul Barford, Jeffery Kline, David Plonka, and Amos Ron. A signal analysis of network traffic anomalies. In Proc. of ACM SIGCOMM Internet Measurement Workshop, Marseille, France, Oct 2002. ACM. [3] Genevieve Bartlett, John Heidemann, and Christos Papadopoulos. Inherent behaviors for on-line detection of peer-to-peer file sharing. In Proc. of 10th IEEE Global Internet, pages 55–60, Anchorage, Alaska,
7.2 Parameter sensitivity As described in Section 7.2, we have three main parameter settings to set when performing our full decomposition: the length of our observation period, how large 14
[4] [5]
[6]
[7]
[8]
[9]
[10]
[11]
[12]
[13] [14]
[15]
[16]
[17]
[18]
USA, May 2007. IEEE. An extended version is ISI-TR-2006-627. Chen-Mou Cheng, H.T. Kung, and Koan-Sin Tan. Use of spectral analysis in defense against DoS attacks. In Proc. of IEEE GLOBECOM, 2002. F. Constantinou and P. Mavrommatis. Identifying known and unknown peer-to-peer traffic. In IEEE International Symposium on Network Computing and Applications (NCA), pages 93–102, Jul 2006. Anja Feldmann, Anna C. Gilbert, Polly Huang, and Walter Willinger. Dynamics of IP traffic: A study of the role of variability and the impact of control. In Proc. of ACM SIGCOMM Conference, pages 301–313, Aug 1999. Yu Gu, Andrew McCallum, and Don Towsley. Detecting anomalies in network traffic using maximum entropy estimation. In Proc. of ACM Internet Measurement Conf., pages 345–350, Oct 2005. Xinming He, Christos Papadopoulos, John Heidemann, and Alefiya Hussain. Spectral characteristics of saturated links. Technical Report USC-CSD-TR-827, University of Southern California Comp. Sci. Dept., Jun 2004. Xinming He, Christos Papadopoulos, John Heidemann, Urbashi Mitra, and Usman Riaz. Remote detection of bottleneck links using spectral and statistical methods. Computer Networks, 53(3):279–298, Feb 2009. A. Hussain, G. Bartlett, Y. Pryadkin, J. Heidemann, C. Papadopoulos, and J. Bannister. Experiences with a continuous network tracing infrastructure. In Proc. of ACM SIGCOMM Workshop on Mining Network Data, pages 185–190, Philadelphia, PA, USA, Aug 2005. Alefiya Hussain, John Heidemann, and Christos Papadopoulos. A Framework for Classifying Denial of Service Attacks. In Proceedings of the ACM SIGCOMM’2003, Karlsruhe, Germany, Aug 2003. Alefiya Hussain, John Heidemann, and Christos Papadopoulos. Identification of repeated denial of service attacks. In Proceedings of the IEEE Infocom, page to appear, Barcelona, Spain, Apr 2006. IEEE. Alefiya Naveed Hussain. Measurement and Spectral Analysis of Denial of Service Attacks. PhD thesis, U. of Southern California, Comp. Sci. Dept. T. Karagiannis, A. Broido, M. Faloutsos, and kc claffy. Transport layer identification of P2P traffic. In Proc. of ACM SIGCOMM Workshop on Internet Measurement (IMC), pages 121–134, Oct 2004. T. Karagiannis, K. Papagiannaki, and M. Faloutsos. BLINC: Multilevel traffic classification in the dark. In Proceedings of the ACM SIGCOMM Conference, pages 229–240, Philadelphia, PA, USA, Aug 2005. Antonio Magnaghi, Takeo Hamada, and Tsuneo Katsuyama. A Wavelet-Based Framework for Proactive Detection of Network Misconfigurations. In Proceedings of ACM workshop on Network Troubleshooting, Aug 2004. Petar Maymounkov and David Mazi`eres. Kademlia: A peer-to-peer information system based on the XOR metric. In Proceedings of the International Workshop on Peer-to-Peer Systems, Cambridge, MA, USA, Mar 2002. Springer-Verlag. Urbashi Mitra, Antonio Ortega, John Heidemann, and Christos Papadopoulos. Detecting and identifying malware: A new signal processing goal. IEEE Signal
Processing Magazine, 23(5):107–111, Sep 2006. [19] George Nychis, Vyas Sekar, David Andersen, Hyong Kim, and Hui Zhang. An empirical evaluation of entropy-based traffic anomaly detection. In Proc. of 8th ACM Internet Measurement Conf., pages 151–156, Oct 2008. [20] C. Partridge, D. Cousins, A. W. Jackson, R. Krishnan, T. Saxena, and W. T. Strayer. Using signal processing to analyze wireless data traffic. In Proc. of 1st ACM Workshop on Wireless Security, pages 67–76, 2002. [21] D.S. Taubman and M. W. Marcellin. JPEG2000: image compression fundamentals, standards, and practice. Kluwer Academic Publishers, Boston, MA USA, 2002. [22] USC/LANDER project. Specialized TCP flow traces, PREDICT ID USC-LANDER/specialized_tcp_flow_usc-20081209, Dec 2008. [23] USC/LANDER project. TCP flow traces, PREDICT ID USC-LANDER/tcp_flow_usc-20081209, Dec 2008. [24] M. Vetterli and J. Kovacevic. Wavelets and Subband Coding. Prentice Hall PTR, Upper Saddle River, NJ, USA, 1995. [25] Martin Vetterli and Jelena Kovaˇcevic. Wavelets and subband coding. Prentice-Hall, Inc., Upper Saddle River, NJ, USA, 1995. [26] YoSponge. http://www.geocities.com/yosponge/blockips.txt. Last upddated Jul 2008.
APPENDIX A.
FLIPPING OF FREQUENCY BANDS
(a) Low-pass filter
(b) High-pass filter
(c) Up-sampled low-pass fil- (d) Up-sampled ter. filter.
high-pass
(e) Combination of two low- (f) Combination of two highpass filters. pass filters.
(g) Combination of a highand then low-pass filter.
Figure 16: Impulse response of low- and highpass filters and combinations. As discussed in Section 4.4, repeated application of our filters leads to non-intuitive behavior where covered frequency bands “flip”. We must take this flipping into account to correctly relate filter bands with specific frequencies in periodic communication. Without correctly accounting for flipping there is no way to even approximate a correct frequency range for identified periodic behavior. In this section we discuss why and when this flipping occurs, and we show how to
15
/
\
/
\
/
\ → ←
/
\
/
\
/
→ ←
\
/
\
→ ←
Figure 15: Filter depiction for three levels of filtering. account for it when mapping filter coefficients to frequency. Flipping is due to the shifting and contracting of the filters which occurs when we iteratively apply these filters. Flipping is a well known occurrence in wavelets (for example, it is discussed in homework problem 3.16 in Vetterli’s and Kovacevic’s Wavelets text book [25]), yet to our knowledge it has never been precisely defined in published work. We found careful definition essential to apply wavelets to our problem, and such definition required a surprising level of care, even when working with wavelet experts. In wavelets, each successive step repeatedly applies the low- and highpass filters by first up-sampling the filters and then convolving them with the impulse response from the previous filter(s). This up-sampling both shifts and contracts the filters, changing the expected impulse response of convolved filters. To clarify when flipping occurs, we visually demonstrate how iterative application of our filters effects frequency bands. To start, we first show the impulse response of our low- and high-pass filters. We then show what happens to this response at each iterative application of our filters over three iterations. Figures 16(a) and 16(b) depict the response of our lowand high-pass filters respectively. In these figures, the grey boxes represent the ranges of frequencies each filter passes. These representations depict the ideal frequency response, and do not indicate any overlap or fall-off which is present in the actual filters. Note that the filters are symmetrical about π. From Figures 16(a) and 16(b), we can see that with the first iteration of a high- and low-pass filters, we have no unexpected results. The low-pass filter allows only the low frequencies to pass, and the high-pass filter allows only the high frequencies to pass. However, if we continue and iteratively filter by combining the first pass of filters with second pass, we discover unexpected results. To combine the first pass of filters with a second pass, we must first up-sample. Figures 16(c) and 16(d) demonstrate how up-sampling changes the response of the lowand high-pass filters respectively. For each filter, the range of frequencies passed is shifted to the right, and contracted to half its original width. We expect that if two iterations of low-pass filters would result in a combined filter which passed only the lowest frequencies. In other words, if we convolve the up-sampled low-pass filter (Figure 16(c)) with the initial low-pass filter (Figure 16(a)), we pass only the lowest frequencies. Figure 16(e) depicts the combination of two low-pass filters (LL). The dark grey region is the spectral range of frequen-
cies allowed to pass by the combination of two filters (i.e. where the filters align). As expected, the combined low-pass filters pass only the lowest frequencies. Likewise, when we combine two high-pass filters, intuitively we expect to pass only the highest frequencies, however this intuition is incorrect. Figure 16(f) shows the combination of two high-pass filters (HH). From the dark grey region in Figure 16(f) we can see that the combination of two high-pass filters passes the second highest frequency range, and not the highest range as expected. Instead, the combination of a high and then low-pass filter (shown in Figure 16(g)) passes the highest range of frequencies. In other words, the passed frequency ranges of the HL and HH filters are flipped. We can visually see this continued flipping in Figure 15, which shows all combinations of filters at the third level of decomposition. Flipping is marked by arrows indicating the direction we flip in order to correct for the effects of shifting and contracting. From Figure 15 we can see that flipping occurs every time the highest half of a frequency range is iteratively split again. In order to accurately narrow down the frequency of periodic behavior, we need to accurately translate between a filter path which results in identifying a periodic behavior and the frequency range passed by the filters.
16