NADO : Network Anomaly Detection Using Outlier Approach ∗
Monowar H Bhuyan
Dept of Computer Science and Engineering Tezpur University Tezpur, Assam, India
[email protected]
†
D K Bhattacharyya
Dept of Computer Science and Engineering Tezpur University Tezpur, Assam, India
[email protected]
‡
J K Kalita
Dept of Computer Science University of Colorado at Colorado Springs CO 80918, USA
[email protected]
ABSTRACT
1.
Anomaly detection, which is an important task in any Network Intrusion Detection System (NIDS), enables detection of known as well as unknown attacks. Anomaly detection using outlier identification is a successful network anomaly identification technique. In this paper, we describe NADO (Network Anomaly Detection using Outlier Approach), an effective outlier technique for detection of anomalies in networks. It initially clusters the normal data using a variant of the k-means clustering technique for high dimensional data. Then it calculates the reference point from each cluster and builds profiles for each cluster. Finally, it calculates the score for each candidate point w.r.t the reference points and reports as anomaly if it exceeds a user defined threshold value. We evaluate the performance of our technique with KDDcup99 intrusion datasets and other real life datasets. We show that NADO has high detection rate and low false positive rate.
Anomaly based network intrusion detection plays a vital role in the detection of known as well as unknown or new attacks. An intruder or attacker attempts to violate computer security components such as integrity, confidentiality and availability to gain access to a system. An effective network anomaly detection technique aims to detect known as well as unknown attacks. Outliers or anomalies represent rare events that occur infrequently. There are many applications of outlier or anomaly detection such as intrusion detection, rare class identification, video surveillance, cyber attack detection and direct marketing. In anomaly based network intrusion detection system (ANIDS), only a small fraction of network traffic is considered anomalous representing attacks compared to the normal network traffic. Although outliers are by definition infrequent [15], their importance is quite high in comparison to other events or records and hence their detection is extremely important.
Categories and Subject Descriptors
Generally, intrusion detection techniques are of two types: (a) signature based and (b) anomaly based. Signature based detection aims to detect intrusions or attacks from known intrusive patterns. On the other hand, anomaly based detection detects attacks based on deviations from established profiles or signatures of normal activities. Events or records that exceed thresholds are reported as anomalies or attacks. However, signature based intrusion detection cannot detect new or unknown attacks. On the other hand, anomaly based detection techniques detect unknown attacks based on the assumption that the attack data deviate from normal data behaviour. However, there is a problem of high false alarm rate of the detection system. Minimization of the percentage of false alarms is the main challenge in anomaly based network intrusion detection. An outlier detection technique is effective in reducing the false positive rate with a desirable and correct detection rate.
K.6.5 [Management of Computing and Information Systems]: Security and Protection- Authentication, Invasive software and unauthorized access
General Terms Algorithm, Security, Cluster
Keywords Outlier detection, profile, attacks, score, anomaly detection ∗M H Bhuyan is a Ph.D. student at Dept of Computer Science and Engineering, Tezpur University, India. †Dhruba Bhattacharyya is a Professor in the Dept of Computer Science and Engineering, Tezpur University, India. ‡Jugal Kalita is a Professor in the Dept of Computer Science, Colorado University at Colorado Springs, USA.
INTRODUCTION
In this paper, we introduce Network Anomaly Detection technique using the Outlier approach (NADO) to detect network anomalies or attacks with a low false alarm rate. In Section 2, we discuss related works. In Section 3, we introduce concepts needed in the rest of the paper. Section 4 introduces our algorithm. Section 5 presents experimental results. We conclude in Section 6.
2.
RELATED WORK
Many anomaly detection techniques have been developed and evaluated [19, 20, 12] in the last several years but reducing false alarms is still a challenging task in anomaly detection. Eskin et al. [9] analyzed three different algorithms for unsupervised anomaly detection: cluster based estimation, k-nearest neighbor, and one class SVM (Support Vector Machine). Other supervised anomaly detection techniques include ADAM (Audit Data Analysis and Mining) [2], neural networks [18], and SVM [22]. ADAM is a well known on-line network based IDS. It can detect known as well as unknown attacks. It builds the profile of normal behavior from attack-free training data and represents the profile as a set of association rules. It detects suspicious connections according to the profile. Ertoz et. al [8] developed another intrusion detection system known as MINDS using unsupervised anomaly detection techniques and supervised pattern analysis techniques to detect attacks from real network traffic. Density-based outlier detection schemes have been used to detect anomaly behaviour. One such approach presented in [13] uses decision trees to develop a prediction model over normal data to detect anomaly. It exploits data mining techniques to discover consistent and useful patterns of system features that describe program and user behavior. It can recognize anomalies and known intrusions satisfactorily. Babara et. al [1] used pseudo-Bayes estimator to enhance detection of novel attacks. The main advantage of the pseudo-Bayes estimator is that no knowledge about new attacks is needed since the estimated prior and posterior probabilities of new attacks are derived from the normal and known attack instances. A statistical signal processing technique is proposed in [21] based on abrupt change detection to detect anomalies over the network traffic. It provides an outlier detection algorithm for detecting anomalous patterns. To summarize, based on our survey, we observe the following. • Most anomaly detection techniques are based on data mining or statistical approaches. They usually have high false alarm rates. • Only a few algorithms are capable of detecting anomalies from mixed type data. • The existing outlier detection based approaches are often unsuitable for practical use. • Most anomaly detection techniques are based on assumptions such as majority events or traffic records are normal, anomalous events or traffic are attacks, and attack traffic is statistically different from the normal events.
3.
OUTLIERS AND RELATED CONCEPTS
The basic notions of outliers, anomalies, and noise are discussed in this section.
3.1
Anomaly Detection
Anomaly detection refers to the problem of finding nonconforming patterns in data. These patterns are often known as anomalies, outliers, exceptions, surprises, or peculiarities in different application domains. Anomalies and outliers are
two terms used most commonly in the context of anomaly detection, sometimes interchangeably. The importance of anomaly detection is due to the fact that anomalies in data translate to significant, and often critical, actionable information in a wide variety of application domains. For example, an anomalous traffic pattern in a computer network could mean that a hacked computer is sending out sensitive data to an unauthorized destination.
3.2
Outliers and Outlier Detection
An outlier is an abnormal or infrequent event or object that varies from the normal event or object in terms of a distance measure. A network administrator needs to define the abnormal event based on the normal statistics. Outlier detection is the technique to detect the exceptional events from the small or large datasets.
3.3
Outlier Score and its significance
A large number of outlier detection techniques have been proposed in the literature but only some of them have been applied for anomaly identification [17, 23]. The outlier score is a summarized value based on the distance, density or other statistical measures. A reference based outlier score is presented by Pei and Zaiane [14] for detecting outliers in large datasets. The authors estimate outlier score based on distance and degree of nearest neighbour density. The outlier D p (x,k) , where Dp (x, k) is score is ROS(x) = 1 − max D p (x ,k) 1≤i≤n
i
min D(x, k, pr ). 1≤r≤R
Dp (x, k) is the degree of neighbourhood density of the candidate data point x with respect to the set of reference points p, n is the total number of data points, k is a reference based nearest neighbours, and R is the number of reference points. D(x, k, p) is 1 !k |d(x1 ,p)−d(x,p)| , k
j=1
j
where D(x, k, p) is the relative degree of density for x in the one dimensional data space X p and d(x, p) is the distance of x from the reference point p. The candidate data points are ranked according to their relative degrees of density computed on a set of reference points. Outliers are those with high scores. This scheme can discover multiple outliers in larger datasets. However two main limitations of this scheme [14] are: (i) the score does not always vary with the change of candidate data points and (ii) summarizing the data points in terms of scores may not be effective for some attacks. To address these two issues, we propose an enhanced version of [14] and establish its effectiveness considering several real-life datasets, including KDDcup99 intrusion dataset.
4.
NADO : NETWORK ANOMALY DETECTION USING OUTLIER APPROACH
NADO aims to detect anomalous patterns using the outlier approach. It works by identifying reference points and by ranking outlier scores of candidate objects. NADO works in two major steps. The first step applies a variant of the k-means [5] clustering technique to partition the dataset, X into k clusters, viz., C1 , C2 , C3 , · · · Ck . NADO assumes a normality model [16] and considers larger clusters as normal and smaller clusters as outliers. We assume that larger clusters say, C1 , C2 , C3 , · · · Cm are normal and smaller clusters (may include singleton clusters) are outliers or anomalies. Let Si be the number of classes to which each of k# near-
est neighbour data points belongs, where k# is fixed for a particular dataset. Let xi,j be a data point in X and sim(xi,j , Ri,j ) be the distance from the reference point Ri,j to the data point xi,j , where sim is a proximity measure and X represents the whole dataset. NADO is independent of the use of any proximity measure. However, in our experiments, we use Euclidean distance in computing proximity. The outlier score we define is as follows: ROS " (x) = $
1−
max S 1≤i≤k" i k"
min 1≤i≤k"
max
Definition 5. Outliers: An object, Oi can be defined as an outlier w.r.t a cluster Ci iff • ROS # (Oi , µi ) ≥ τ where µi is the profile of Ci and,
×
% % $! " min k sim(xi,j , Ri,j ) × i=1 1≤i≤k" sim(xi,j , Ri,j ) !k " max i=1 1≤i≤k" sim(xi,j , Ri,j ) "
xµ,j is the mean of the j th column of the respective cluster Ci .
Si
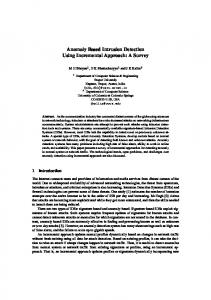
is the maximum probability that a data where, 1≤i≤k k" point belongs to a particular class, the remaining part is the summarized value of similarity measure within k# nearest neighbours. The candidate data points are ranked based on the score. Objects with scores higher than a user defined threshold τ are considered anomalous or outliers. To test effectiveness, we considered seven different cases (illustrated in Figure 1) and the NADO algorithm is capable of identifying all these seven cases. Next, we present some of the
Figure 1: Illustration of seven different cases: N1 and N2 are two normal clusters, O1 is the distinct outlier, O2 , the distinct inlier, O3 , the equidistance outlier, O4 , the border inlier, O5 , a chain of outliers, O6 is another set of outlier objects with higher compactness among the objects and O7 is an outlier case of ”stay together ”. definitions that provide the theoretical basis of the NADO. Definition 1. Data Stream: A data stream X is defined as {x1 , x2 , x3 · · · xn } with n objects where each Xi can be a numeric or categorical attribute represented by a ddimensional vector, i.e., Xi = {xi,1 , xi,2 , xi,3 · · · xi,d }. Definition 2. Pattern Similarity: Two data streams x1 and x2 are defined as similar iff (i) sim(x1 , x2 ) # τ and (ii) 0 if x1 = x2 . Definition 3. Cluster : A cluster Ci is a subset of a data streams xi ’s, where for any pair of m number of elements (xi , xj ) ∈ C, sim(xi , xj ) # τ . Definition 4. Profile: A profile of a cluster Ci is a mean value, µ(xµ,1 , xµ,2 · · · xµ,d ) of data stream Xi,d , where each
• For any other data stream Oj in Ci , sim(Oi , Oj ) > τ . The symbols used to define the score based network anomaly detection algorithm are given in T able 1. Table 1: Symbols used Term X n C Ri Si sim τ Xc µ k# m k
Definition dataset number of data points in X represents the set of clusters represents ith reference point same class occurrence within kth nearest neighbours similarity based on Pearson Corr. Co-efficient threshold value for the outlier score candidate data points mean based profile value w.r.t a cluster number of nearest neighbours represents number of large clusters number of clusters
Clustering is initiated based on a random selection of k centroids. We assign each xi,j object to a particular cluster based on a proximity measure, i.e., sim(X, Y ). We use Euclidean distance as proximity measure. sim can be defined as sim(X, Y ) = !
0 "
(X1 − Y1 )2 + (X2 − Y2 )2 + · · · + (Xn − Yn )2
if X = Y otherwise.
Once cluster formation is over, we calculate the reference points, Ri for each larger cluster (i.e., C1 , C2 , C3 , · · · Ck ). Then we build the mean based profile for each cluster, C1 , C2 , C3 , · · · Ck w.r.t the reference points Ri . Next, we estimate the outlier score for each candidate data points w.r.t the user defined threshold, τ for detecting the anomalies or outliers for all cases discussed above. The ranking of the outliers is based on the score; the outlier with the highest score gets the highest rank and vice versa. But in case of compact outlierness, we calculate the average similarity within the cluster as well as compute the total number of points within a cluster. Based on these values we can detect anomalies or outliers. NADO successfully handles all the defined cases over real and synthetic datasets.
4.1
NADO: The Two Phase Algorithm
The basics of the NADO approach is based on the RODD [6] technique. NADO works in two phases. Let R = {R1 , R2 , R3 , · · · Rk } be the set of reference points of cardinality k. In Phase I, it generates the profiles, µ1 , µ2 , µ3 , · · · µk for the
clusters C1 , C2 , C3 , · · · Ck from the dataset Xi,j . It takes Xi,j , k as input and reports µ1 , µ2 , µ3 , · · · µk as output. The major steps in Phase I are given below. Phase I: Profile Generation
Table 2: Characteristics of various real life datasets Datasets Dimension No. of instances Synthetic 2 1000 Zoo 18 101 Shuttle 9 14500
Number of clusters 5 7 3
No. of Outliers 40 17 13
1. Generate clusters C1 , C2 , C3 , · · · Ck for the dataset Xi,j based on the variant of k-means clustering technique. 2. Calculate reference points Ri , where i = 1, 2, 3, · · · , k for each ok k clusters. 3. Build mean-based profile, µ for each of those k number of clusters. In Phase II, it detects attacks based on the outlier score τ from the testing dataset and it accepts Xci,j , τ as input and returns Oi,j as output. The major steps of Phase II is given belowPhase II: Attack Detection 1. Calculate outlier score, ROS # for each candidate data point, Xci,j . 2. Rank the candidate data points according to the score value. 3. Sort the score values using quick sort and check threshold τ value to report the anomalies or outliers, Oi,j .
5.
EXPERIMENTAL RESULTS
The main goal of the experiments is to apply NADO to anomaly detection as well as to evaluate its capability in detecting outliers and compare it to the current best performing algorithms. To achieve this goal, we have implemented our algorithm and tested with various real world as well as synthetic datasets in the following environment.
5.1
Environment Used
NADO was implemented in HP xw6600 workstation, Intel Xeon Processor (3.00 Ghz) with 4GB RAM. Java 1.6.0 version was used for the implementation in Fedora 9.0 (Linux) platform. Java is used to facilitate the visualization of outlier detection results as well.
5.2
Datasets Used
To evaluate the performance of NADO, we use several synthetic and real life datasets for experimentation. In the first set of experiments, we use three datasets: Synthetic, Zoo and Shuttle [10]. The characteristics of the datasets used in the first set of experiments are given in T able 2. In the second experiment, we use KDDcup99 [11] intrusion dataset for experimentation and the characteristics of this dataset are given in T able 3.
5.3
Results and Discussion
NADO was evaluated using the following two test datasets. Experimental results using two datasets are given below.
Table 3: Distribution of Normal and Attack connections instances in KDDcup99 intrusion datasets Connection type Normal. DoS. Probe. R2L. U2R. Total.
5.3.1
Dataset Training dataset (10% corrected) 97278 19.69% 391458 79.24% 4107 0.83% 1126 0.22% 52 0.01% 494021 -
type Testing dataset (Corrected) 60593 19.48% 229853 73.90% 4166 1.34% 16189 5.20% 228 0.07% 311029 -
Non-network Datasets
NADO was tested initially over a two dimensional synthetic dataset, comprising of 1000 data objects, out of which 4% are outliers or anomalies. Results of NADO both in terms of DR (Detection Rate) and FPR (False Positive Rate) for this dataset are given in the last column of the first row of T able 4. Results of LOF [7] and ORCA [3] are also reported for this dataset in the columns 4 and 5. Similarly, NADO was also evaluated with several other real life datasets [10] such as Zoo and Shuttle and compared. NADO is found to be more effective than the other two algorithms. A general comparison of NADO with the other two algorithms is also given in T able 5. Table 4: Experimental results Datasets Synthetic Zoo Shuttle
Threshold, Effectiveness τ 0.39 DR FPR 0.58 DR FPR 0.47 DR FPR
LOF [7] 0.7500 0.0229 0.8235 0.1904 0.8461 0.0310
ORCA [3] 0.8500 0.0166 0.8823 0.1309 0.7692 0.0241
NADO 1.0000 0.0000 0.9411 0.0238 0.9230 0.0103
τ Selection for Non-network Datasets: We have analyzed the effect of threshold, τ of NADO using the synthetic as well as different real life datasets (i.e., Zoo and Shuttle). The performance of NADO in terms of DR largely depends on the selection of τ value, as can be seen in F igure 2. It is dependent on the dataset used for evaluation. Because each dataset is different from the other in terms of attribute values and dimensions through out them. So, the threshold value is also differ for all to get the best results. However, a most probable range of τ values for the three non-network datasets covered is shown with vertically drawn dashed lines in the F igure 2. In our experiments, the better result is found with τ values in the range of (0.3-0.54) for Synthetic dataset, (0.26-0.69) for Zoo dataset and (0.38-0.57) for Shut-
Table 6: The Confusion matrix of NADO over the KDDcup99 intrusion dataset Connection type normal. R2L. DoS. Probe. U2R. Average.
Evaluation measures Precision Recall
F-measure
Value
normal.
Confusion matrix R2L. DoS.
Probe. U2R
Total.
0.9563% 0.8776% 0.9998% 0.9570% 0.6842% 0.8949%
0.9746% 0.8883% 0.9998% 0.9659% 0.7222% 0.9101%
normal. R2L. DoS. Probe. U2R Total.
57946 1950 35 98 59 60088
2451 14209 0 4 7 16671
87 21 19 3987 1 4115
60593 16189 229853 4166 228 311029
0.9938% 0.8992% 0.9999% 0.9765% 0.7647% 0.9268%
107 9 229799 77 5 229997
2 0 0 0 156 158
Table 7: Comparison of NADO with other techniques over KDDcup99 intrusion dataset Connection type normal. R2L. DoS. Probe. U2R.
C4.5 [4] 94.42% 81.53% 99.97% 94.82% 67.11%
ID3 [4] 87.48% 96.23% 99.86% 95.54% 54.82%
Table 5: Comparison of NADO with its counterparts Algorithms LOF [7] ORCA [3] NADO
Number of parameters (k, M inP ts, M ) (k, n, D) (X, τ )
Complexity (approximate) O(n2 ) O(n2 ) O(kn) + O(Rnlogn)
tle dataset. This estimation is helpful to choose the threshold value τ for experiments.
Figure 2: Detection rate for different threshold values
5.3.2
Intrusion Dataset
Now, we discuss experimental results for KDDcup99 [11] intrusion datasets with NADO. With this dataset, we converted all categorical attributes into numeric form and then computed the logz (ai,j ) of larger values to normalize data points, where z depends on the attribute values and ai,j represents the larger attribute values. Here, we use KDDcup99 10% corrected dataset for training purpose and KDDcup99 corrected dataset for testing purpose during performance analysis. It was evaluated in terms of Precision,
CN2 [4] 87.08% 84.51% 99.93% 95.85% 67.54%
NADO 95.63% 87.76% 99.98% 95.70% 68.42%
Recall, and F-measure and also given a confusion matrix in T able 6. T able 7 reports the comparison of NADO using the intrusion dataset with other similar algorithms. τ Selection for Intrusion Dataset: The performance of NADO for second dataset in terms of precision largely depends on the selection of τ value, as can be seen in F igure 3. The probable range of τ values for each class of attack as well as normal data objects for better results shown with vertical dashed lines in F igure 3. In our experiment, it is found better result of normal as well as each class of attacks with τ values in the range of (0.9-2.3) for normal records and (0.4-1.15) for attack records.
Figure 3: Precision for different threshold values
6.
CONCLUSION AND FUTURE WORK
An effective score-based network anomaly detection using outlier identification approach is introduced in this paper. NADO was evaluated with several real life datasets and the performance has been found better in terms of DR, FPR, and F-measure than the algorithms we have compared it with. The proposed NADO algorithm is advantageous because (i) it is free from the use of any particular proximity measure and (ii) it is sensitive. A critical experimental anal-
ysis of various real life attacks over standard network intrusion datasets (i.e., KDDcup99, DARPA98 and Defcon9) is underway as well.
7.
ACKNOWLEDGMENTS
This work is one of the outcomes of a research project funded by Department of Information Technology, Government of India. Authors are thankful to DIT for funding the project.
8.
REFERENCES
[1] D. Barbara, N. Wu, and S. Jajodia. Detecting novel network intrusions using bayes estimators. In First SIAM Conference on Data Mining, Chicago, IL, 2001. [2] D. Barbarra, J. Couto, S. Jajodia, L. Popyack, and N. Wu. Adam: Detecting intrusions by data mining. In Proceedings of the IEEE Workshop on IAS, pages 11–16, West Point, NY, June 2001. [3] S. Bay and M. Schwabacher. Mining distance-based outliers in near linear time with randomization and a simple pruning rule. In Proc of the ninth ACM SIGKDD, pages 29–38, 2003. [4] R. Beghdad. Critical study of supervised learning techniques in predicting attacks. Information Security Journal: A Global Perspective, 19(1):22–35, 2010. [5] J. C. Bezdek. Pattern Recognition with Fuzzy Objective Function Algorithms. Kluwer Academic Publishers, Norwell, MA, USA, 1981. [6] M. H. Bhyan, D. K. Bhattacharyya, and J. K. Kalita. Rodd : An effective outlier detection technique for large datasets. Accepted for publication in conference proceeding of COSIT’2011 (LNCS-CCIS,Springer). [7] M. M. Breunig, H.-P. Kriegel, R. T. Ng, and J. Sander. Lof: Identifying density-based local outliers. In ACM SIGMOD on Management of Data, pages 386–395, 2000. [8] L. Ertoz, E. Eilertson, A. Lazarevic, P. Tan, J. Srivastava, V. Kumar, and P. Dokas. Next Generation Data Mining, chapter The MINDS-Minnesota Intrusion Detection System. MIT Press, 2004. [9] E. Eskin, A. Arnold, M. Prerau, L. Portnoy, and S. Stolfo. A geometric framework for unsupervised anomaly detection: Detecting intrusions in unlabeled data. Kluwer, 2002. [10] A. Frank and A. Asuncion. UCI Machine Learning Repository [http://archive.ics.uci.edu/ml], 2010. Irvine,CA: University of California, School of Information and Computer Sciences. [11] KDDCUP99. Winning strategy in kdd99. http://kdd.ics.uci.edu/databases/kddcup99/ kddcup99.html, October 28 1999.
[12] Z. Lan, Z. Zheng, and Y. Li. Toward automated anomaly identification in large-scale systems. IEEE Transactions on PDS, 21:174–187, 2010. [13] W. Lee and S. J. Stolfo. Data mining approaches for intrusion detection. In Proceedings of the USENIX Security Symposium. USENIX Association, 1998. [14] Y. Pei, O. R. Zaiane, and Y. Gao. An efficient reference-based approach to outlier detection in large datasets. In Proceedings of the Sixth ICDM, pages 478–487, Washington, DC, USA, 2006. IEEE. [15] D. Pokrajac, A. Lazarevic, and L. J. Latecki. Incremental local outlier detection for data streams. In Proceedings of CIDM, pages 504–515, Honolulu, HI, April 2007. IEEE. [16] L. Portnoy, E. Eskin, and S. Stolfo. Intrusion detection with unlabeled data using clustering. In Proc of ACM CSS Workshop on DMAS, pages 5–8, Philadelphia, PA, 2001. [17] K. Prakobphol and J. Zhan. A novel outlier detection scheme for network intrusion detection systems. In Proceedings of the 2008 International Conference on ISA, pages 555–560, Washington, DC, USA, 2008. IEEE. [18] M. Ramadas, S. Ostermann, and B. Tjaden. Detecting anomalous network traffic with self-organizing maps. In Recent Advances in Intrusion Detection, LNCS, pages 36–54. Springer, 2003. [19] M. L. Shyu, S. C. Chen, K. Sarinnapakorn, and L. Chang. A novel anomaly detection scheme based on principal component classifier. In Proceeding of the IEEE Foundations and New Directions of Data Mining Workshop, pages 172–179, USA, 2003. [20] M. Tavallaee, W. Lu, S. A. Iqbal, and A. A. Ghorbani. A novel covariance matrix based approach for detecting network anomalies. In Proceedings of the Communication Networks and Services Research Conference, pages 75–81, Washington, DC, USA, 2008. IEEE. [21] M. Thottan and C. Ji. Anomaly detection in ip networks. Special Issue of Signal Processing in Networking, IEEE Transactions on Signal Processing, 51(8):2191–2204, August 2003. [22] Q. A. Tran, H. Duan, and X. Li. One-class support vector machine for anomaly network traffic detection. In The 2nd Network Research Workshop of the 18th APAN, Cairns, Australia, 2004. [23] J. Zhang and M. Zulkernine. Anomaly based network intrusion detection with unsupervised outlier detection. In IEEE International Conference on Communications, volume 5, pages 2388 –2393, jun 2006.