Using machine learning to predict DNA read alignment quality Jacob Porter Corresp. 1
1
Biocomplexity Institute, Virginia Tech, Blacksburg, Virginia, United States
Corresponding Author: Jacob Porter Email address:
[email protected]
An empirical understanding of how DNA read features affect read mapping and alignment quality could be useful in designing better read mapping and alignment software, read trimmers, and sequence masks. Many programs appear to use arbitrarily chosen features that are putatively relevant to DNA alignment quality. Machine learning gives a ready way to empirically assess a variety of features and rank them according to their importance. Sequence complexity features such as run length distribution, DUST, and entropy and quality measures from the DNA read data were used to predict read mapping quality on Ion Torrent and Illumina data sets using both bisulfite-treated and untreated short DNA reads. Surprisingly, run length distribution mean and variance did as well or better than DUST and entropy even though several programs use DUST and entropy. Predictive accuracy of the models had F1-scores between 0.5-0.95; thus, the feature set is useful for understanding alignment quality.
PeerJ Preprints | https://doi.org/10.7287/peerj.preprints.27428v1 | CC BY 4.0 Open Access | rec: 13 Dec 2018, publ: 13 Dec 2018
Using Machine Learning to Predict DNA Read Alignment Quality
1
2
3
Jacob S. Porter1
4
1 Biocomplexity
Institute, Virginia Tech, Blacksburg, VA
6
Corresponding author: Jacob S. Porter1
7
Email address:
[email protected]
8
ABSTRACT
5
9 10 11 12 13 14 15 16 17 18
19 20 21 22 23 24 25 26 27 28 29 30 31 32 33 34 35 36 37 38 39 40 41 42 43 44 45 46
An empirical understanding of how DNA read features affect read mapping and alignment quality could be useful in designing better read mapping and alignment software, read trimmers, and sequence masks. Many programs appear to use arbitrarily chosen features that are putatively relevant to DNA alignment quality. Machine learning gives a ready way to empirically assess a variety of features and rank them according to their importance. Sequence complexity features such as run length distribution, DUST, and entropy and quality measures from the DNA read data were used to predict read mapping quality on Ion Torrent and Illumina data sets using both bisulfite-treated and untreated short DNA reads. Surprisingly, run length distribution mean and variance did as well or better than DUST and entropy even though several programs use DUST and entropy. Predictive accuracy of the models had F1-scores between 0.5-0.95; thus, the feature set is useful for understanding alignment quality.
1 INTRODUCTION A DNA read sequencer produces short DNA fragments from an organism, and DNA sequence alignment maps these short DNA reads, which are strings over the nucleic acid bases A, C, T, and G, to a reference genome. This process can be error prone as the short DNA fragments may not match a portion of the reference genome perfectly because of natural variation and mutation or because of sequencing error Porter et al. (2015). Insight into why DNA mapping and alignment fails could lead to more effective alignment software, read trimmers, masking algorithms, and so on. I used machine learning to study which numerical features of short DNA reads are predictive of read alignment quality. These features include metrics of quality, sequence complexity, and sequence content. Data from bisulfite-treated short reads and regular reads was used for the assessment. A challenging read mapping task involves epigenetic cytosine covalent modification. Epigenetic phenomena are heritable biology that does not come from DNA sequence data Allis et al. (2007). One of the most important and well studied epigenetic phenomena is the covalent modification of the cytosine nucleic acid. The 5-carbon of cytosine can be covalently bonded to a methyl, hydroxymethyl Kriaucionis and Heintz (2009), formyl, or carboxylic group Ito et al. (2011). The epigenetic methylation of cytosine plays an important role in disease, development, and gene regulation Holliday and Pugh (1975); Allis et al. (2007). Life experiences such as stress and toxin consumption affect epigenetic phenomena in heritable ways Notterman and Mitchell (2015); Kubota (2016). One way to identify the locations of DNA methylation is to sequence the DNA of an organism after it has been treated with bisulfite and then to identify nucleic acid base locations on a reference genome that differ in such a way as to suggest covalent modification of the cytosine base. Bisulfite converts unmethylated cytosine into thymine after polymerase chain reaction (PCR) amplification. Bisulfite treatment introduces more variation between the short DNA reads and the reference genome, so alignment tasks with bisulfite-treated DNA can be characterized by low alignment quality (< 60% uniquely mapped) Tran et al. (2014). DNA sequence mapping software that is used for regular untreated reads includes Bowtie2 Langmead and Salzberg (2012), BWA Li and Durbin (2009), and BFAST Homer et al. (2009). Mapping software for bisulfite-treated reads must adjust for the bisulfite treatment, and such software includes Bismark Krueger
PeerJ Preprints | https://doi.org/10.7287/peerj.preprints.27428v1 | CC BY 4.0 Open Access | rec: 13 Dec 2018, publ: 13 Dec 2018
48
and Andrews (2011), BWA-Meth Pedersen et al. (2014), and BisPin Porter and Zhang (2018). There are many more examples of these kinds of software.
49
2 RELATED WORK AND MOTIVATION
47
64
Other work has used machine learning to predict methylation loci from DNA reads Zou et al. (2018); Wang et al. (2016); He et al. (2015), DNA age from methylation Vidaki et al. (2017); Naue et al. (2017), and DNA function from DNA sequence identity Libbrecht and Noble (2015). My own study found that Shannon entropy corresponds to read alignment categories Porter et al. (2015). A study found that genome complexity relates to read mapping quality Phan et al. (2015), but my study examines reads rather than genomes. A good sequence complexity measure could be useful for read trimming, read alignment, and read masking software. Machine learning will help to select which measure of sequence complexity is more predictive of read alignment performance. Some read trimming, masking, or filtering software uses sequence complexity Porter and Zhang (2017); Starostina et al. (2015). The bisulfite software BatMeth has a low complexity filter using Shannon entropy Lim et al. (2012), and BLAST can use a sequence complexity mask with the DUST score Morgulis et al. (2006); Altschul et al. (1990). The sequence complexity measures chosen for these programs appear to be arbitrarily chosen or chosen for convenience. A thorough evaluation of such measures with machine learning gives an empirical rationale for the choice of the sequence complexity measure.
65
3 METHODS
50 51 52 53 54 55 56 57 58 59 60 61 62 63
66 67 68 69 70 71 72
3.1 Data Acquisition and Read Mapping Six data sets of three million reads each were downloaded from the sequence read archive (SRA) Leinonen et al. (2010) at https://www.ncbi.nlm.nih.gov/sra. This data represents a variety of bisulfite-treated and regular short DNA reads. A DNA read is a string over the alphabet {A,C, T, G, N} corresponding to the nucleotide bases and the N wildcard character. The data includes quality information that gives the probability that the base was called correctly. The data includes DNA reads generated from the Illumina platform and the Ion Torrent platform. Table 1 shows a summary of the data. Table 1. Summary of the DNA Read Data. SRA # ERR2562409 SRR1104850 SRR5144899 SRR1534392 SRR2172246 ERR699568
73 74 75 76 77 78 79 80 81 82 83 84 85
Type 1 BS BS BS BS Reg Reg
Platform Illumina Illumina Illumina Ion Torrent Illumina Ion Torrent
Read Size 90 200 100 Varies 76 Varies
Genome Mouse Human Human Mouse Human Mouse
One or two read mapping and alignment programs were used to map and align each data set to the reference genome. A version of the reference genome was downloaded from the NCBI (National Center for Biotechnology Information) data store at https://www.ncbi.nlm.nih.gov/genome. Table 2 indicates which read mapping programs were used with which data set. This implies that eleven alignment files were created to do machine learning. For bisulfite-treated Illumina reads, BisPin Porter and Zhang (2018) and Bismark Krueger and Andrews (2011) were used on their default settings. A primary and secondary index was used with BisPin with rescoring turned off. Bismark is a popular read mapper for bisulfite-treated reads, and it uses Bowtie2 Langmead and Salzberg (2012) to do alignments. BisPin is a versatile read mapper that has good accuracy with a variety of data Porter and Zhang (2018). Bismark did not return any mapped reads for data set SRR1104850, so only BisPin was used there. This was probably because the reads were too long for Bismark. For Illumina regular untreated reads, BFAST (BLAT-like Fast Accurate Search Tool) Homer et al. (2009) and Bowtie2 Langmead and Salzberg (2012) were used. 2/10
PeerJ Preprints | https://doi.org/10.7287/peerj.preprints.27428v1 | CC BY 4.0 Open Access | rec: 13 Dec 2018, publ: 13 Dec 2018
Table 2. Read Mappers Used for Each Data Set. SRA # ERR2562409 SRR1104850 SRR5144899 SRR1534392 SRR2172246 ERR699568
86 87 88 89 90
91 92 93 94 95 96 97 98 99 100 101 102 103 104 105 106
Read Mappers BisPin, Bismark BisPin BisPin, Bismark BisPin, Tabsat BFAST, Bowtie2 BFAST-Gap, TMAP
For bisulfite-treated Ion Torrent reads, BisPin and Tabsat were used. BisPin was used with default settings appropriate to Ion Torrent reads as found in Porter and Zhang (2018). Tabsat Pabinger et al. (2016) uses Bismark’s Perl code and the Ion Torrent read mapper TMAP (Torrent Mapping Alignment Program https://github.com/iontorrent/TMAP). For regular untreated Ion Torrent reads, BFAST-Gap Porter and Zhang (2018) and TMAP were used. TMAP was used with the map4 algorithm. 3.2 Feature and Class Extraction Feature extraction. For each DNA read, 67 numerical features were created that comprised sequence complexity, read content, and quality. Reads with N’s in them were excluded from the analysis as their presence interferes with the sequence complexity measures; however, N’s are highly relevant to read mapper performance as an N means an ambiguous nucleotide base that can match to any nucleotide base in the reference genome. The sequence complexity features included run length metrics, DUST, entropy, DKG, RKG, Bzip2 compressibility, and LZMA compressibility. The run length distribution was computed. A run is a substring of the DNA string comprised of the same base. The length of the run is the number of bases in that run. For example, “AATCCC” has a length 2 run of A’s, a length 1 run of a T, and a length 3 run of C’s. The mean, variance, and maximum of this distribution were used as features. The DUST score is a sequence complexity metric based on tri-nucleotide frequency Morgulis et al. (2006). Given that a is a sequence of n characters from A = {A,C, T, G}, a triplet is a substring of length 3, and there are 64 possible triplets. The space of triplets is R. There are n − 2 non-unique triplets in a for n > 2. If ct (a) is the number of times triplet t occurs in a, then the DUST score is ∑t∈R ct (a)(ct (a) − 1)/2 . n−3
107 108 109 110
The DUST score was normalized to be between 0 and 1 by dividing it by (n−2)(n−3)/2 , the maximum n−3 DUST score. Shannon entropy Shannon and Weaver (1949) is a sequence complexity measure common in machine learning. If fb (a) is the frequency of character b in sequence a, then entropy is given by −
∑
fb (a) log2 ( fb (a)).
b∈A 111 112 113 114 115
For each b ∈ A , the base frequency fb (a) was included as a feature. This captures sequence content related features. The metrics DKG and RKG are found in Phan et al. (2015). The function g(x) gives the number of times that the substring x occurs in a. DKG measures the rate of distinct substrings. Given a number k for the substring length, DKG is defined as Dk (a) =
116
|{x : g(x) > 0 | |x| = k, x ∈ a}| . |a| − k + 1
RKG measures the rates of repeats, and it is 3/10
PeerJ Preprints | https://doi.org/10.7287/peerj.preprints.27428v1 | CC BY 4.0 Open Access | rec: 13 Dec 2018, publ: 13 Dec 2018
Rk (a) = 117 118 119 120 121 122 123 124 125 126 127 128 129 130 131 132 133 134 135 136
∑g(x)>1,|x|=k g(x) . |a| − k + 1
RKG and DKG for k = 2, 3, 4, 5 were used. These metrics can be computed in linear time and space using suffix arrays Phan et al. (2015). The Bzip2 and LZMA implementations in Python3 were used to measure the compressibility of the DNA sequence. The number of bytes returned by the compression algorithms was divided by the length of the uncompressed sequence to get a compressibility metric. Quality related features were computed from the probability measures given with the DNA reads. This included the mean, variance, skewness, maximum, and minimum. Since the probabilities are arranged in a sequence, the difference between each probability was computed, and these values were averaged and included as a feature. The preceding features were computed for the whole read. For each third of the DNA sequence, each of the preceding features except for DKG, RKG and the run length metrics, were computed and included in the feature set as well. Label extraction. This problem was modeled as a classification problem since every read mapping program gives some indication of read alignment uniqueness. There are at least four mapping classes possible: uniquely mapped, ambiguously mapped, unmapped, and filtered. A read is uniquely mapped if the read mapping software reports that there is a unique best scoring alignment for that read. A read is ambiguously mapped if there are multiple best scoring locations. An unmapped read maps to no location, and a filtered read has an alignment score below some program specific threshold. Not every read mapper reports every class, so some classes were excluded for some read mappers. The classes that each read mapper reports is given in Table 3. Table 3. Read Mapping Classes for Each Read Mapper. Read Mapper BisPin , BFAST, BFAST-Gap Bismark, Tabsat Bowtie2, TMAP
137 138
139 140 141 142 143 144 145 146 147 148 149 150 151 152 153 154 155 156 157
Mapping Classes Unique, Ambig, Unmapped, Filtered Unique, Ambig, Unmapped Unique, Ambig
The filter threshold for BisPin, BFAST, and BFAST-Gap was set to 45 for Illumina reads and 75 for Ion Torrent reads since that was found to work well in a previous study Porter and Zhang (2018). 3.3 Machine Learning Methods Python3 with scikit-learn 0.19 Pedregosa et al. (2011) was used to do the machine learning. Three machine learning classifiers were used to assess predictive accuracy: random forests (RF), multi-layer perceptron neural networks (MLP), and logistic regression (LR). A random forest is an ensemble of decision trees. At each level in the tree, a value for a feature is used to split the level. The leaves are labeled with classes. An MLP is a neural network with hidden layers that linearly combine previous layers and apply an activation function. The ReLU activation function was used. The output of the network is a vector of probabilities for each class. Logistic regression is a binary statistical model that uses a log-odds ratio. It was used with the l2 norm. A binary problem was used for each class, and the class with the maximum probability was reported as the predicted class. Bayesian optimization with scikit-optimize (https://scikit-optimize.github.io/) was used to do hyperparameter tuning with three-fold cross-validation. Bayesian optimization strategically selects a point in the hyperparameter space based on the performance of previously selected hyperparameters Snoek et al. (2012). The GP-hedge acquisition function was used, and twenty-five iterations were performed. Random forest hyperparameters max depth and max features were optimized. After some initial experiments, a MLP architecture with four hidden layers of size 30, 20, 15, and 10 was chosen, and the regularization parameter alpha was optimized. Logistic regression uses a C regularization parameter that was optimized. 4/10
PeerJ Preprints | https://doi.org/10.7287/peerj.preprints.27428v1 | CC BY 4.0 Open Access | rec: 13 Dec 2018, publ: 13 Dec 2018
169
A random classifier was trained. This classifier learns the proportion of classes in the training data and simply guesses a class with probability equal to the proportion that it learned for that class. This classifier was used to determine if the other three classifiers had a predictive accuracy better than random guessing. The three million reads for each dataset was divided into 2.5 million training examples used in three-fold cross-validation. The remaining approximately 500,000 reads were held-out as test data to assess model predictive performance. In some cases, fewer than 500,000 reads were used since reads with N’s were excluded from the analysis. Cohen’s kappa metric was used for model selection since it is supposed to perform better than accuracy with rare classes Cohen (1960). Precision, recall, and the F1-score (the harmonic mean of precision and recall) were computed for each class for each data set. These were used to assess predictive performance on the held-out test data. The source code for this project can be found at https://github.com/JacobPorter/ AlignmentML.
170
4 RESULTS
158 159 160 161 162 163 164 165 166 167 168
171 172 173 174 175
4.1 Model Accuracy The F1-score was computed for each class, and then each class’s F1-score was averaged to assess model predictive performance. These results are presented in Table 4. All models performed better than random guessing. Random forest models always had the highest F1-score, and logistic regression was generally the worst with the slowest training time. The MLP had the fastest training time of the three. Table 4. Average Class F1-score for Each Data Set. Data ERR2562409 ERR2562409 ERR699568 ERR699568 SRR1104850 SRR1534392 SRR1534392 SRR2172246 SRR2172246 SRR5144899 SRR5144899
176 177 178 179 180 181 182 183 184 185
186 187 188 189 190 191
Software Bismark BisPin BFAST-Gap TMAP BisPin BisPin Tabsat BFAST Bowite2 Bismark BisPin
Class 2 UAN UANF UANF UA UANF UANF UAN UANF UA UAN UANF
Rand 0.40 0.41 0.86 0.87 0.52 0.59 0.68 0.34 0.84 0.65 0.72
RF 0.94 0.95 0.91 0.92 0.77 0.82 0.88 0.53 0.92 0.81 0.85
MLP 0.84 0.85 0.90 0.91 0.77 0.73 0.84 0.51 0.90 0.80 0.82
LR 0.80 0.81 0.90 0.91 0.74 0.72 0.80 0.49 0.90 0.79 0.81
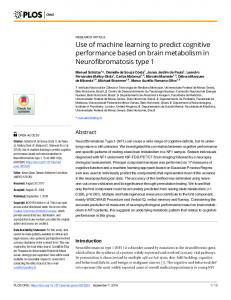
Predictive accuracy was generally good for uniquely mapped reads and poor for ambiguously mapped reads. Predictive accuracy for unmapped and filtered reads ranged from poor to fair. The number of uniquely mapped reads could be as high as approximately 90% of the data, and other classes could only be a few percent of the data. This makes non-unique classes rare classes and difficult to predict. An example of precision, recall, and F1-score by class is shown in Table 5. Throughout this project, precision was generally better than recall, and Ambig was the class that was generally the hardest to predict. This may be because the ambiguously mapped class may have sequence complexity intermediate between uniquely mapped and unmapped Porter et al. (2015) reads making the difference more difficult to distinguish. Ambiguously mapped reads may be a result of repetition in the genome Schmid and Deininger (1975); Deininger (2011) that can’t be detected from examining the read alone. 4.2 Feature Importance Random forest feature importance was used to rank the features since the random forest models had the best predictive performance. This gives a ranking of features from most important to least important according to the model. This ranking was computed for each of the eleven data sets, and the distribution of ranks for each feature was computed. Figure 1 gives a box plot of these distributions for all of the features that used the entire read. 5/10
PeerJ Preprints | https://doi.org/10.7287/peerj.preprints.27428v1 | CC BY 4.0 Open Access | rec: 13 Dec 2018, publ: 13 Dec 2018
Table 5. Precision, Recall, F1-Score by Class for SRR5144899 Bismark. Class Unique Ambig Unmap
Precision 0.851 0.657 0.775
Recall 0.974 0.133 0.473
F1-Score 0.909 0.221 0.587
Support 393343 36771 69094
Figure 1. Feature importances for all of the data. For each data set and each read mapper, random forest feature rank importances were calculated, and the distribution of rank for each feature was used to make the box plot.
6/10 PeerJ Preprints | https://doi.org/10.7287/peerj.preprints.27428v1 | CC BY 4.0 Open Access | rec: 13 Dec 2018, publ: 13 Dec 2018
192 193 194 195 196 197 198 199 200 201 202 203 204 205 206 207 208 209 210 211 212 213
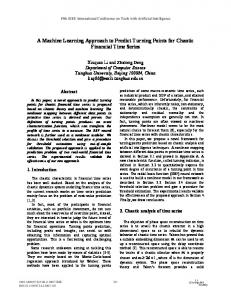
Surprisingly, run length variance and run length mean were among the most important and performed a bit better than entropy and DUST. This is interesting since several programs use DUST, such as BLAST Morgulis et al. (2006); Altschul et al. (1990), and entropy Porter and Zhang (2017); Lim et al. (2012). Perhaps if these measures of sequence complexity replaced DUST or entropy, programs that use them would perform better. Character frequency features were of good importance but not as important as DUST and entropy. DKG and RKG performed more poorly; however, DKG(2) was very important for the data ERR2562409 as it was ranked the most important with an average importance confidence 0.251, which was larger by 0.174 on average than the next best feature, the largest difference of its kind. Perhaps DKG is more useful for some data sets. Compressibility measures were the worst average performing sequence complexity metrics. LZMA was the worst on average with a mean rank of 51.45. However, the Bzip2 feature from the first third of the sequence had the highest rank on the SRR1534392 data with BisPin, and LZMA in the second third of the sequence had the highest rank for the SRR1534392 data with Tabsat. Quality metrics were generally not as important as sequence complexity metrics. The quality mean was the most important of these, and quality skewness, maximum, and minimum had the lowest importance of all features. Since four of the six data sets were for bisulfite-sequencing reads, there could be a bias favoring bisulfite read mapping. Thus, the same feature rank analysis was performed with only the regular untreated data. The feature rank box plots for this data can be found in Figure 2. The order of features is very similar, but DUST does a little better beating the run length metrics. The quality mean is a bit lower in the rankings.
Figure 2. Feature importances for the regular untreated data.
214 215 216 217 218 219
In Illumina data sets, features from the last third generally had a higher importance than features in the first or second thirds of the read sequence. Features from the second third were generally more important than features from the first third. This may be because there is often lower quality in the last third of a read since Illumina sequencing technology can make more errors in later cycles Buermans and Den Dunnen (2014). In Ion Torrent data, features from each third were generally more evenly distributed in the top 15 most important features. 7/10
PeerJ Preprints | https://doi.org/10.7287/peerj.preprints.27428v1 | CC BY 4.0 Open Access | rec: 13 Dec 2018, publ: 13 Dec 2018
234
4.3 Feature Ranking Similarity Across Different Data There is weak evidence that the feature importance ranking depends more on the read mapper than the data set. This conclusion was drawn by looking at Kendall’s tau coefficient for feature rankings across different data. Kendall’s tau coefficient is used to measure how similar two ordered sequences are Kendall (1938). It ranges from 1.0 to -1.0. A 1.0 means the sequences are identical, and a -1.0 means that the sequences are the reverse of each other. Kendall’s tau coefficient and p-value was computed using scipy. The feature importance ranking for both read mappers for the same SRA number was used to calculate Kendall’s tau. Only ERR2562409 and ERR699568 had p-values below 0.1. All tau’s were positive. The highest was for ERR699568 at 0.308, and the lowest was for SRR5144899 at 0.0276. Both data sets come from bisulfite-treated Illumina reads. The feature importance ranking for all data mapped with BisPin was compared with SRR1104850 since it was mapped only with BisPin. In all cases, tau was larger than in the previous analysis. This suggests that read mapper feature rankings correlate better than feature rankings based on the same data set but mapped by different programs. This suggests that there is some program-specific qualities of feature performance and data set specific qualities are less important.
235
5 CONCLUSIONS
220 221 222 223 224 225 226 227 228 229 230 231 232 233
248
My study showed that sequence complexity measures are important in predicting the read mapping quality of short DNA reads. Read quality metrics were less important. Run length mean and variance, DUST, and entropy were the best performing sequence complexity measures. Bioinformatics programs may consider using run length statistics instead of or in addition to DUST and entropy because they were among the best features. Without knowledge of the genome, and only knowledge of the DNA read, machine learning models, especially random forests, were able to predict alignment quality with surprisingly good accuracy approaching F1-scores of 0.95 in some cases. The features that work well on regular untreated reads tended to work well on bisulfite reads as well. This suggests that sequence complexity measures that work well in one application will probably work well in other applications. Future work could include training a regressor to predict the alignment score rather than alignment categories; however not all programs (such as Bismark) report such a score.
249
REFERENCES
236 237 238 239 240 241 242 243 244 245 246 247
250 251 252 253 254 255 256 257 258 259 260 261 262 263 264 265 266 267 268 269 270
Allis, C. D., Jenuwein, T., Reinberg, D., and Caparros, M.-L. (2007). Epigenetics. Cold Spring Harbor Laboratory Press Cold Spring Harbor, NY. Altschul, S. F., Gish, W., Miller, W., Myers, E. W., and Lipman, D. J. (1990). Basic local alignment search tool. Journal of Molecular Biology, 215(3):403–410. Buermans, H. and Den Dunnen, J. (2014). Next generation sequencing technology: advances and applications. Biochimica et Biophysica Acta (BBA)-Molecular Basis of Disease, 1842(10):1932–1941. Cohen, J. (1960). A coefficient of agreement for nominal scales. Educational and psychological measurement, 20(1):37–46. Deininger, P. (2011). Alu elements: know the sines. Genome biology, 12(12):236. He, J., Sun, M.-a., Wang, Z., Wang, Q., Li, Q., and Xie, H. (2015). Characterization and machine learning prediction of allele-specific DNA methylation. Genomics, 106(6):331–339. Holliday, R. and Pugh, J. E. (1975). DNA modification mechanisms and gene activity during development. Science, 187(4173):226–232. Homer, N., Merriman, B., and Nelson, S. F. (2009). BFAST: An alignment tool for large scale genome resequencing. PLOS One, 4(11):e7767. Ito, S., Shen, L., Dai, Q., Wu, S. C., Collins, L. B., Swenberg, J. A., He, C., and Zhang, Y. (2011). TET proteins can convert 5-methylcytosine to 5-formylcytosine and 5-carboxylcytosine. Science, 333(6047):1300–1303. Kendall, M. G. (1938). A new measure of rank correlation. Biometrika, 30(1/2):81–93. Kriaucionis, S. and Heintz, N. (2009). The nuclear DNA base 5-hydroxymethylcytosine is present in Purkinje neurons and the brain. Science, 324(5929):929–930. 8/10
PeerJ Preprints | https://doi.org/10.7287/peerj.preprints.27428v1 | CC BY 4.0 Open Access | rec: 13 Dec 2018, publ: 13 Dec 2018
271 272 273 274 275 276 277 278 279 280 281 282 283 284 285 286 287 288 289 290 291 292 293 294 295 296 297 298 299 300 301 302 303 304 305 306 307 308 309 310 311 312 313 314 315 316 317 318 319 320 321 322 323 324 325
Krueger, F. and Andrews, S. R. (2011). Bismark: A flexible aligner and methylation caller for Bisulfite-Seq applications. Bioinformatics, 27(11):1571–1572. Kubota, T. (2016). Epigenetic alterations induced by environmental stress associated with metabolic and neurodevelopmental disorders. Environmental Epigenetics, 2(3). Langmead, B. and Salzberg, S. L. (2012). Fast gapped-read alignment with Bowtie 2. Nature Methods, 9(4):357. Leinonen, R., Sugawara, H., Shumway, M., and Collaboration, I. N. S. D. (2010). The sequence read archive. Nucleic Acids Research, 39(suppl 1):D19–D21. Li, H. and Durbin, R. (2009). Fast and accurate short read alignment with Burrows–Wheeler transform. Bioinformatics, 25(14):1754–1760. Libbrecht, M. W. and Noble, W. S. (2015). Machine learning applications in genetics and genomics. Nature Reviews Genetics, 16(6):321. Lim, J.-Q., Tennakoon, C., Li, G., Wong, E., Ruan, Y., Wei, C.-L., and Sung, W.-K. (2012). BatMeth: Improved mapper for bisulfite sequencing reads on DNA methylation. Genome Biology, 13(10):R82. Morgulis, A., Gertz, E. M., Sch¨affer, A. A., and Agarwala, R. (2006). A fast and symmetric DUST implementation to mask low-complexity DNA sequences. Journal of Computational Biology, 13(5):1028– 1040. Naue, J., Hoefsloot, H. C., Mook, O. R., Rijlaarsdam-Hoekstra, L., van der Zwalm, M. C., Henneman, P., Kloosterman, A. D., and Verschure, P. J. (2017). Chronological age prediction based on dna methylation: Massive parallel sequencing and random forest regression. Forensic Science International: Genetics, 31:19–28. Notterman, D. A. and Mitchell, C. (2015). Epigenetics and understanding the impact of social determinants of health. Pediatric Clinics, 62(5):1227–1240. Pabinger, S., Ernst, K., Pulverer, W., Kallmeyer, R., Valdes, A. M., Metrustry, S., Katic, D., Nuzzo, A., Kriegner, A., Vierlinger, K., et al. (2016). Analysis and visualization tool for targeted amplicon bisulfite sequencing on Ion Torrent sequencers. PloS one, 11(7):e0160227. Pedersen, B. S., Eyring, K., De, S., Yang, I. V., and Schwartz, D. A. (2014). Fast and accurate alignment of long bisulfite-seq reads. arXiv preprint arXiv:1401.1129. Pedregosa, F., Varoquaux, G., Gramfort, A., Michel, V., Thirion, B., Grisel, O., Blondel, M., Prettenhofer, P., Weiss, R., Dubourg, V., Vanderplas, J., Passos, A., Cournapeau, D., Brucher, M., Perrot, M., and Duchesnay, E. (2011). Scikit-learn: Machine learning in Python. Journal of Machine Learning Research, 12:2825–2830. Phan, V., Gao, S., Tran, Q., and Vo, N. S. (2015). How genome complexity can explain the difficulty of aligning reads to genomes. BMC Bioinformatics, 16(17):S3. Porter, J., Sun, M.-a., Xie, H., and Zhang, L. (2015). Investigating bisulfite short-read mapping failure with hairpin bisulfite sequencing data. BMC Genomics, 16(11):S2. Porter, J. and Zhang, L. (2017). InfoTrim: A DNA read quality trimmer using entropy. In Computational Advances in Bio and Medical Sciences (ICCABS), 2017 IEEE 7th International Conference on, pages 1–2. IEEE. Porter, J. and Zhang, L. (2018). BisPin and BFAST-Gap: Mapping bisulfite-treated reads. bioRxiv, page 26. Schmid, C. W. and Deininger, P. L. (1975). Sequence organization of the human genome. Cell, 6(3):345– 358. Shannon, C. E. and Weaver, W. (1949). The Mathematical Theory of Communication. University of Illinois Press. Snoek, J., Larochelle, H., and Adams, R. P. (2012). Practical Bayesian optimization of machine learning algorithms. In Advances in Neural Information Processing Systems, pages 2951–2959. Starostina, E., Tamazian, G., Dobrynin, P., O’Brien, S., and Komissarov, A. (2015). Cookiecutter: a tool for kmer-based read filtering and extraction. bioRxiv, page 024679. Tran, H., Porter, J., Sun, M.-a., Xie, H., and Zhang, L. (2014). Objective and comprehensive evaluation of bisulfite short read mapping tools. Advances in Bioinformatics, 2014:11. Vidaki, A., Ballard, D., Aliferi, A., Miller, T. H., Barron, L. P., et al. (2017). DNA methylation-based forensic age prediction using artificial neural networks and next generation sequencing. Forensic Science International: Genetics, 28:225–236. Wang, Y., Liu, T., Xu, D., Shi, H., Zhang, C., Mo, Y.-Y., and Wang, Z. (2016). Predicting DNA
9/10 PeerJ Preprints | https://doi.org/10.7287/peerj.preprints.27428v1 | CC BY 4.0 Open Access | rec: 13 Dec 2018, publ: 13 Dec 2018
326 327 328 329 330
methylation state of CpG dinucleotide using genome topological features and deep networks. Scientific Reports, 6:19598. Zou, L. S., Erdos, M. R., Taylor, D. L., Chines, P. S., Varshney, A., Parker, S. C., Collins, F. S., Didion, J. P., et al. (2018). BoostMe accurately predicts DNA methylation values in whole-genome bisulfite sequencing of multiple human tissues. bioRxiv, page 207506.
10/10 PeerJ Preprints | https://doi.org/10.7287/peerj.preprints.27428v1 | CC BY 4.0 Open Access | rec: 13 Dec 2018, publ: 13 Dec 2018