SAI Intelligent Systems Conference 2016 September 21-22, 2016 | London, UK
Using Machine Learning to Predict Length of Stay and Discharge Destination for Hip-Fracture Patients Mahmoud Elbattah
Owen Molloy
National University of Ireland Galway
[email protected]
National University of Ireland Galway
[email protected]
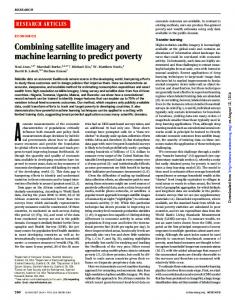
I. INT RODUCT ION A pronounced growth of the ageing population has been witnessed in Ireland. The Health Service Executive (HSE) reported that the number of people aged over 65 is increasing by 20K per year approximately [33]. Figure 1 plots the expected projections of elderly population in Ireland from 2016 to 2026. As a result, an insightful planning is increasingly needed in order to become abreas t of that ongoing demographic shift. In this respect, machin e learning presents as a practical method for building prediction models that can support the planning of healthcare services. The study particularly focused on the treatment of hip fracture for elderly patients. Hip fractures were considered for having a two-fold significance. On one hand, hip fractures represent an appropriate exemplar of elderly care schemes. An ample number of studies [34-36] recognised that hip fractures increase exponentially with ageing, though rates may vary from one country to another. Around 3K patients per year are recorded to sustain hip fractures [37] in Ireland. Unfortunately, that figure may unavoidably increase due to the mounting trend of population ageing. On the other hand, hip-fracture injuries were labelled as one of the most serious traumas that cause lengthy in-patient stay, and high costs of treatment [38].
1400000 1200000 1000000 800000 600000 400000 200000 0
2026
2025
2024
2023
2022
2021
2020
2019
2018
2017
2016
Population
Abstract— Faced with the challenge of population ageing, healthcare providers are increasingly in need for evidencebased artefacts to support the decision making process. In this regard, the paper avails of machine learning techniqu e s in a bid to support the elderly care planning with application to hip fracture care in Ireland. S pecifically, the inpatient length of stay (LOS ), and discharge destination are aime d to be predicted based on learning from patient historical data. The accuracy of various regression and classification techniques was investigated. Random Forests proved to provide a considerable higher accuracy in comparison to other algorithms in our case. The prediction models were trained using the Azure Machine Learning S tudio. Furthermore, the models were published as predictive web services on top of the Azure cloud platform. The developed predictors are claimed to make predictions on the LOS and discharge destinations with high accuracy. Keywords—Machine Learning; Random Forests; Healthcare Decision Making; Hip Fracture.
Year
60-65
66-84
85+
Fig.1. Projections of elderly population in Ireland (2016-2026) [39].
II. M OT IVAT ION The paper aimed to avail of machine learning in order to predict important care-related outcomes based on patient historical data. In particular, we investigated how machine learning can be utilised to predict the following: The inpatient length of stay of elderly patients. Discharge destinations of elderly patients. III. A PPLICATION DOMAIN This section provides a brief background of the application domain under study. The patient’s journey for hip-fracture treatment is composed of three main stages as follows: i) Admission, ii) Assessment and Treatment, and iii) Outcome. The journey typically starts from an admission source, (e.g. home, or nursing home). Usually, the patient is initially admitted at the emergency department. Subsequently, the patient should be received at the orthopaedic ward. According to [22], it was stressed that the primary surgery should be performed within 48 hours from admission, which can be an indicator of the care quality as well. Elderly patients usually undergo a number of assessments after surgery, which largely depends on the fragility history of each patient. Eventually, the patient is discharged to home or, a long-stay care facility (e.g. nursing home, or rehabilitation institute). Figure 2 sketches the patient journey from admission to discharge.
1|P age
SAI Intelligent Systems Conference 2016 September 21-22, 2016 | London, UK A.Outliers Removal According to [2], the mean and median LOS for hipfracture patients were reported as 19 and 12.5 days respectively. In view of that, we only considered patients who experienced LOS no longer than 40 days to mitigate the adverse influence of outliers. The excluded outlier records represented about 8% of the dataset. Figure 3 plot s the LOS histogram showing the position of outliers.
Fig. 2. T he elderly patient journey through hip fracture care.
The study focused on developing predictive models fo r the inpatient LOS and discharge destination. In this regard , both of the LOS and discharge destination represent a vit al importance within healthcare s chemes. According to numerous studies [10-12], the LOS was suggested as a significant measure of patient outcomes. Further, other studies (e.g. [13]) argued that there was an evident correlation between the LOS and discharge destination. From an operational perspective, the LOS was recognised as a valid proxy to measure the consumption o f hospital resources [14-17]. Further, it was reported [18] that the LOS represents a major segment of the overall cost of hip fracture treatment. Similarly, the early prediction of patient discharge destinations can be of a strategic significance in order to estimate the desired capacity of long-stay care facilities (e.g. hospices, and nursing homes). In light of that, the study is claimed to carry potential benefits for healthcare executives by providing accurate models that are capable of predicting the LOS and discharge destination. IV. DAT A DESCRIPT ION The study used a dataset obtained from the Irish Hip Fracture Database (IHFD) [1]. The IHFD data repository was developed to serve as a national clinical audit that captures care standards and outcomes particularly for patients who sustain hip fractures in Ireland. Rich information is recorded within the IHFD records, which describe the treatment journey of a patient from admission to discharge. Specifically, a single patient record typically contains 38 data fields including age, gender, type of fracture, and LOS. The acquired dataset comprised about 2K records about hip-fracture patients, aged 60 and over, discharged in 2013. The data used for model training represented about 60% o f the whole dataset. V. DAT A A NOMALIES The existence of data anomalies underlying datasets is largely unavoidable. In its simplest definition, a data anomaly can be considered as any deviation that makes data unsuitable for the intended use [4]. To put it in more detailed words, a data anomaly is as an observation that seems to be inconsistent with the rest of the dataset [3]. In this section, we delineate the data anomalies explored within data, and the procedures performed to tackle them.
Fig. 3. T he LOS histogram. The outliers can be clearly spotted when the inpatient stay becomes longer than 40 days.
B.Dealing with Data Imbalances Learning with imbalanced datasets was continuously recognised as one of the principal challenges for machine learning [7, 8]. The negative impacts of imbalanced data on the prediction accuracy were emphasised by numerous studies (e.g. [5, 6]). In our case, the training data also suffered from imbalanced class distributions , where a particular class pre-dominated the dataset. For instance, minority samples emerged where the LOS was longer than 20 days. Likewise, imbalanced samples happened to exist within discharge destinations. Figure 4 demonstrates the histograms of LOS and discharge destination, where imbalanced distributions can be observed.
(a)
(b)
Fig. 4. T he histograms of LOS and discharge destination. I mba la nc e d distributions can be obviously observed within LOS and discharge destination as well.
Study [8] identified two categories of strategies in order to deal with the imbalance problem including: i) Algorithm-level approach and, ii) Data-level approach (e.g. under-sampling, or over-sampling methods). In this regard, the over-sampling technique [9] was used prior to model training. As such, the underrepresented samples were randomly re-sampled until they become sufficiently balanced with those well-represented.
2|P age
SAI Intelligent Systems Conference 2016 September 21-22, 2016 | London, UK VI. LEARNING A LGORIT HM: RANDOM FOREST S The study adopted a unified approach using Random Forests for classification and regression as well. Introduced by Leo Breiman [19], Random Forests are a combination of tree predictors such that each tree depends on the values of a random vector sampled independently and with the same distribution for all trees in the forest. In other words, a Random Forest is composed of an ensemble of randomly trained decision trees [20]. During training phase, all trees are trained independently. While testing, predictions are made through weighted voting on the most confident predicted class. The trees that have a higher prediction confidence will have a greater weight in the final decision of the ensemble. The aggregation of voting can be done b y a simple averaging operation as follows [21]: 𝑝( 𝑐|𝑣 ) =
1 𝑇
selection. Figure 6 and Figure 7 present the selected features for each predictor, and their associated importance scores. T ABLE 2. VARIABLES EXPLORED AS POTENTIAL FEATURES. Variables Explored Source Hospital Admission T ype Discharge Code Patient Sex Residence Area Discharge Status Admission Source Hospital Transferred From Hospital Transferred T o LOS Age ICD-10 Diagnosis Admission T rauma Type Admission via ED Pre-Fracture Mobility Fracture T ype Fragility History Specialist Falls Asessment Multi-Rehabilitation Assessment
𝑇
∑ 𝑝𝑡 (𝑐|𝑣)
Host Hospital
𝑡 =1
, where p t (c|v) denotes the posterior distribution obtained by the t-th tree. Figure 5 illustrates a simple example of a random forest consisting of 3 decision trees .
Age
ICD-10 Diagnosis Residence Area Fracture Type Patient Sex
Fragility History 0
0.2
0.4
0.6
0.8
Fig. 6. LOS Predictor: Importance of selected features sorted in increasing order.
Host Hospital Fig. 5. Random Forest example: Combining predictions using the mean.
Random Forests compare favourably against other techniques, and were proved to provide high accuracy, robustness to noise and stability [19-22]. In addition, the efficiency of Random Forests was evidently demonstrated in a wide range of applications including bioinformatics [23], ecology [24], and economics [25]. In this study, two Random Forests were developed for predicting the LOS, and discharge destination using regression and multi-clas s classification models respectively. Table 1 presents the parameters used for training the Random Forests. The Azure Machine Learning [26] was used for developing the predictive models. T ABLE 1. PARAMETERS OF RANDOM FORESTS. Number of De cision Trees Maximum De pth of Decision Trees Number of Random Splits per Node
8 32 128
VII. FEAT URE SELECTION The dataset initially included 38 variables, however not all of them were considered as features for training the models. On one hand, some obviously irrelevant features were excluded prior to model training. Further, the permutation importance method [28] was used to decide the most influential features to be included. Table 2 lists the variables explored during the process of feature
Age LOS Residence Area Sex 0
0.1
0.2
0.3
0.4
0.5
Fig. 7. Discharge Destination Predictor: Importance of selected featur es sorted in increasing order.
VIII. EXPERIMENTAL RESULT S The accuracy of the machine learning models was examined using a subset of the IHFD dataset. The test dataset was randomly sampled, representing about 40% of the overall dataset. A 10-fold cross-validation was applied in order to estimate the prediction error of both models. Table 3 presents the regression model accuracy used to predict t h e LOS. Figure 8 delineates the confusion matrix of the classifier model. Moreover, Table 4 and Table 5 provide a comparative analysis with respect to the learning algorithms experimented to develop the regression and classification models.
3|P age
SAI Intelligent Systems Conference 2016 September 21-22, 2016 | London, UK T ABLE 3. AVERAGE ACCURACY OF THE REGRESSION MODEL BASED ON 10- FOLD CROSS-VALIDATION.
X. LIMIT ATIONS OF T HE ST UDY In a truthful disclaimer, we acknowledge the limitations of the study as follows: The IHFD dataset included records related to public acute hospitals only. The IHFD dataset may have under-represented some of Ireland’s geographic regions. The study used a dataset that covered a single year only (i.e. 2013). Owing to the lack of information on specific patient discharge destinations, the classification model did not separate between nursing homes and other long-stay care facilities (e.g. rehabilitation institutions), XI. CONCLUSIONS
Fig. 8. Average accuracy of the classifier model based on 10-fold crossvalidation. T ABLE 4. PREDICTION ACCURACY: REGRESSION TECHNIQUES. Relative Absolute Error (≈) 0.26 0.34 0.55 0.93
Re gression Te chnique Random Forests Boosted Decision Tree Neural Network Linear Regression
T ABLE 5. PREDICTION ACCURACY: CLASSIFICATION TECHNIQUES. Classification Te chnique
Precision (≈)
Recall (≈)
Random Forests Neural Network Logistic Regression
0.88 0.71 0.61
0.87 0.72 0.60
O verall Classification Accuracy (≈) 0.88 0.72 0.62
The prediction models were published as predictive web services delivered by the Azure platform.The models can be tested online via http://predictiontest.apphb.com. IX. RELAT ED W ORK The usage of machine learning techniques within the context of healthcare was largely applied. The literature contains a plethora of studies (e.g. [29-32]) that utilised machine learning-based methods to predict the length of stay. For instance, decision trees and Naive Bayesian classifiers were trained to a geriatric hospital dataset in order to predict inpatient LOS [29]. Likewise, the study [32] conducted a comparison between supervised machine learning techniques for predicting short-term LOS for diabetic patients. However, it was noticed that the literature lacked studies utilising machine learning with respect to the hip fracture care scheme, to the best of our knowledge.
The developed predictive models show promising practical benefits for accurately predicting care outcomes for elderly patients who undergo hip fracture care in Ireland. Using Random Forests, the study developed a regression and classification models to predict the inpatient length of stay (LOS), and discharge destination respectively. In this regard, Random Forests proved to outperform other methods for both of the classification and regression tasks. A set of further observations can be drawn in view of the computed importance of selected features. Specifically, it turned out that the location-based features, such as “Host Hospital”, had a significant importance while predicting both of the LOS and discharge destinations. The pronounced influence of location-based features may be considered as an indicator to the existence of a site-to-site variation. In other words, it may be assumed that an underlying “locality effect” was experienced within care sites in Ireland. The locality effect can be attributed to variations of human-based factors, or other facility-based issues. However, that assumption cannot be confidently confirmed due to the relatively small dataset used by the study, which represented only a single year. REFERENCES [1] [2] [3] [4] [5] [6]
[7]
[8]
https://www.noca.ie/irish-hip-fracture-database, accessed on 01/03/2016. https://www.noca.ie/wp-content/uploads/2015/11/IHFD-NationalReport-2014-Online-Version.pdf. Hodge, V.J. and Austin, J., 2004. A survey of outlier detection methodologies. Artificial Intelligence Review, 22(2), pp.85-126. Sarsfield, S., 2009. T he data governance imperative. IT Governance Publishing. Japkowicz, N. and Stephen, S., 2002. The class imbalance problem: A systematic study. Intelligent data analysis, 6(5), pp.429-449. Sun, Yanmin, Andrew KC Wong, and Mohamed S. Kamel. "Classification of imbalanced data: A review." International Journal of Pattern Recognition and Artificial Intelligence 23, no. 04 (2009): 687-719. Yang, Q. and Wu, X., 2006. 10 challenging problems in data mining research. International Journal of Information Technolo gy & Decision Making, 5(04), pp.597-604. Galar, Mikel, Alberto Fernandez, Edurne Barrenechea, Hum be r to Bustince, and Francisco Herrera. "A review on ensembles f o r t he class imbalance problem: bagging-, boosting-, and hybrid-based
4|P age
SAI Intelligent Systems Conference 2016 September 21-22, 2016 | London, UK
[9]
[10]
[11]
[12]
[13]
[14]
[15]
[16]
[17]
[18]
[19] [20]
[21]
[22] [23]
approaches." Systems, Man, and Cybernetics, Part C: Applications and Reviews, IEEE T ransactions on 42, no. 4 (2012): 463-484. Japkowicz, N., 2000, July. Learning from imbalanced data set s: a comparison of various strategies. In AAAI workshop on lear ning from imbalanced data sets (Vol. 68, pp. 10-15). O'Keefe, G.E., Jurkovich, G.J. and Maier, R.V., 1999. Defining excess resource utilization and identifying associated f acto rs f o r trauma victims. Journal of Trauma and Acute Care Surgery, 46(3) , pp.473-478. Englert, J., Davis, K.M. and Koch, K.E., 2001 . Using clinical practice analysis to improve care. Joint Commissio n Jo ur n al o n Quality and Patient Safety, 27(6), pp.291-301. Guru, V., Anderson, G.M., Fremes, S.E., O’Connor, G.T ., Grover, F.L., T u, J.V. and Consensus, C.C.S.Q.I., 2005. T he identificatio n and development of Canadian coronary artery bypass graft surgery quality indicators. T he Journal of thoracic and cardiovascular surgery, 130(5), pp.1257-e1. Brasel, K.J., Lim, H.J., Nirula, R. and Weigelt, J.A., 2007. Len gth of stay: an appropriate quality measure?. Archives of Surgery, 142(5), pp.461-466. Millard, Peter H., and Sally I. McClean, eds. Modelling h o sp ital resource use: a different approach to the planning and co ntr ol o f health care systems. Royal Society of Medicine Press, 1994. Faddy, M. J., and S. I. McClean. "Analysing data on lengths of stay of hospital patients using phase‐type distributions." Applied Stochastic Models in Business and Industry 15, no. 4 (1999): 311317. Marshall, A. H., and S. I. McClean. "Conditional phase‐type distributions for modelling patient length of stay in hospital." International T ransactions in Operational Research 10, no. 6 (2003): 565-576. Fackrell, Mark. "Modelling healthcare systems wit h p h ase - type distributions." Health care management science 12, no. 1 ( 2 009 ): 11-26. Johansen, A., Wakeman, R., Boulton, C., Plant, F., Roberts, J. an d Williams, A., 2013. National Hip Fracture Database: National Report 2013. Clinical Effectiveness and Evaluation Un it at t he Royal College of Physicians. Breiman, Leo. "Random forests." Machine learning 45, no. 1 (2001): 5-32. Criminisi, A., J. Shotton, and E. Konukoglu. "Decision forests f o r classification, regression, density estimation, manifold learning and semi-supervised learning." Microsoft Research Cambridge, T ech. Rep. MSRT R-2011-114 5, no. 6 (2011): 12. Criminisi, Antonio, and Jamie Shotton, eds. Decision f or ests f or computer vision and medical image analysis. Springer Scien ce & Business Media, 2013. Liaw, Andy, and Matthew Wiener. "Classification and regr essio n by randomForest." R news 2, no. 3 (2002): 18-22. Jiang, Hongying, Youping Deng, Huann-Sheng Chen, Lin T ao, Qiuying Sha, Jun Chen, Chung-Jui T sai, and Shuanglin Zhang. "Joint analysis of two microarray gene-expression data sets to select lung adenocarcinoma marker genes." BMC bioinformatics 5, no. 1 (2004): 1.
[24] Prasad, Anantha M., Louis R. Iverson, and Andy L iaw. " Newe r classification and regression tree techniques: bagging and ra n do m forests for ecological prediction." Ecosystems 9, no. 2 (2006): 181199. [25] Larivière, Bart, and Dirk Van den Poel. "Predicting customer retention and profitability by using random forests and regre ssion forests techniques." Expert Systems with Application s 2 9, n o. 2 (2005): 472-484. [26] Barga, R., Fontama, V. and T ok, W.H., 2015. Predictive Analytic s with Microsoft Azure Machine Learning. [27] British Orthopaedic Association and British Geriatric Society,TheCare of Patients with Fragility Fracture (“Blue Book”), BritishOrthopaedic Association and BritishGeriatric Society, London,UK, 2007. [28] Altmann, A., T oloşi, L., Sander, O. and Lengauer, T ., 2010. Permutation importance: a corrected feature importance me a sur e . Bioinformatics, 26(10), pp.1340-1347. [29] Liu, Peng, Lei Lei, Junjie Yin, Wei Zhang, Wu Naijun, and Elia ElDarzi. "Healthcare data mining: predicting inpatient length of stay." (2006): 832-837. [30] Hachesu, Peyman Rezaei, Maryam Ahmadi, Somayyeh Aliza de h, and Farahnaz Sadoughi. "Use of data mining techniques to determine and predict length of stay of cardiac patients." Healthcare informatics research 19, no. 2 (2013): 121-129. [31] Azari, Ali, Vandana P. Janeja, and Alex Mohseni. "Healthcare Data Mining: Predicting Hospital Length of Stay (PHLOS)." International Journal of Knowledge Discovery in Bioinfo rm atic s (IJKDB) 3, no. 3 (2012): 44-66. [32] Morton, April, Eman Marzban, Georgios Giannoulis, Ayush Patel, Rajender Aparasu, and Ioannis A. Kakadiaris. "A Compar ison o f Supervised Machine Learning T echniques for Predictin g Sh o r t T erm In-Hospital Length of Stay Among Diabetic P atie nts. " I n Machine Learning and Applications (ICMLA), 2014 13th International Conference on, pp. 428-431. IEEE, 2014. [33] Health Service Executive. Annual Report and Financial Statements 2014, 2014. [34] Cooper, Campion, G. Campion, and LJ1992 Melton III. "Hip fractures in the elderly: a world-wide projection. " Ost e opo ro sis international 2, no. 6 (1992): 285-289. [35] Melton, L. J. "Epidemiology of hip fractures: implications o f t he exponential increase with age." Bone 18, no. 3 (1996): S121-S125. [36] Gullberg, B., O. Johnell, and J. A. Kanis. "World-wide projections for hip fracture." Osteoporosis international 7, no. 5 (1997): 4 0 7 413. [37] Ellanti, Prasad, Breda Cushen, Adam Galbraith, Louise Brent, Conor Hurson, and Emer Ahern. "Improving Hip Fracture Care in Ireland: A Preliminary Report of the Irish Hip Fracture Database. " Journal of osteoporosis 2014 (2014). [38] http://www.hse.ie/eng/services/publications/olderpeople/Executive _Summary__Strategy_to_Prevent_Falls_and_Fractures_in_Ireland%E2%80%9 9s_Ageing_Population.pdf [39] http://www.cso.ie/en/statistics/population/
5|P age