School Of Computer Science .... Our second criterion is response to the Harris corner detec- tion filter ... ming the response to a Harris corner detection filter over.
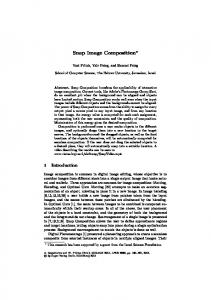
USING NATURAL IMAGE PROPERTIES AS DEMOSAICING HINTS Ido Omer, Michael Werman School Of Computer Science The Hebrew University Of Jerusalem, Israel {idom,werman}@cs.huji.ac.il ABSTRACT Most digital cameras use filter arrays to sample red, green, and blue according to the Bayer pattern or similar ones. At each pixel only one color sample is taken and the values of the other colors must be interpolated from neighboring samples. This color interpolation is known as demosaicing. One of the main problems in demosaicing is that it is not always clear how to use information from one channel in order to enhance another. As a result, in highly detailed image regions all the efficient demosaicing algorithms tend to fail. In this article we suggest using natural image properties to enhance the demosaicing in those regions. 1. INTRODUCTION In recent years, digital cameras are rapidly taking the place of film cameras. Unlike film based cameras, in which every point in the image (pixel) is sampled along 3 (or more) different wavelength ranges, most digital cameras sample the scene in a single wavelength range at each pixel (usually using red, green or blue filters). The missing color components are then interpolated from neighboring samples. This color interpolation is known as demosaicing. The demosaicing process has a crucial effect on the quality of the final image. Erroneous demosaicing usually results in highlyvisible color artifacts in detailed image regions. The most commonly used color filter pattern is the Bayer pattern [1], shown in Figure 1. In the Bayer pattern, green samples are arranged in a checkerboard pattern, and red and blue samples are arranged on rectangular lattices. The sample density of the green channel in this pattern is double the density of the red and blue ones. The main reason is that green samples are considered better luminance estimators, since the wavelength of green light is nearer to the center of the visible spectrum. Naive, single channel, demosaicing schemes such as nearestneighbor replication, bilinear interpolation, and cubic spline interpolation usually produce poor results in non smooth regions of an image and are rarely used. Most practical de-
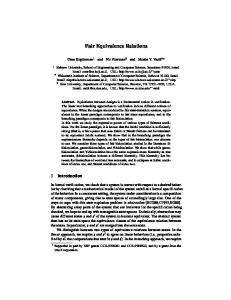
Fig. 1. Bayer color filter array. mosaicing approaches try to exploit inter channel information. Many of these algorithms interpolate the green channel as a first step, either bilinearly [2, 3] or using gradient based methods [4, 5, 6, 7] that try to avoid interpolation across edges. After interpolating the green channel, these algorithms estimate the red and blue channels under the assumption that the color of neighboring pixels is similar. The estimation is usually done by minimising differences in the RGB ratios between neighboring pixels. Other algorithms [8] interpolate color differences and not color ratios. These algorithms work well as long as they are able to calculate the gradient for the green channel correctly (or for the red/blue channels in the case of [8]). In spite of this, there are places, in which the sample rate of neither of the channels is high enough [9, 10] and although the information lies within the image mosaic, the sample rate of no single channel is sufficient for describing the image details. It is not clear how one should combine information in this case in order to produce a satisfying result. An example can be found in Figure 2. Methods like the optimal recovery demosaicing [11] address this problem by learning the gradients in a large image region at the price of considerable computation time. This paper suggests a method of exploiting natural image properties for estimating the correct gradient direction in image regions in which a single channel is not sufficient
for the recovery of the signal. We define demosaicing hints that helps us to automatically distinguish a good demosaicing from a poor one and suggest a generic demosaicing algorithm that uses these hints to improve the results of many existing demosaicing schemes. Section 2 describes our algorithm. In Section 3 we introduce demosaicing hints, the natural image properties we use for evaluating the demosaicing results. Section 4 discusses the implementation details and presents some results. We summarize and conclude in Section 5.
that first estimates the missing green values and then completes red and blue ones. The algorithm outline is shown in Algorithm 1. Algorithm 1 Generic Demosaicing Algorithm 1. Store two copies of the image mosaic, H and V. 2. Calculate “Difficult missing samples” mask. 3. Estimate the ”simple” missing green samples according to Algorithm A (for both H and V). 4. Estimate the difficult missing green sample twice, once according to its horizontal neighbors (store in H) and once according to its vertical ones (store in V). 5. Partition the Difficult missing samples mask into regions (according to spatial adjacency). 6. Calculate color variation and corner scores for each difficult region in H and V).
Fig. 2. Part of the mosaic produced from the lighthouse image (Figure 7.a). The image provides a good example of the difficulty in estimating missing samples. It is not clear whether the missing green samples should be interpolated using vertical or horizontal neighbors. In the red and blue channels the situation is even worse, since the sample rate is not high enough to even capture the fact that the region contains high frequencies.
2. DEMOSAICING ALGORITHM
Fig. 3. Calculating the Difficult Regions mask. We devised a simple generic demosaicing algorithm that exploits natural image properties for the detection of erroneous demosaicing results. Our Algorithm can be used to enhance any existing demosaicing algorithm Algorithm A
7. Combine H and V by taking the region that scores better according to our criteria in each of the difficult regions (in the rest of the image, H and V are identical).
Our algorithm first calculates the “Difficult Regions” mask - a mask containing the regions where traditional gradient based demosaicing methods tend to fail. A missing green sample is treated as difficult to estimate if its estimated horizontal gradient is similar to its estimated vertical one, yet the estimated green value according to the horizontal neighbors significantly differs from the estimated green value according to the vertical ones. Figure 3 shows a part of an image mosaic. gm is the missing green value. The estimated horizontal gradient is |gl −gr | and the estimated vertical gradient is |gu −gd |. The estimated missing green value according to the horizontal neighbors is (gl + gr )/2 while the estimation according to the vertical neighbors is (gu + gd )/2 (We refer here to a naive gradient based demosaicing scheme, the actual gradient calculation and missing green sample estimation might be slightly different, depending on the demosaicing algorithm). We now divide the Difficult Regions mask into components simply by slicing it into eight by eight regions. For each such component, that contains difficult pixels, we calculate a score according to our demosicing hints and choose The algorithm can be extended to an arbitrary number of directions, although the structure of the Bayer CFA (Color Filter Array) prefers estimations made according to horizontal or vertical neighbors, the sample rate of the filter is minimal in the horizontal and vertical directions. For simplicity,
throughout the paper we will only discuss the case of horizontal and vertical completion. 3. DEMOSAICING HINTS We use two natural image properties for distinguishing between a correct demosaicing and an erroneous one. Our first criterion is a least color variation and the second is minimal corner value. 3.1. Least Color Variation Criterion Assuming the laws of colorimetry [12], two pixels sharing the same hue, but differing in intensities, will have the same R/G/B ratio. This assumption is true in the case of digital sensors which have a nearly linear response to light, and since all of the color enhancement is done only after the demosaicing is completed in the camera pipeline, this assumption is correct in our case.
(a)
(b)
(c)
(d)
Fig. 4. Figure (a) A part of the original image (sampled in all 3 channels). (b) The mosaic produced for this part. (c) Demosaicing using horizontal neighbors (erroneous demosaicing), (d) Demosaicing using vertical neighbors (correct demosaicing). Our algorithm uses the assumption that Intensity variation in images is larger than color variation. According to this assumption, in regions with high frequency, we should restore the missing samples of the green channel in a way that minimizes the variation of the R/G/B channels between pixels in the region. A good example of this is found in figure 4. Figure (a) shows details of the often used lighthouse image. Figure (b) is the mosaic produced by sampling the image according to the Bayer pattern. Figure (c) shows the result of demosaicing the image using a simple gradient based scheme and supporting the sample using horizontal neighbors. Figure (d) shows the result of demosaicing the image using the same gradient based scheme but supporting the sample using vertical neighbors. As a rule of thumb, some of the image details are lost during demosaicing (considering the fact that our samples are not dense enough for describing the signal and that the demosaicing process is imperfect). This results in lower than expected color variation in the demosaiced image compared to the original image. We measured the color variation of the Figures (a), (c) and (d) by
summing the variance of the R/G ratio and the B/G ratio. For the original image(a), the color variance is 130.6, for the erroneous demosaiced image (c) the variance is 335.4 (higher than the true variance in the scene), whereas for the correctly demosaiced image (d) the variance is 29.5 (lower than the true variance in the scene). 3.2. Minimal corner value criterion Our second criterion is response to the Harris corner detection filter [13]. In natural images edges are sparse and corners are much sparser [14]. Since we assume highly detailed regions will contain many edges, we grade the demosaicing results according to the response to a corner detection filter alone (and not an edge detector). Due to zippering, erroneous demosaicing very often yields many false corners as described in [15], we therefore grade the results by summing the response to a Harris corner detection filter over the region. The lower the score, the better the demosaic (less corners).
(a)
(b)
(c)
(d)
Fig. 5. Figure (a) Details of the original image (corner score = 39485). (b) The Difficult Regions mask calculated for this region. (c) Demosaicing using vertical neighbors (correct demosaicing, corner score = 39584), (d) Demosaicing using horizontal neighbors (erroneous demosaicing, corner score = 52087).
4. IMPLEMENTATION AND RESULTS We implemented a very basic gradient based demosaicing algorithm and enhanced it using our generic algorithm. For evaluating our demosaicing criteria, we created image mosaics from images sampled in all 3 channels (scanned film images). For each of the image mosaics, our algorithm generated four products, the difficult regions mask, the image H (where difficult missing samples were estimated according to horizontal neighbors), the image V and the combined image (combined by the algorithm using the demosaicing criteria). Whenever our algorithm chooses the difficult region from H or V that is closer to the original image (in terms of MSE) we say it has made a correct choice. We checked the percentage of correct choices our algorithm has made for a variety of images (Figure 7) using first the color variation demosaicing hint alone, then the corners demosaicing hint alone, and finally both hints together. The results are shown
in Figure 1. It is clear from the table that each of the demosaicing criteria lead to choices that are better than random ones (fifty percent for a correct choice), yet the best results are usually achieved by combining both criteria. We gave equal weight to both criterion (color and corner) although the table shows one might put more emphasis on the color criteria which produces better results. Figure 6 shows how the algorithm correctly chose the difficult regions from images H or V according to the demosaicing criteria in the construction of the combined image C. Nevertheless, our algorithm results are only as good as the gradient based algorithm we use is. In our experiments we implemented a very simple gradient based algorithm and using a better algorithm will yield still better results. 5. SUMMARY AND CONCLUSIONS We introduced demosaicing hints, novel criteria for distinguishing a good demosaicing from a poor one. We then used these criteria for the development of a generic demosaicing algorithm. This generic algorithm can be easily adapted to improve many existing demosaicing algorithms by enhancing their performance in regions where most of them tend to produce poor results. Nevertheless, the results produced by this generic algorithm are bound by the limitations of the basic demosaicing scheme it uses.
Fig. 6. The above example shows how the algorithm correctly chose the appropriate region from the horizontal (H) or vertical (V) completions and combined them in the output image (C)
6. REFERENCES [1] B. E. Bayer, “Color imaging array,” July 1976, U.S. Patent 3 971 065. [2] D. R. Cok, “Signal processing method and apparatus for producing interpolated chrominance values in a sampled color image signal.,” Feb. 1987, U.S. Patent 4 642 678. [3] J. A. Weldy, “Optimized design for a single-sensor color electroniccamera system.,” in Proc. SPIE, 1988, number 1071, pp. 300–307. [4] R. H. Hibbard, “Apparatus and method for adaptively interpolating a full color image utilizing luminance gradients.,” Jan. 1995, U.S. Patent 5 382 976. [5] J. E. Adams and J. F. Hamilton Jr., “Adaptive color plane interpolation in single color electronic camera,” Apr. 1996, U.S. Patent 5 506 619. [6] R. Kimmel, “Demosaicing: Image reconstruction from color ccd samples,” IEEE Transactions on Image Processing, vol. 8, pp. 1221–8, Sept. 1999. [7] R. M. Mersereau B. K. Gunturk, Y. Altunbasak, “Color plane interpolation using alternating projections,” IEEE Transactions on Image Processing, vol. 11, pp. 997–1013, Sept. 2002. [8] C. A. Laroche and M. A. Prescott, “Apparatus and method for adaptively interpolating a full color image utilizing chrominance gradients,” Dec. 1994, U.S. Patent 5 373 322. [9] H. Nyquist, “Certain topics in telegraph transmission theory,” 1924. [10] C. E. Shannon, “Communication in the presence of noise,” 1949. [11] T. W. Park D. D. Muresan, “Optimal recovery demosaicing,” in Proc. IASTED Signal and Image Processing, 2002. [12] M. Chapron, “A new chromatic edge detector used for color image segmentation,” in Proc. IEEE International Conference on Pattern Recognition, 1992, pp. 311–314. [13] C. J. Harris and M. Stephens, “A combined corner and edge detector,” in Proc. 4th Alvey Vision Conference, 1988, pp. 147–151. [14] A. Levin A Zomet and Y. Weiss, “Learning to perceive transparency from the statistics of natural scenes,” in Proc. Advances in Neural Information Processing Systems (NIPS), Dec. 2002.
[15] T.W Hirakawa, K. Parks, “Adaptive homogeneitydirected demosaicing algorithm,” in Proc. IEEE International Conference on Image Processing, Sept. 2003, vol. 3, pp. 669–672.
(a)
(a-mask)
(b)
(b-mask)
(c)
(c-mask)
(d)
(d-mask)
(e)
(e-mask)
(f)
(f-mask)
(g)
(g-mask)
(h)
(h-mask)
Fig. 7. Images used for evaluating the demosaicing criteria, each shown with its Difficult Regions mask.
Image a b c d e f g h AVG.
Color 69% 74% 80% 76% 72% 77% 86% 67% 75%
Corners 63% 57% 71% 43% 66% 57% 57% 60% 59%
Combined 74% 72% 83% 73% 75% 77% 83% 71% 76%
Table 1. Percent of correct decision made by the algorithm according to the different criteria.