Factor analysis of items from the 6 psychometric scales isolated a ... Visual Analytics in the Context of the Organization .... predictive of performance in the quite different situation ..... Journal of Consulting and Clinical Psychology ,56, 1988, pp.
Using Personality Factors to Predict Interface Learning Performance Tera Marie Green1
1
Dong Hyun Jeong1
Brian Fisher1
2
School of Interactive Arts and Technology Simon Fraser University
Charlotte Visualization Center University of North Carolina at Charlotte
Abstract
dependent upon it, but the path taken by cognition as a whole [1]. Numerous studies have been undertaken in recent years to evaluate visualizations. Plaisant has outlined 4 current categories of evaluation: controlled experiments comparing design elements, usability evaluations of tools, controlled between-visualization comparisons, and tool case studies [2]. Each type of evaluation serves a purpose, but is self-limiting in multiple ways. As is often the case with experimentation generally, these evaluations involve small, simple, sometimes normative or “non-realworld” tasks; interaction in the real world tends to more complex, harder to predict, and thus harder to measure. Additionally, these evaluations focus on the more binary of cognitive processes. In each case, the cognitive variables measured are facets of vision, given attention, and perhaps tactile manipulation. These variables are indeed important. But these evaluations are not designed to answer one pivotal question: The human has possession of the target information. Now what? Perhaps because humans learn so readily, we tend to take the supporting cast of cognition for granted. The visualization literature discusses this in a roundabout way, inferring reasoning and problem-solving from perceptual behaviors. But there is a general belief in the centrality of learning to visualization, as is evidenced by the continuing discussion about what insight is and how to engender it during interaction [3,4]. The question is not whether learning occurs, but how and when. These questions have yet to be tackled by visualization evaluation. One reason these questions remain unanswered is the complexity of the cognition involved. Reasoning and problem-solving are not uniformly sequential, but rather utilize a variety of heuristics, which can be worked singly or in congress with others [1]. Which heuristics are used first or most often depends largely on the task and the individual characteristics of the person undertaking the task. (See also [5,6]) As evaluators, we can control what specific task is
This current study explored the impact of individual differences in personality factors on interface interaction and learning performance in both an interactive visualization and a menu-driven web application. Participants were administered 6 psychometric measures designed to assess trait anxiety, locus of control, and other personality traits. Participants were then asked to complete 3 procedural tasks and 3 inferential tasks in each interface. Results demonstrated that participants with an external locus of control completed inferential tasks more quickly than those with an internal locus. Factor analysis of items from the 6 psychometric scales isolated a 9-item short measure, which showed trending with procedural scores. Additionally, data demonstrated that the visualization interface was more effective and efficient for the completion of the inferential tasks. Participants also preferred the visualization to the web interface for both types of task. Implications and future directions of this research are also discussed.
1. Introduction The successful visualization of complex information relies fundamentally on its ability to stimulate human cognition. Humans see what’s visualized, emphasize information of interest through focused attention and elimination heuristics, and interact with representations of relational knowledge to reach a goal or complete a task that the human has chosen but that the visualization must facilitate. Each facet of human cognition engaged while using a visualization needs consideration; cognitive processes are typically is not linear, and perception, categorization, and problem-solving activities inform and motivate each other throughout the interaction. The loss or impediment of one cognitive process hampers or stymies not only the other thought processes
Submitted to 2009 Hawaii International Conference on System Sciences, Digital Content: Content and Communication, Visual Analytics in the Context of the Organization
undertaken, but what about the variability within the person? Current evaluative methods in visualization are limited in that they ignore this variability. Evaluation focuses on the differences in and between visualizations but tends to treat the persons interacting with the visualization as somehow standardized. This may be an acceptable assumption with regard to basic sensory transduction (however even here there are significant individual differences in color and stereo perception), but it fails altogether as we move to higher-order cognitive processes. One would expect, for example, an expert artist to have chosen their profession based on (perhaps native) abilities in image composition, color perception, innovative use of graphics. One would also expect that those abilities would be further developed in the course of their artistic training and practice. Recognizing the institutional and innate differences, not only between novice and expert, but also between users with varying innate personality factors is key to moving past these evaluative limitations. In the case of an expert user of visualization environments, we might expect a-priori individual differences in ability that might be focused and trained through experience in their craft and in the use of a given set of technologies. Any model of the human-computer analytic system must find a way to assess, classify, and incorporate measures of those human characteristics to inform the development and evaluation of visual analytics systems. The comparative uniformity of basic perception (e.g. color space) limits the impact of individual differences to pathological cases (such as dichromacy). Spatial indexing, focused attention and reasoning processes interact with the user’s individual differences in ways that might well obscure or confound analysis of the impact of changes in technological support for those processes in HCI or other evaluative studies. Individual differences in how problems are approached can also affect beliefs and goals when a user is engaged in goal-oriented behaviors [7]. When we evaluate visualizations that people use, we must also understand the built-in learning “presets” of the individual user; it is possible that a visualization that seems intuitive for one subgroup or expert domain could seem a wilderness for another. Often visualization is assumed to be preferable to more traditional types of interface for learning and/or the extension of knowledge. But how is it preferable, and for what types of learning? The science of learning is not generic. This study utilizes two tasks
that touch on two broad genres of learning: procedural and inference. Both genres have broad records in the human behavioral literatures, and represent two very different types of knowledge creation and use. Procedural learning, broadly defined, is the “knowing how” of any sequential task. It is sometimes called skill learning, as it is the learning most common to motor and iterative tasks that require repetition to master [8]; it is also referred to as script learning, which captures the idea that there is a “recipe” or “roadmap” to be followed. Riding a bike, brushing your teeth, or following a cooking recipe are all very simple examples of procedural learning. Procedural learning is thought to be either top-down (i.e. CLARION) [8], or, more commonly, to be bottom up, first assimilating the necessary declarative facts and then the use of that information into the deconstruction of the task procedure [9]. Procedural learning, due in part to repetition, can become “automatic,” requiring little conscious focus. Inference learning, again broadly, is the ability to draw a conclusion from available data or define a concept in terms of its similarity/dissimilarity to another. Categorization and classification are important building blocks of inference, and inference is used in a variety of reasoning, including induction, deduction, and comparison [11]. In this study, we study inference by providing an exemplar, and asking participants to find another example that shares/does not share a variety of characteristics. Humans use inferences when we decide whether a four-legged creature is a dog, when we decide whether we will like the new restaurant based on our experiences with others, and when we read body language to understand whether a person is telling a joke or being serious. Inference learning, unlike procedural learning, does not lend itself to automaticity, and, when complex, involves sustained attention, problem-solving, a variety of reasoning heuristics, and decision-making. This study was designed to explore 3 broad research questions. The first question was whether one interface would prove to be more efficient than the other in the performance of procedural tasks. Previous literature comparing motor movement between menu-driven and visualization interfaces [11] leads us to hypothesize there will be no significant difference between mean procedural task completion times. The second question was whether one interface would prove to be more efficient and more effective than the other in the performance of inferential tasks;
Submitted to 2009 Hawaii International Conference on System Sciences, Digital Content: Content and Communication, Visual Analytics in the Context of the Organization
it was hypothesized that the tasks undertaken in the visualization would have shorter completion times overall and would be more likely to be answered correctly than tasks undertaken in the web application. The third question was whether the whole scores on one or more of the 6 standard psychometric measures, or some combination of the measures’ items would have a significant relationship to the outcome variables in both the procedural and inferential tasks; it was hypothesized that, given the interrelationship between these constructs, one or more constructs would be found to predict completion times and/or error rates in both interfaces. To isolate individual differences, we chose to use existing measures of human attitudes and abilities that have shown to have explanatory value in a range of applications in cognitive, personality and social psychology. It would be surprising, but not impossible, that one of these scales might be strongly predictive of performance in the quite different situation of problem-solving using a visualization system. It is more likely that some novel combination of these psychologically important measures may interact in an interesting way with performance measures on these tasks. We hope that this work will pave the way for the development of new scales that assess an individual’s “personal equation” of interaction [12] with visually-rich information systems. This measure can be used in selecting and training of users and customization of systems as well as a factor to take into account in the development and assessment process.
2. Comparative Study The current study employed 50 participants, all of whom were undergraduate students enrolled in an introductory psychology course; all received course credit for their participation. The participants reported being students in 23 different majors, with the majority reporting a business-related (administration, finance, etc.) academic concentration. Most (47) had taken fewer than 4 laboratory biology courses. Most (44) were righthanded. Only one reported being color-blind. Most (46) reported being comfortable or very comfortable using a computer; 44 reported their computer ability to be “OK” or “Very good.” All 50 reported having used a web application previously; 16 claimed to having used a data visualization in the past.
2.1 Interfaces
This study asked participants to interact with two genomic interfaces. Both interfaces were fed by the same underlying dataset (GenBank). What differed between the interfaces was the presentation of data and interaction methodology. One interface is the web-based National Center for Biotechnology Information (NCBI) MapViewer for genomic information, which is publically available and can currently be found at http://www.ncbi.nlm.nih.gov/ mapview. MapViewer utilizes a multiple-row-based hierarchical representation and is manipulated through primary use of hyperlinks. (See Figure 1.) The use of traditional menus provides access to special genomic features, such as graphical representation of physical structure and mapped genomes. The other interface is a genomic data visualization (GVis) developed in the Charlotte Visualization Center [13] and is not available commercially. (See Figure 2.) GVis was developed to support the visual analysis of large-scale phylogeny hierarchies by visualizing hierarchical relationships between organisms in addition to pictorially representing other essential information, such as the presence of mapped genomes or the phylogenic organization between two related subcategories. It allows quick browsing of the hierarchy from the highest level down to the level of an individual genome for the desired organism of interest via direct interaction, a method of data manipulation that minimizes the use of menus, allowing users to “drill down” directly by pressing and holding down a mouseclick near the information of interest.
2.2 Psychometric Measures Six psychometric measures were administered: the Locus of Control Inventory, the Beck Anxiety Inventory, the IPIP 20-item Big Five Neuroticism Scale, the IPIP 20-item Big Five Extroversion Scale, the Self-Regulation Scale, and the Scale of Intolerance-Tolerance of Ambiguity. The Internal-External Locus of Control Inventory (LOC) [14] is a 39-item forced choice measure designed to evaluate the degree to which participants attribute life events to some action of their own, or to some uncontrollable action outside of themselves. Lower LOC scores are associated with an “internal locus” of control, an inherent belief that events and outcomes are under a person’s control, and thus, success or failure depends largely on personal behavior and attitudes. Higher scores indicate an
Submitted to 2009 Hawaii International Conference on System Sciences, Digital Content: Content and Communication, Visual Analytics in the Context of the Organization
“external locus,” an inherent belief that events and outcomes are not under a person’s control, but are largely influenced by other people, unforeseen circumstances, a higher power, or other factors. Rotter postulated that these loci were individual traits and remained stable over a person’s lifetime [14]. The Beck Anxiety Inventory (BAI) [15] is a 21item Likert-like scale which asks the participant to evaluate how often common anxiety symptoms were experienced over the previous month, from 0(not at all) to 3(severely-bothered me a lot). The BAI was designed to diagnosis “trait” anxiety, a tendency to be prone to anxiety generally, even absent a generating trigger. The IPIP 20-item scales for the Big Five Neuroticism and Extraversion [17] are both 5-point Likert scales that ask participants the degree to which each listed characteristic applies to them selves. Both scales can be found on the IPIP website: http://ipip.ori.org/. Briefly, Extraversion defines the degree to which a person is action-oriented and seeks the society of others. Neuroticism can be viewed as the opposite of Extraversion; it is distinguished by negativity and a propensity to be emotionally sensitive. The Self-Regulation Scale (SRS) [18] is a 10item, Likert-like measure which evaluates “postintentional” regulation of focused attention and emotional maintenance throughout the completion of a goal-oriented task, or, in other words, the ability to maintain sustained focus despite distractions, uncertainty, and/or emotional events. The Scale of Tolerance-Intolerance of Ambiguity (TOA) is a 16-item Likert measure designed to appraise the degree to which the participant selfevaluates novel, complicated, or apparently unsolvable situations as threatening [19]. Tolerance of ambiguity, as measured by the TOA, is not, like the SRS, a measure of coping ability per se, but an appraisal of self-beliefs, similar to the LOC.
2.3 Protocol After signing up to participate in the study and giving informed consent, participants were invited to complete an online survey that included demographics and 6 psychometric measures, with particular emphasis on self-perceived ability, personal experience and comfort with computers and computer interfaces. If this survey could be completed before arriving in the laboratory, or it could be completed the day of the study. Most participants elected to complete it before the study
session. All data were collected for post-hoc analysis with task performance data. After completion of the self-report measures, participants began the first of the four series of learning tasks. All four series were administered through a web application, which led the participant through each task. The order of interface was counterbalanced for order effects; half of the participants used GVis first, half used NCBI first. The GVis tasks started with a brief demonstration of GVis 3 basic modes of mouse manipulation: zooming in, zooming out, and panning (moving the visualization within the view for better visibility). After the dem onstration, a short tutorial was administered to introduce participants to essential tools and concepts in the interface, and allow participants to experiment with what was being learned. In some cases, step-by-step instructions were given. A researcher was on hand throughout the study to answer any questions. Following the tutorial was a series of 3 tasks designed to test procedural performance: the participant was asked to identify a piece of information located somewhere within the presented informational hierarchy. The question provided what base categorization or subclass the information was located within, but did not provide step-by-step instructions. Participants were also told to find the item as quickly as possible, as the task was being timed. As soon as the information was located on screen, the participant pushed a “Found It” button on the screen. The time taken from the presentation of the question on-screen to the moment the button was pushed was recorded as completion time. Following the procedural tasks, the participant was administered a series of tasks designed to test inferential performance. A series of 3 questions were asked; each question asked the participant to evaluate characteristics of one organism and find others that were like or unlike the example; the first question was open response, the other 2 were forced choice. Participants were told not to worry about the time taken to complete the task; this instruction was given to mitigate unmeasured performance anxiety. If the participant answered the question incorrectly, that was recorded post-study as an error. Errors and completion time were recorded as outcome variables. The NCBI tasks series followed the same protocol as the GVis tasks: introduction and demonstration, tutorial, procedural tasks, and inferential task. Special care was taken to create tasks that were very similar in construction and difficulty to the tasks in the GVis. After each participant had completed the tasks in both interfaces, a post-study questionnaire was
Submitted to 2009 Hawaii International Conference on System Sciences, Digital Content: Content and Communication, Visual Analytics in the Context of the Organization
administered. Participants were asked to specify which interface they liked better and in which interface they were more comfortable working. They were also asked to freely respond to what they liked and disliked about each interface. Finally, they were asked to give each interface a letter grade (‘A’ (superior) through ‘F’ (failing)). The completion of the post study questionnaire was followed by a short debriefing, which included an opportunity for questions. This ended the study session, and there was no follow-up.
3. Results This section is divided into 3 subsections: descriptive results, including participant feedback about each interface, inferential statistical analyses of performance, and generation of new predictors of performance derived from psychometric measures.
Figure 1. NCBI MapViewer
Figure 2. The main view of GVis.
3.1 Descriptive Results Mean procedural task completion times (in seconds) in the MapViewer (M = 136, SD = 84) were faster than in GVis (M = 162, SD = 111). A paired-sampled t-test between the total completion times in the procedural tasks across the interfaces achieved only borderline significance (p = .057). This nonsignificant trend is not entirely congruent with our expectation that we not would find a significant difference between the procedural completion times between both interfaces. The MapViewer times were shorter, but the trend was not strong enough to rule out random chance as a factor. However, for the inferential task, GVis times (M = 451, SD = 169) were faster than those in the MapViewer (M = 922, SD = 521). During the completion of the inferential tasks, participants answered more questions correctly while using the GVis (M = 1.31, SD = .56) interface than while using the Mapviewer (M = .77, SD = .59). A pairedsamples t-test between total inferential completion times for each interface was significant ( t(49) = 7.59, p < .01), as were the total completion times (all 6 tasks) in both interfaces (t(49) = 6.99, p < .01). Of the inferential questions answered in the visualization, 40 (78%) answered the first correctly compared with 2 (4%) in the web application. 4 (12%) correctly answered the second visualization question, compared with 8(16%) in the web application. And 5(10%) answered the third question correctly compared with 2(4%) in the web application. Overall, these data support the second hypothesis that tasks completed in the visualization would be done more efficiently and effectively than those completed in the web application. Correlations between total completion times were all significant: total procedural completion scores in both interfaces (r(50) = .49, p < .01), total inferential completion times in both interfaces (r(50) = .61, p < .01), and total completion times (all 6 tasks) in both interfaces (r(50) = .63, p < .01). These data demonstrate that participants who tended to take longer completing tasks in one interface also tended to take longer completing tasks in the other. Overall, participants preferred interacting with the visualization to interacting with the web application. This preference was indicated in a variety of ways. For example, when asked to give each interface a letter grade, from A (superior) to F (failing), 36 (71%) gave the GVis an A or B; 18 (25%) gave an A or B to the MapViewer. Additionally, when asked, 33(65%) reported that they both preferred and were
Submitted to 2009 Hawaii International Conference on System Sciences, Digital Content: Content and Communication, Visual Analytics in the Context of the Organization
more comfortable in the visualization; 15 (29%) preferred and were more comfortable in the web application. Participants were also asked to freely respond to prompts about likes and dislikes in each interface. Common likes in GVis included the ease of use and use of color and graphical groupings; dislikes included not always knowing where to look for information. Common likes in MapViewer included its alphabetical and hierarchical organization; dislikes included difficult searches and the presentation of too much data.
3.2 Inferential task performance Of the administered psychometric scales, only Rotter’s Locus of Control (LOC) scores predicted inferential learning performance. LOC scores negatively correlated with total inferential task completion scores in the visualization ( r(50) = -.34, p = 02) but not the web application (p = .104) Please see Table for more. A repeated-measures Analysis of Variance (ANOVA) demonstrated a significant betweenparticipant main effect of hi-lo LOC groups for GVis Inferential completion times (F(13, 36) = 2.06, p = .04, η2 = .43). No such effect existed for MapViewer completion times.
3.3 Procedural task performance None of the 6 whole psychometric measure scores showed significant trending with procedural completion times in either interface. Therefore, each psychometric scale was analyzed for its principal components, and an analysis of the psychometric items was done to evaluate which constructs might predict performance separately. Intercorrelations between individual items as well as analysis with a metric alternating least scales scaling (ALSCAL) multidimensional scaling (MDS) analysis of each of the 6 measures were used to identify clusters of similar items within each measure. This analysis was followed up with factor analysis with principal component analysis (PCA), which identified the structural “components” of each measure: items whose scores trended together, as well as accounted for substantial proportions of variance in the total 9item short measure score. The results of this analysis were then narrowed by choosing the most influential measure items items, or the items that explained the most variance, from components that contained at least one item that
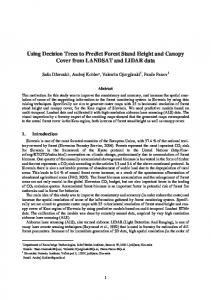
significantly correlated with the mean procedural task completion times in either interface. For example, the item “Start conversations” in the IPIP Extraversion scale significantly correlated with the mean completion times from the 3rd procedural task in GVis. This item, “Start conversations” had been identified as part of the 2nd component of the Extraversion measure. That component’s top item, or item that was most influential, had been identified as “Feel comfortable around people,” which was then considered as a potential item for the new measure. In addition to the most influential item in each component, items that correlated with multiple mean task completion scores or had strong intercorrelations, were also considered, whether or not they were the most influential item in a component. Each item was then analyzed for its contribution to the new measure, and items that did not add to either its measure-task correlation or to its internal consistency of the new measure were eliminated from inclusion. In this way, 126 items from the original 6 administered measures were narrowed to 9 items. (See Table 1.) These 9 items were evaluated together as a separate short measure. A metric ALSCAL MDS with a 2-dimensional solution was conducted to define the underlying structure. The Young’s S-stress value (max of 1, lower numbers indicate less stress) of the solution was .02, and the squared correlation (RSQ) was .99 (higher numbers indicate better intercorrelation), Table 1. Items in the short measure.
Table 2. PCA components of the short measure.
Submitted to 2009 Hawaii International Conference on System Sciences, Digital Content: Content and Communication, Visual Analytics in the Context of the Organization
denoting that the data are a good statistical fit to the scale. MDS analysis identified two main clusters: Hands Trembling/Numbness and Unable to Relax/Fearing the Worst. All four of these items in these two clusters originated from the Beck Anxiety Inventory. (Please see Figure 3.) A factor analysis of the 9-item short measure was conducted using principal component analysis (PCA). Multiple criteria for the correlational factorability were utilized; 8 of the 9 items correlated at a minimum .30 with at least one other item; this suggests a reasonable level of factorability. Also, the Kaiser-Meyer-Olkin Measure of Sampling Adequacy was .68, which is above the accepted standard of .60. Bartlett’s Test of Sphericity was significant (χ2 (36) = 97.22, p < .01). All anti-image correlational diagonals, with the exception of Hands Trembling, were above .50. Internal consistency was measured using Cronbach’s alpha; consistency was moderate, α = .63. Factor analysis extracted 3 principal components with initial eigen values > 1.0; these components together accounted for 62% of score variance. (Please see Table 2 for more.) The 9-item short measure moderately correlated with total procedural completion times in each interface (GVis: r(50) = -.46, p < .01, MapViewer: r(50)= -.38, p < .01); participants with higher scores on the measure tended to take less time completing the procedural tasks in both interfaces. A two-way (interface x trial) repeated-measures ANOVA was conducted to determine whether the 9-item short measure demonstrated a within-participants main effect of interface (F (1, 33) = 7.51, p = .01, η2 = .19). There was also a within-participants main effect of trial (F(2, 66) = 50.71, p < .01, η2 = .61.) The interaction of trial x 9-item short measure was also significant (F(32, 66)= 6.76 p < .01, η2 = .76). Lastly, a between-participants main effect of 9-item short measure was found (F (16, 33) = 4.13 p < .01, η2 = .67).
4. Discussion This study demonstrates that not all interactive learning tasks are created equal. Identify-and-find behaviors like the ones utilized during the procedural
tasks use a different combination of tools in the cognitive toolbox than do more complex, iterative reasoning behaviors engaged during the inferential tasks. This was demonstrated by completion times; the simple procedural tasks were not done more efficiently in one interface over the other. But when the tasks became more difficult, requiring the user to categorize, compare, and evaluate multiple choices at once, participants worked more quickly and made fewer errors while using the visualization. Then too, is the difference in what genre of psychometrics predicted the task behavior. In the procedural tasks, most of the trending items were anxiety-based, or described some fear of the unknown; together, these factors could account for as much as three-quarters of the completion variance between the procedural task outcomes. For the inferential tasks, the biggest indicator of performance was locus of control, a user’s self-belief about personal control over circumstances and environment. Although not considered by interface evaluators, how much control an individual feels over his or her life circumstances has long been regarded as a demonstrative predictor in the human behavioral literature; an internal locus has been associated with such outcomes as better use of problem-solving skills [20], a greater resolve during task difficulty [21], and development of intrinsic motivation [21]. This study’s finding that an external locus is a predictor of efficient inferential task completion is not explained by much of the extant LOC literature originating from the psychological, learning, health, and HCI disciplines. It is possible, however, that participants with an external locus of control were more ready to accept the constraints of an unfamiliar environment, and so were more able to quickly work the tasks; similar results were reported in a study in which participants with an external locus who knew that they could not escape an loud, uncomfortable noise adapted more quickly to the environment than those with an internal locus, who tried to escape the environment more quickly and altogether [22]. Until we can replicate and further explore this trending, we will accept the plausibility that an external locus improves the ability to work within a novel environment or with novel, complex information by allowing the user to adapt to the environment despite the discomfort of the unknown.
Submitted to 2009 Hawaii International Conference on System Sciences, Digital Content: Content and Communication, Visual Analytics in the Context of the Organization
Figure 3. MDS clusters in the 9-item measure. That the external-locus = shorter-completiontime trend is exhibited only in the visualization interaction is easier to explain. GVis was developed in response to a request for a better way to locate and analyze the spatial and semantic relationships between ontological biological structures [13]; inferential tasks that depend compare-and-contrast behaviors should, theoretically, be easier to see and solve in GVis. Additionally, the performance outcomes, non-significant trending between MapViewer outcomes and the sporadic psychometric scores, as well as the wide nature of the participant feedback suggest that combination of variables influenced MapViewer complex interaction behaviors, perhaps due to the difference in required interaction. For example, unlike the straightforward presentation of mapped genes in GVis through direct interaction (holding down a single mouseclick on the organism of interest), determining the existence of a mapped gene for an organism in MapViewer required the user to hunt for the organism name in the list of organisms, possibly reorganizing the list through primary and secondary sorts, locating and clicking on the small single letter “G” which served as a hyperlink to a separate page. If a gene existed, information about its mapping was presented. If the gene did not exist, the hyperlink led to a page presenting a frustrated-looking male icon and the explanation, “No information found for given taxid.” Locus of control played a role in the MapViewer inferential task outcomes, but not one strong enough to show any predictive strength. In the procedural tasks, the 9-item short measure is moderately negatively correlated with completion times. This suggests that more trait-anxious (i.e. persons that tend to be anxious all the time as compared to anxious only when presented when threatening stimuli), uncommunicative, and/or prone
to emotional instability a person is, the less time they tend to take finding requested items while interacting with novel information. This might seem counterintuitive at first glance. However, according to Spence-Taylor Drive Theory [23], persons with higher trait anxiety tend to identify target information more quickly than the non-anxious when the task does not require either iterative or complex reasoning processes. Other studies have found that persons with higher trait anxiety are more attentive to presented information and can identify target threats more quickly than others [24]. While the causes for this “exception” are still subjects of debate, it has been proposed that trait anxious persons have developed adaptive heuristics than can make advantageous use of their anxiety [24]. The results of the current study would suggest that certain aspects of trait anxiety tend to make users more attentive and better identify target information until the task becomes complex, requiring more complicated reasoning heuristics and lessening the effectiveness of the adaption. Additionally, the 9-item short measure scores positively correlated with LOC scores (r = .37, p