1
Using PQ-Monitor and PMU for Voltage Sag Extended-Characterization Chouhy Leborgne, Member, IEEE, and Peiyuan Chen
Index Terms—Characterization, power quality, voltage sags (dips)
I. INTRODUCTION It is not until the recent fifteen years that the industry and the research institutes started focusing on power quality. A first analysis of the Electric Power Research Institute (EPRI) estimated that the USA national cost of power-related problems reached US$ 26 billions per year by 1993. Later in 2001, a new study of EPRI raised this figure to US$ 119 billions per year based on the cost of power interruption and power quality [1]. Voltage sag is one of the most severe power quality problems [2]. Modern industrial processes, e.g., rolling mills, are sensitive to voltage disturbances because of the use of converter drives, which trip due to voltage sags in order to protect the power electronic valves in the converters. The consequence for the mill can be in many cases the stop of the production, with associated costs due to lost production, clean up and repair [3]. In order to evaluate the impact of different voltage sags and accompanying economic losses on the industrial processes, a detailed study of the characterization of voltage sags is needed. Many studies have been devoted to the development of the characterization of voltage sags [4][5][6]. Theoretical classifications and mathematical algorithms for characterizing voltage sags have been analyzed exhaustively [6]. However, the difference of the results that may occur due to the use of This work was supported in part by the CAPES (Brazil) Grant BEX164002-0 R. C. Leborgne is with Chalmers University of Technology, Elteknik, Gothenburg, 412 96 Sweden (e-mail:
[email protected]). P. Chen is with ABB Corporate Research, Vasteras, Sweden (e-mail:
[email protected]).
1-4244-0288-3/06/$20.00 ©2006 IEEE
different monitoring equipments, i.e., power quality (PQ)monitor, and phasor measurement unit (PMU), was not presented and discussed. This is important in view of the fact that different data sources affect the choice of sagcharacterization algorithms and the accuracy of them. PMU is a device for synchronized measurement of AC voltages and currents, with a common time (angle) reference. It has mainly been used for recording, on-line supervision, and wide area measurement system applications. PMU provides the phasor data of positive sequence voltage at a speed of 50/60 samples per second; whereas PQ-monitor provides the instantaneous voltage data at a much higher speed, e.g., 7.2 kHz. In this paper, a comprehensive study is presented in order to show the proposed characterization of voltage sags [7]. The discussion is based on the simulation results by PSCAD/EMTDC and the measurement results from a configuration constructed in the scaled network model. The four types of shunt faults, 3LG, SLG, LL, and LLG, are tested on the configuration under the conditions of pure resistive load as well as induction machine load. The voltage data recorded by PQ-monitor and PMU is analyzed and compared in terms of the magnitude and the phase-angle jump of the positive sequence voltage. The results will show the accuracy of the voltage sag extended-characterization when applying the usual simulation tools and the difference of the voltage sag characterization by using different monitoring equipments. II. VOLTAGE SAG DEFINITION AND CHARACTERIZATION A. Definitions A voltage sag is defined as a decrease in rms voltage at the power frequency for durations of 0.5 cycle to 1 min [7]. This definition specifies two important parameters for a voltage sag: the rms voltage and the duration. The standard also notes that to give a numerical value to a sag, the recommended usage is a sag to 20 %, which means that the line voltage is reduced down to 20 % of the normal value. The standard treats voltage dips and voltage sags as the same concept. Additionally, a IEC standard defines that voltage sag is an alternative name for the phenomenon of voltage dip [8]. Another standard defines a voltage dip as a temporary reduction of the voltage at a point in the electrical system below a threshold [9]. The standard notes that dips are characterized by retained voltage and duration. It also notes that if, during a voltage dip the voltage falls below the interruption threshold, the event is sometimes considered to be
2
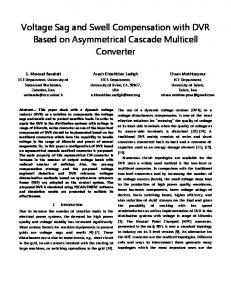
both a dip and an interruption. According to this standard when counting the number of dips, interruption should also be included. B. Single-phase events The magnitude of a voltage sag can be determined in a number of ways. The most common approach to obtain the sag magnitude is to use rms voltage. There are other alternatives, e.g., fundamental rms voltage and peak voltage. As long as the voltage is pure sinusoidal, these three options will give the same results in per unit values. However, for a harmonic distortion that does not exceed the maximum recommended levels, the error of using the fundamental voltage is quite reduced. The duration of a voltage sag is the time between the rms voltage (downwardly) crossing the sag starting threshold and the rms voltage (upwardly) crossing the sag ending threshold [7]. A short-circuit fault in the power system causes a change in voltage at a certain point, not only in magnitude but also in phase angle. The change in phase angle is known as the phaseangle jump associated with the voltage sag [2]. The phaseangle jump manifests itself as a shift in zero crossing of the instantaneous voltage. In order to have an intuitional idea of what the phase-angle jump means, a virtual voltage sag event with a retained voltage of 50% and a phase-angle jump of -45 degrees is shown in Fig. 1. The zero crossing of the duringfault voltage lags that one of the pre-fault voltage by 2.5 ms, which is 45 degrees in angle in a 50 Hz system. The negative sign indicates that the phase angle of the voltage decreases due to the fault.
definition of the magnitude for the three-phase events has its own advantage in specific fields. In this paper, two ways of interpreting magnitude for the three-phase events are analyzed and compared. The analyzed methods are the minimum phase voltage and the characteristic voltage. The characteristic voltage is a complex value that can be obtained analytically from the sequence voltage components shown in Table I or by the inspection of the type of sag shown in Table II [4]. The absolute value of the characteristic voltage is used to represent the three-phase sag magnitude index. TABLE I CHARACTERISTIC VOLTAGE Fault type
Characteristic voltage - U
3LG
U = U1 = Ua
SLG
U = U1 + U2
LL and LLG
U = U1 - U2
TABLE II THREE PHASE UNBALANCED VOLTAGE SAGS A
B
C
E
1.5
Voltage(p.u.)
1
0.5
2.5ms
0
-0.5
-1
-1.5
0
20
40
60
80
100
120
140
160
180
200
Time(ms)
Fig. 1. Voltage sag with magnitude of 0.50 pu and phase-angle jump of -45 deg
C. Three-phase events The most common classification of three-phase voltage sags is the ABC method. The ABC classification includes seven types of voltage sags, four of which are shown in Table II. The IEEE and IEC standards do not provide a definition of magnitude for a three-phase event. Therefore, there are several ways to define sag magnitude for the three-phase sags. It can be represented by the most severe phase, the characteristic voltage [10], or the positive sequence voltage [4]. Each
There are mainly three factors that affect the duration of a three-phase voltage sag. One is the choice of the threshold. The two others, which are more controversial, are the starting instant and the ending instant of a three-phase event. Therefore, the duration of the event can be calculated based on the phase with the lowest magnitude, the phase with the longest duration, or the superposition of the three durations. Here, the duration of a three-phase event is defined considering that a voltage sag starts when the rms voltage of one or more channels is below the sag-starting threshold, typically between 85% and 95% of the nominal voltage, and ends when the rms voltage on all measured channels is equal to or above the sag-ending threshold [9]. The phase-angle jump index of a three-phase voltage sag can also have two alternatives. One is called the maximum phase-angle jump, which is simply to take the phase that experiences the largest phase-angle jump. Another alternative is to choose the phase angle of the characteristic voltage. Both alternatives will be considered and the results will be
3
compared.
IV. RESULTS AND DISCUSSION III. METHOD
A. The analog network model In order to measure and characterize voltage sags an analog network is used. The analog network is a three-phase scaled model of a 400 kV transmission system and includes a generation power plant, transmission lines, two transformers with on-load tap changers, and passive and dynamic loads. The scaled model operates at 400 V. The line model consists of six identical ʌ-sections, each corresponding to 150 km of a 400 kV line. The sections can be connected arbitrarily in series or parallel. The scaled values of the transmission line resistance, inductance and capacitances are: R = 50.0 mȍ, L = 2.05 mH, C = 46.0 μF. The generic system configuration investigated is shown in Fig. 2. It represents a transmission grid where a group of loads are supplied through two transmission lines. The loads include pure resistive loads and an induction machine. The load characteristics are: • Induction machine: UN = 380 V, IN = 62 A, PF = 0.81, nN = 1450 rpm • Three-phase resistive loads: UN = 400 V, PN = 9 kW
At the indicated location four types of shunt faults are executed (3LG, SLG, LL, and LLG). The duration of the fault is set by the close time of the contactor that closes the fault circuit. A standard fault clearing time of 100 ms is chosen. The results are summarized in Tables III-VI. The measurements obtained by the PQ-monitor and the results from the simulation are presented in Tables III-IV. The estimated sag characteristics are: the voltage phasors, the minimum phase voltage, the maximum phase-angle jump, the absolute value of the characteristic voltage, the angle of the characteristic voltage and the sag type. TABLE III RESULTS OBTAINED FOR RESISTIVE LOADS Ur (V)
ǻĭ (deg)
|U| (V)
Arg U (deg)
Sag Type
Sim
115
0.7
115
0.7
A
Exp
112
1.7
113
1.5
A
114
0.3
153
0.5
B
Exp
111
11
182
2.5
B
Sim
151
19.4
115
0.7
C
Exp
149
22.7
113
4.1
C
Sim
113
0.5
115
0.7
E
Exp
111
2.3
113
2.4
E
Phasors
3LG
F
D
Sim E
SLG
Fig. 2. Circuit used in the measurements and simulations
The measurement system consists of a PQ-monitor and a PMU. The PQ-monitor registers the voltage sags at MP2 and the PMU measures the voltages at PM1 and PM2 with time synchronization. As a result, the three phases instantaneousvoltages are recorded by the PQ-monitor at MP2 and the positive sequence complex voltage is recorded by the PMU at MP1 and MP2. B. Simulation of voltage sags Several tools are available to simulate voltage sags. In order to observe the effect of the induction machine on the during-fault voltages, a time domain simulation program is used (PSCAD/EMTDC). The three-phase instantaneous voltages at MP1 and MP2 are recorded. Then, the voltage data are exported and processed using a MATLAB algorithm. As a result, fundamental rms voltages, phase-angle jumps, and positive sequence complex voltages are obtained from the simulation for the further comparison with the corresponding results from the measurement.
LL
LLG
Note: 3LG: three-phase-to-ground fault, SLG: single-line-toground fault, LL: line-to-line fault, LLG: line-to-line-toground fault, Sim: simulation, Exp: measurement, Ur: minimum retained voltage. ǻĭ: maximum phase-angle jump, U: characteristic voltage.
4 TABLE IV RESULTS OBTAINED FOR RESISTIVE AND INDUCTION MACHINE LOADS Ur (V)
ǻĭ (deg)
|U| (V)
arg(U) (deg)
Sag Type
Sim
119
-3.5
119
-3.5
A
Exp
115
-4.1
115
-3.8
A
Sim
122
-3.9
162
0.9
B
Exp
113
-13.8
184
-2.0
B
Sim
150
-14.4
129
1.7
C
Exp
146
-13.4
130
1.1
C
Sim
118
-5.8
126
-1.1
E
Exp
116
9.4
127
2.1
E
Phasors
3LG
SLG
LL
simulation. If the measured sag magnitudes obtained by the minimum phase value and the characteristic voltage are compared we see that the average difference is 12 %. For SLG and LL faults a larger difference is obtained. This is explained by the definition of the characteristic voltage during a SLG and a LL fault. During the SLG faults, the characteristic voltage is obtained as the sum of positive and negative sequence voltages [4], whereas the minimum phase voltage includes the zero sequence component. During the LL faults, the difference between the two values is caused by the phase-angle jump of the two faulted phases. The effect of the different kind of loads in the voltage sag magnitude can be seen comparing Tables III and IV. Table III presents the results for pure resistive loads and Table IV presents the results for a combination of resistive and induction machine loads. For a sag duration of 100 ms the magnitudes obtained when there is an induction machine load are higher than when only resistive loads are connected, for most of the fault types. The induction machine behaves as a generator during the beginning of the event keeping the voltage at a higher value, as shown in Fig. 3. However, after the initial period if the sag duration is higher than the time that the induction machines is behaving like a generator the voltage reaches the minim value. Later, when the fault is cleared the voltage recovery is delayed by the induction machine reacceleration.
LLG
Fig. 3. Voltage sag with only resistive load and with induction machine load
A. Voltage sag magnitude The first aspect is the comparison among simulation and experimental results for the estimation of the voltage sag magnitude. According to Tables III and IV, the measured and the simulated results are very similar to each other. The relative error of the simulated magnitude, with respect to the measured magnitude, is in average 3 % for the minimum phase retained voltage (Ur) and 5 % for the minimum absolute value of the characteristic voltage (|U|). However, for a SLG fault the characteristic voltage obtained through simulations differs significantly from the value obtained through measurements. The error is -16 % when only resistive loads are connected and -12 % when the load includes also an induction machine. This phenomenon is understandable: the zero sequence impedance of a transmission line is different from the positive and negative sequence impedances. However, during the simulations using PSCAD/EMTDC the zero sequence impedance was considered to be equal to the positive sequence impedance. During a single-line-to-ground fault there is zero sequence current flowing in the circuits that cause the large error of the
The last aspect is to compare the different results of the voltage sag magnitude recorded by the PQ-monitor and the PMU. The PMU delivers the positive sequence complex voltage estimated once every cycle. The PQ-monitor delivers the instantaneous phase voltages with a resolution of 144 points per 20 ms. In order to be able to compare both types of measurements, the PQ-monitor data is processed using a MatLab routine to obtain the positive sequence voltage. Then the minimum value of the positive sequence voltage magnitude is used to characterize the sag magnitude. The results are summarized in Table V for each type of faults and load conditions. From the results summarized in Table V, we could see that the positive sequence voltages obtained by PMU comply with those obtained by PQ-monitor, and the relative errors are all within 5 %. Therefore, PMU gives relatively accurate results in the information of the minimum positive sequence voltage magnitude.
5
TABLE V RESULTS OBTAINED BY PQ-MONITOR AND PMU FOR SAG MAGNITUDE Positive sequence voltage (V) Fault type 3LG
SLG
LL
Measurement device
Resistive load
Resistive + induction machine
PMU
110
113
PQ-monitor
113
114
PMU
197
190
PQ-monitor
207
198
PMU
169
164
PQ-monitor
173
164
PMU
160
156
PQ-monitor
163
157
LLG
B. Phase-angle jump During this section the voltage sag phase-angle jump is discussed. The comparison between the simulation and experimental results is based on the maximum phase-angle jump regardless the phase where it happens. According to the results shown in Tables III and IV the errors of the maximum phase-angle jump obtained by simulation are in most cases within 5 deg. The exceptions happen for the single-phase-to-ground fault. The explanation is again that during the simulation the zero sequence impedance and positive sequence impedance of the transmission line were considered equals. The errors can be reduced if the transmission line is modeled with a proper value of the zero sequence impedance. On the other hand, the errors of the simulated phase-angle jump of the characteristic voltages are all within 5 deg, due to the definition of the characteristic voltage that does not include the zero sequence voltage. The measured phase-angle jump of the characteristic voltage and the largest of the three phases’ angle-jumps are now compared. For the 3LG faults, the phase-angle jump obtained by the phase voltage and the characteristic voltage are in accordance with each other. Because for symmetrical faults there are only positive sequence voltages in the system, thus, the definition of the characteristic voltage is the same as the phase a. Consequently, both phasors experience identical angle jump during the sag. For the asymmetrical faults, however, the results obtained from the characteristic voltage and the phase values do not agree with each other. The phase angle of the characteristic voltage will be equal with the symmetrical phase angle if the two healthy phases in a SLG fault (or the two faulted phases in a LL or LLG fault) are symmetrical with respect to the axis where the third phase (the symmetrical phase) lies on. The difference occurs because the phase-angle jump of the characteristic voltage deviates from the phase-angle jump of the symmetrical phase, due to the realistic asymmetry of the two healthy phases in the SLG fault (or two faulted phase in LLG fault). The difference that occurs under the load
condition of induction machine has the same justification. For a LL fault, the maximum phase-angle jump of the phase voltages will not be necessarily the phase-angle jump of the symmetrical phase. In this case, the maximum phase-angle jump from phase voltages will be at one of the faulted phases. As the phase-angle jump from the characteristic voltage is normally equal to the phase-angle jump of the symmetrical phase, which is the non-faulted phase, there is large difference between the two definitions of phase-angle jump. As shown in Table III, the phase-angle jumps at MP2 are all positive for a resistive load condition. On the other hand, the phase-angle jumps are negative for the induction machine load condition under 3LG, SLG, and LL faults, as shown in Table IV. Therefore, in general terms we can say that the phase-angle jump associated with a voltage sag is negative when there is a high penetration of induction machine loads and the phase-angle jump is positive when the load is mainly resistive. The last aspect to be investigated is the difference of phaseangle jumps recorded by PMU and PQ-monitor. As shown in Table VI, the largest difference is 5.7 degrees obtained during a 3LF fault. However, in most of the cases the difference is rather small and both devices show the same trend: positive phase-angle jumps for resistive loads and negative-phase angle jumps for induction machine load. The exception is for the 3LG where the PMU measured a positive phase-angle jump for an induction machine load, making the large difference with the PQ-monitor measurement. TABLE VI PHASE-ANGLE JUMP MEASURED BY PQ-MONITOR AND PMU Phase-angle jump (deg) Fault type 3LG
SLG
LL
Measurement device
Resistive load
Resistive + induction machine
PMU
4.4
1.8
PQ-monitor
1.5
-3.9
PMU
2.8
-0.3
PQ-monitor
2.0
-2.7
PMU
2.7
-1.4
PQ-monitor
3.0
-1.8
PMU
1.7
-1.9
PQ-monitor
1.7
-1.0
LLG
C. Sag type It is possible to obtain the voltage sag type when the voltage phasors are available or when the positive and negative sequence voltages are known. The voltage sag type is presented in Tables III and IV for all the faults and the two load conditions. The sag type based on ABC classification is determined by the three phasors of the three phase voltages. Although the three phasors do not comply exactly with the phasors shown in Table II, it is possible to identify the actual phasor diagrams and classify them into right sag types, as shown in Table III and IV. The ABC classification method, although very intuitive, can not be easily implemented in terms
6
of a computational algorithm. The classification of the sags obtained from measurements and simulations agreed very well for all the fault types and load conditions. The voltage phasors obtained by simulation are slightly different from the ones obtained by measurements for the SLG fault and the LLG fault. We suspect that the difference is again a consequence of the inaccurate modeling of the zero sequence impedance of the line models. This zero sequence model only affects faults that include grounding. V. CONCLUSIONS The time-domain simulation of faults is a powerful tool to obtain voltage sag characteristics such as magnitude, duration, phase-angle jump, and voltage sag type. The characteristic voltage can be used to estimate the sag magnitude and the phase-angle jump. However, for voltage sags type B, C, and E, the magnitude and phase-angle jump of the characteristic voltage differs from the ones of the minimum phase voltage. The effect of the induction machine load is seen in the dynamic behavior of the during sag voltage. The sag magnitude is affected by the induction machine if the sag duration is short. For longer sags the event magnitude is similar to the one obtained when there is no induction machine load. The induction machine also affects the post-fault voltage, delaying the voltage raise and in same cases extending the sag duration. The PMU is a promising device for voltage sag detection and characterization. Today the main limitations are related to the availability of the phase voltages and the time resolution of the measurements. The tested equipment only delivers positive sequence voltage with a time resolution of 20 ms. This limitation is a handicap to characterize unbalanced sags and short voltage sags (duration < 2 cycles). [1]
VI. REFERENCES LaCommare, K.H., Eto, J.H., Understanding the Cost of Power Interruptions to U.S. Electricity Consumers. Energy Analysis
Department, Ernest Orlando Lawrence Berkeley National Laboratory, University of California Berkeley, California, 2004. [2] Bollen, M.H.J., Understanding Power Quality Problems: Voltage Sags and Interruptions. IEEE Press series on power engineering, New York, 2000. [3] Dugan, R.C., Mc Granaghan, M.F., Beaty, H.W., Electric Power Systems Quality. McGraw Hill, New York, 1996. [4] Bollen, M.H.J., Zhang L.D., Different Methods for Classification of Three-phase Unbalanced Voltage Dips due to Faults. Electric Power Systems Research 66, pp.59-69, 2003. [5] Leborgne, R.C., Karlsson, D., Phasor based voltage sag monitoring and characterization. Proceedings of 18th International Conference on Electricity Distribution - CIRED, Turin, Italy, 2005. [6] Bollen, M.H.J., Algorithms for Characterizing Measured Three-phase Unbalanced Voltage Dips. IEEE Transactions on Power Delivery, Vol.18, No.3, July 2003. [7] IEEE Std. 1346, IEEE Recommended Practice for Evaluating Electric Power System Compatibility with Electronic Process Equipment, 1998. [8] IEC 61000-2-8, Environment-Voltage Dips and Short Interruptions on Public Electric Power Supply Systems with Statistical Measurement Results, 2002. [9] IEC 61000-4-30, Testing and Measurement Techniques-Power Quality Measurement Methods, 2001. [10] Bollen, M.H.J., Styvaktakis, E., Characterization of Three-phase Unbalanced Dips (as easy as one-two-three?). IEEE PES Summer Meeting, Vol.2, Seattle, USA, July 2000. [11] IEEE Std. P1564, Draft 6, Recommended Practice for the Establishment of Voltage Sag Indices, 2004.
VII. BIOGRAPHIES Roberto Chouhy Leborgne received his E.E. Degree and MSc. E.E from Universidade Federal de Itajuba, Brazil, in 1998 and 2003, respectively. He received his Licentiate degree from Chalmers University of Technology in 2005. His employment experience includes ABB-Daimler Benz Transportation Brazil and Teyma Abengoa Uruguay. He is currently a PhD candidate at Chalmers University of Technology, Sweden. His fields of interest are voltage sags (dips) and other power quality issues. Peiyuan Chen received his BEng. and MSc. degrees in electrical engineering from Zhejiang University, China, and Chalmers University of Technology, Sweden, in 2004 and 2006, respectively. He is now temporarily working at ABB Corporate Research, Vasteras, Sweden. His research interests include voltage sag characterization and sensitivity of power electronic devices to voltage sags.