This is an Author’s Accepted Manuscript of an article published in: Cabrera Barona, P. and Mena, C., 2014, "Using Remote Sensing and a Cellular Automata-Markov Chains-GEOMOD model for the Quantification of the Future Spread of an Invasive Plant: A Case Study of Psidium guajava in Isabela Island, Galapagos". International Journal of Geoinformatics 10(3):23-30 Publisher: Geoinformatics International Sponsor: Association for Geoinformation Technology (AgIT) Available online at: http://journals.sfu.ca/ijg/index.php/journal/article/view/432
Using Remote Sensing and a Cellular AutomataMarkov chains-GEOMOD model for the quantification of the future spread of an invasive plant: a case study of Psidium guajava in Isabela Island, Galapagos
Pablo Cabrera Barona1,2 and Carlos Mena1 1
UNIGIS in Latin America/Galapagos Science Center, San Francisco de Quito University, Diego de Robles y Vía Interoceánica, Cumbayá, Quito, Ecuador. E-mail:
[email protected] 2
Interfaculty Department of Geoinformatics - Z_GIS, University of Salzburg, Schillerstraße 30, 5020 Salzburg, Austria
Using Remote Sensing and a Cellular AutomataMarkov chains-GEOMOD model for the quantification of the future spread of an invasive plant: a case study of Psidium guajava in Isabela Island, Galapagos Abstract Plant invasive species are one of the most important threats to the ecological stability of the Galapagos Islands and Psidium guajava is one of the most aggressive invasive plants: it currently occupies large areas in the middle and upper zones of some of the islands. This study measures the future spread of Psidium guajava in the south-east area of Isabela Island, Galapagos. Satellite image processing was used to calculate the area of occupation in the years 1980,
2001
and
2009.
Then,
a
Cellular
Automata-Markov
chains-GEOMOD
(CA_Markov_GEOMOD) model was made in order to represent a possible area of future occupancy of Psidium guajava. Results show a continuous invasion of this species in the entire study area and the model of future spread predicts a greater extension of occupation areas in 2030: a spreading rate of 108, 64 Ha / year between 2009 and 2030 was calculated. These results provide a better understanding of the spreading situation of this invasive species, which would support decision making processes to control the invasion. 1. Introduction Human activity has intensified processes of exotic plant and animal dispersion (Vitousek et al., 1997) which change ecological processes in new ecosystems while adapting to the new habitats (Strayer et al, 2006). These species could generate positive or negative environmental impacts (Brown and Sax, 2004; Callaway and Maron, 2006). When introduced species reach critical levels in terms of high population development, they become a threat to the native biodiversity by monopolizing nutrient sources that were previously available only for native species (Thomas and Reid, 2007), and cause disruption of normal flows of matter and energy (Forman and Godron, 1986). The arrival of exotic species to the Galapagos Islands is directly and
proportionally related to the arrival of the human being (Chiriboga and Maignan, 2006) that brought exotic species from the continent, for example the Psidium guajava. On Isabela Island, land use dynamics have historically been related to the establishment of a farming zone in the south-east of the Island, and later to the migration of people from the farming zone to the coastal town of Port Villamil in the lowlands. This migration is mainly due to the increase of tourism and economic fishing activities. Migration leads to the abandonment of agriculture and cattle ranching, leaving the fields vulnerable for the invasion of Psidium guajava (Eckhardt, 1972). Mapping and evaluating land cover changes allows us to know the extension of an exotic plant invasion and identify priority areas for conservation and mitigation management. We can also support the evaluation of land cover changes with the understanding and prediction of dynamics that require temporary projections of land cover future change analysis (Lambin et al., 2003). A Markov chains model is a useful technique for estimating scenarios in landscapes (Poska et al., 2007) and is based on land cover changes by means of transition probabilities (Pontius and Malanson, 2005). A Cellular Automata (CA) is a discrete approach that models the change of a place from one state to another depending on the values of neighboring variables (Poska et al., 2008), and in raster images, the state of each pixels at any given time is a function of the state of the surrounding pixels (Vázquez and Oliver, 2008, Wolfram, 1984) In this study, the component of transitions probabilities uses Markov chains, and the Cellular component considers the change of a spatial unit or pixel as a function of its neighborhoods. GEOMOD is a land-use/land-cover (LULC) change model that simulates the change between two classes in a LULC map (Pontius, 2006). In this study, the model GEOMOD is also linked to the CA_Markov model to create a Cellular Automata-Markov chains-GEOMOD model (CA_Markov_GEOMOD) in order to produce a final two classes prediction map of the spread of Psidium guajava and also to validate this map compared to a Markov chains prediction map. The aim of this study is to generate a spatio-temporal evaluation of the Psidium guajava invasion by generating land cover maps and identifying a future spread scenario of this invasive
plant, which could support decision makers in analyzing logistical feasibility for the control or reduction of the invasion. To achieve this aim, remote sensing information was used and the CA_Markov_GEOMOD was applied. 2. Methods The Galapagos Islands are part of the Republic of Ecuador and are located around 1000 km from its coasts. They are well-known as a living laboratory of evolution, with late human settlement and a high species endemism. Our study area is the south-eastern part of Isabela Island in the Galapagos Islands (Figure 1). The climate varies according to the altitude above sea level: warm-dry (up to 320 m), warm humid (up to about 550 m) and temperate humid (upper 550 m) (McMullen, 1999). Before human presence on the island, vast native grasslands covered the landscape (Schofield 1989; McMullen, 1999), and nowadays, this landscape is covered with Psidium guajava trees (Chiriboga and Maignan, 2006). A set of satellite images was used to characterize the land cover change: a SPOT 4 image of 2001, provided by San Francisco de Quito University in Ecuador, a Landsat MSS image of 1980 and a Landsat 7 ETM+ image of 2009, both obtained from the USGS web service. The SPOT 4 image already had radiometric and atmospheric corrections but the other two did not. In this case, a modified Chávez equation for radiometric and atmospheric corrections was applied (Chuvieco, 2002):
k
Da1, k ND NDmin E0, k cos i k ,i
Where D is the Sun-Earth distance correction factor, and this factor is a function of the Julian day when the image was obtained, a1, k is the calibration parameter of the image, ND is the image to be corrected, NDmin is the minimum digital number of this image, E 0,k is the solar irradiance at the top of the atmosphere, i is the zenith angle of the Sun the day the image was
taken (calculated from the solar elevation angle obtained from the image metadata) and k ,i is the transmissivity value for each band of the image. Parameters a1, k , E 0,k and k ,i are preestablished parameters for Landsat images (Chuvieco, 2002). For the Landsat ETM+ and Spot images a visual interpretation was applied using spectral combinations of 432 for the Landsat image and 321 for the Spot image. Psidium guajava zones are shown in red color and uniformed texture, as well as irregular borders when located inside or bordering with the National Park, and regular borders when bordering farms. For these images, a Normalized Difference Vegetation Index (NDVI) analysis was also applied, and as was expected, the highest values matched with Psidium guajava zones, because
Psidium
guajava plants have very dense-green foliage, in contrast to native plants, which in general are permanent deciduous. Finally, an unsupervised classification was performed. With all these criteria (visual interpretation, NDVI, unsupervised classification), a supervised classification was applied using the minimum distance method. For the 1980 Landsat MSS image the same steps were applied, with the difference that a Principal Component Analysis (PCA) was also applied to this image in order to extract the best information from it. The reason for applying PCA in the case of the Landsat MSS image was that this image has lower spectral discrimination and lower spatial resolution compared with the Landsat ETM+ and Spot images. Four components were produced. The two first components were used because these components contain 98.7 % of variance from the original image. The variance of each component is obtained by dividing the auto value of the component by the sum of all auto values. All the corrections and image processing were done using the software ERDAS Imagine 9.2. Then, the classifications were validated with the following supplementary and historical information: a high-resolution Quickbird image from 2006 provided by San Francisco de Quito University, GPS points taken during a recognition of the study area in August and December of 2009, a 1:50000 land cover map of the study area (TNC-CLIRSEN, 2006), and secondary bibliographic information (Delgado, 1997, INGALA, 1987, DeVries and Tupiza, 1979). The supervised classifications were converted to vector files and edited in order to correct
classification mistakes (also taking into account the supplementary information), and these vector files were converted to raster files, all at 60 meters of resolution, to finally produce land cover maps of 1980, 2001 and 2009. Using the land cover maps produced, our Cellular Automata-Markov chains-GEOMOD (CA_Markov_GEOMOD) model was applied. The first step was to apply the Markov chains technique. Markov chains result in a transition probability matrix, where the probability of change of a place is dependent on the status of that place in previous stages (Tso and Mather, 2001). If a variable X at a given time (t+1) has a value of V1, in a previous time (t) it has a value V0 (Tso and Mather, 2001, Paegelow et al., 2003). In this study, the transition probabilities were based on land cover data from 1980 to 2001. Using these probabilities and the 2009 land cover, new transition probabilities of land cover change from 2009 to 2030 were calculated (Table 1). This step was calculated using the software Idrisi Andes. Using Idrisi Andes, a map of Psidium guajava coverage in the year 2030 was also calculated using the Markov chains technique. The second step was obtaining the factors to been used in the model calculation. We considered two factors: altitude and humidity. The decision to choose these two factors was based on two criteria: 1. because these two variables are directly and indirectly related with Psidium species growth and spread in island habitats (Jacobi and Warshauer, 1992) and 2. This first criterion was confirmed by the results of three ordinary least square regressions where the predictors considered were: pH, conductivity, humidity, aspect, elevation and slope and distance of sampling points to the National Park boundaries, whereas the dependent variables considered were Psidium guajava abundance, canopy cover and tree height. These last tree variables were considered as a proxy of Psidium guajava spread and growth. The predictors of altitude and humidity were highly significant for the three regressions (Table 2). The variables of pH, conductivity, abundance, canopy cover and trees height were measured during fieldwork conducted in December 2009 in the farming zone of the study area (sampling size: 90 samples,
stratified-cluster sampling). Humidity, aspect, elevation and slope variables were calculated using a digital elevation model (DEM) with 30 meter resolution, obtained from the web service of ASTER satellite sensor. These variables, as well as the variable of distance to the National Park boundary were calculated in ArcGIS 9. The case of calculating humidity using a DEM is described thereupon: humidity was represented as a wetness index. First, slope and hydrological flow direction information was calculated from the elevation data. The hydrological flow direction was used to generate a flow accumulation map. The flow direction indicates the pattern of movement that water would take to drain through a given area, while the flow accumulation is an indicator of the amount of water accumulated under the slopes. Then, a drainage area was calculated, which is a function of flow accumulation and represents the upslope area that drains through a specific point (Moore et al., 1993, Martinez, 1999, Sørensen, et al. 2006). Finally, a map of the humidity index was generated using the following equation:
AD H ln tan Where, AD is the drainage area and β is the slope in degrees (Moore et al. 1993, Martinez 1999), the index values range from 0 to 15 (Suárez et al., 2006) where values closer to 15 represent higher humidity. The third step was the final calculation of the CA_Markov_GEOMOD model. The 2009 land cover map was divided into two classes: Psidium guajava cover and non-Psidium guajava cover, and then the total area of each class was calculated. The total area of Psidium guajava cover and non-Psidium guajava cover were also calculated for the Markov chains 2030 Psidium guajava cover map. The two driving factors (altitude and humidity) were considered as suitability set of images using the principle of the Cellular Automata concept. The altitude and humidity factor maps were re-classified to new maps with values from 0 to 255. The highest values represent better
conditions for the development of this species. A constraint image was also used. The constraint image is a Boolean image, where null values represent areas that are excluded from the model. In the model, the null values were applied in the 2009 land cover image to all land covers different from Psidium guajava. The following information was entered into the GEOMOD model: 1. the 2009 land cover map as the image of the initial time, 2. the areas of Psidium guajava and non-Psidium guajava cover from the years 2009 and 2030, 3. the two factor images and a 3. the constraint image. GEOMOD runs in Idrisi Andes. The outcome of this model is a two class-based cover map for Psidium guajava in 2030. Finally, a cross tabulation was applied in order to calculate the Kappa Index of Agreement between the Markov chains 2030 Psidium guajava cover map and the Psidium guajava cover map calculated from the GEOMOD model.
3. Results Table 1 shows the Markov´s transition probabilities between various land covers. It is important to note that by the year 2030 there is a probability of about 44% that agricultural areas will have become covered by Psidium guajava, while for natural vegetation areas the probability is only about 13%. Ordinary least square regressions accomplished conditions of normality (Jarque-Bera test p value bigger than 0.05) and homoscedasticity (Breusch-Pagan test p value bigger than 0.05). In a Psidium guajava abundance regression, significant variables were aspect, elevation above sea level, humidity, slope and distance to the National Park. For the Psidium guajava canopy cover regression, significant variables were conductivity, humidity, elevation above sea level and distance to the National Park. For the Psidium guajava tree height regression: humidity, elevation above sea level and distance to the National Park were significant. Humidity and
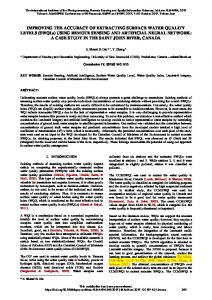
elevation above sea level were the only independent variables that were highly significant (1% and 5%) in the three regressions performed. The R-squared values for three regressions were 49% for abundance, 48% for canopy cover and only 19% for the squared tree height variable. These values show that the independent variables used are predictors of Psidium guajava spread and growth. Regression results are shown in Table 2. We obtained land cover maps of the study area at 60 meters resolution for the years 1980, 2001 and 2009. For every year of the study, we found that the areas of Psidium guajava are those with the largest number of patches compared with the other land cover types. However, the cover type that has the largest area is the natural vegetation. For the year 2001 and 2009 the sizes of Psidium guajava patches vary widely from less than one hectare to some thousands of hectares. The outcome of the CA_Markov_GEOMOD model was a two classes-based map that showed an approximation of Psidium guajava spread in 2030. The land covers maps of 1980, 2001 and 2009, as well as the 2030 Psidium guajava cover map are shown in Figure 2. Table 3 shows the Psidium guajava areas (Ha) throughout the 4 years of analysis: 4554.42 Ha in 1980, 9529.20 Ha in 2001, 11338.56 Ha in 2009 and 13620, 00 Ha in 2030. This means a growth of Psidium guajava areas of 4974,78 Ha between 1980 and 2001, and 1809,36 Ha between 2001 and 2009, with an average rate of advance of 231,515 Ha / year between 1980 and 2009, and a rate of advance of 108, 64 Ha / year between 2009 and 2030. Three characteristics were also noted in the three land cover maps and the model: the size increase of patches of Psidium guajava, the emergence of new, small patches of less than 1 hectare, and the connection of large patches that were previously isolated from each other. Finally, the overall Kappa obtained from the cross tabulation was 0,9227.
4. Discussion and conclusion The CA_Markov_GEOMOD model is a very useful approach that joins outcomes from Markov chains technique, driving factors following the logic of Cellular Automata (CA) and process from the GEOMOD model. From Markov chains transition probabilities, areas as well maps of future land covers can be calculated. These outcomes show a first inkling of future scenarios; however, these results are only based on the land cover change through different years without considering additional factors. The incorporation of the CA approach is more useful, because we can evaluate the change of a pixel not only based on previous land cover conditions, but on the values of that pixel and its neighborhoods, based on driving factors. Driving factors can be considered as phenomena that are presented in the study area that boost the land cover change. We are aware that the driving factors or explanatory variables used in this study (elevation and humidity), cannot explain all the complex processes and dynamics that could be present in the study area, and that neighborhood filters applied in GEOMOD processes, can lead to an incomplete reconstruction of scenarios (Poska et al 2008). Nevertheless, the results of the model do not cease to be valid since they indicate a general trend in land cover change in the study area, with important implications in Psidium guajava invasion analysis. GEOMOD works with two classes-based maps, and requires the quantity of each class at the ending time. In this study, the ending time considered was the year 2030, and the quantity used were the amount of Psidium guajava and non-Psidium guajava land covers obtained from Markov chains calculations. The quantities for the ending time could have been simply considered as the quantities in year 2001 (considering the time lag of 21 years from 1980), but the incorporation of the Markov chain quantities in the year 2030 (considering the time lag of 21 years from 2009), makes the model more practicable, due the use of a predictive quantity of Psidium guajava cover.
Considering factor images (driving factors) in the model allow results based on specific suitability values. In this case, higher values of humidity and elevation above sea level (values closer to 255) represent better conditions for Psidium guajava growth, that is to say, represent a better suitability for this species. In our study area, smaller Psidium guajava plants were found in lower altitude zones, and these zones are dryer than zones located in higher altitudes. This situation in the study area, supported with the regressions analysis and the results of experiences registered in the literature (Jacobi and Warshauer, 1992), allow us to assign higher suitability values to areas with higher humidity and higher altitude. Another option could have been applying multi criteria decision analysis (MDA) based on expert´s opinions for suitability analysis (Feizizadeh and Blaschke, 2012) which is an interesting approach because expertbased weights can be also applied. However, this approach has a subjective component, and the approach applied in this study is still interesting, because statistical analysis (regressions) was applied to confirm the best explanatory variables or driving factors. There are some limitations of the statistical analysis due to the kind of variables used and the sampling applied: only topographic, soil and distance variables were used, and the sampling was only performed in the farming zone due to logistical limitations. Nevertheless, as mentioned above, we consider that the parameters used in the model, as well as the results, are valid and useful: the driving factors chosen followed criteria obtained from field work observations, statistical analysis and literature review, and results can be considered as a very useful source of information for Galapagos National Park decision-makers. The results of the model revealed that Psidium guajava has advanced in the agricultural areas and National Park areas. In our study area, it is estimated that in the year 2006, compared to 1996, Psidium guajava had advanced almost 25% more in the agricultural areas and the National Park (Chiriboga et al., 2006). In 1997 it was estimated that almost the entire surface of the agricultural area was covered by forests of Psidium guajava (Delgado, 1997). Considering the results of this study, we can say that this situation remains virtually unchanged until the
present and furthermore, the results of the model show that without control, Psidium guajava is going to spread into further farming areas as well as in the National Park zone. Results of this study also show that Psidium guajava covered an area of 11338.56 Ha in the year 2009 and that in the year in 2030 it is going to cover an estimated area of 13620, 00 Ha. From an invasion control perspective, this situation is very complicated, due to logistic limitations: in general, when an exotic plant occupies an area exceeding 1000 hectares, it becomes very difficult to eradicate it due to time, effort and financial resources, and often the only viable solution is to no longer attempt the total eradication, but only invasion control (Rejmanek and Pitcaim, 2002). The Overall Kappa value showed a high match between the Markov chains result and the model result. This Kappa analysis shows that Markov chains is a practicable and very easy way to create future scenarios, and that complex models such as the CA_Markov_GEOMOD still require further research in order to find improved techniques of future land cover quantities assignment and additional analysis of model results evaluation. Conclusion This paper showed a useful mixed model to calculate future land cover scenarios, and applied the model to evaluate the future spread of an invasive plant in the Galapagos Islands. The method used in this investigation can be considered as a guideline for future studies that use remote sensing data and LULC change analysis, and the results obtained can be considered a contribution to the current knowledge of the process of exotic plants invasion in Galapagos, as well as a tool for present and future invasion control planning. Future research can consider other driving factors to enter into the
CA_Markov_GEOMOD:
socioeconomic factors (for example, human socioeconomic behavior in the study area) and biotic factors (for example, dissemination of Psidium guajava seeds by birds or mammals in the study area). Future studies can also consider advanced techniques for evaluating sensitivity and uncertainty of the model and compare different LULC change model approaches.
References Brown, J. and Sax, D., 2004, An Essay on Some Topics Concerning Invasive Species. Austral Ecology 29: 530–536. Callaway, R. and Maron, J., 2006, ¿What have exotic plant invasion taught us over the past 20 years? Trends in Ecology and Evolution 21 (7):369-375. Chiriboga, R. and Maignan, S., 2006, Historia de las relaciones y elementos de la reproducción social agraria en Galápagos. Ministerio del Ambiente del Ecuador. Chiriboga, R., Fonseca, B. and Maignan, S., 2006, Desarrollo de políticas y estrategias de manejo del sector Agropecuario y su relación con las especies introducidas en la Provincia de Galápagos. Ministerio del Ambiente del Ecuador. Chuvieco, E., 2002, Teledetección ambiental: La observación de la Tierra desde el Espacio. Ariel S.A. Spain. DeVries, T. and Tupiza, A., 1979, Dispersión y crecimiento del guayabo (Psidium guajava) y la dinámica de población del lechoso (Scalesia cordata) en Sierra Negra, Isla Isabela. Informe Anual 1979: 157. Estación Científica Charles Darwin. Ecuador. Delgado, P.I., 1997, Distribución de Scalesia cordata, sus interacciones con Psidium guajava y biología reproductiva, Isabela Sur, Galápagos. Pontificia Universidad Católica del Ecuador. Ecuador. Eckhardt, R., 1972, Introduced Plants and Animals in the Galápagos Islands. BioScience 22(10): 585-590. Feizizadeh, B. and Blaschke, T., 2012, Land suitability analysis for Tabriz County, Iran: a multi-criteria evaluation approach using GIS. Journal of Environmental Planning and Management: 1-23 Forman, R. and Godron, M., 1986, Landscape Ecology. John Wiley & Sons, Inc. USA. INGALA, 1987, Recursos Biofísicos de las Áreas de Colonización de la Provincia Insular de Galápagos. Proyecto PRONAREG-ORSTOM. Ecuador. Jacobi, J.D. and Warshauer, F. R., 1992, Distribution of six alien plant species in upland habitats on the Island of Hawaii. Alien Plant Invasions in Native Ecosystems of Hawaii: Management and Research. Stone, C.P., Smith, C.W. and Tunison, J.T., editors. Lambin, E.F., Geist, H.J. and Lepers, E., 2003, Dynamics of Land-Use and Land-Cover Change in Tropical Regions. Annual Review of Environmental Resources 28: 205–4.1 Martínez, J.A., 1999, Modelos Digitales de Terreno: Estructuras de Datos y Aplicaciones en Análisis de Formas del Terreno y en Edafología. Universitat de Lleida. Departament de Medi Ambient i Ciències del Sòl. Quaderns DMACS 25. McMullen, C.K., 1999, Flowering Plants of the Galapagos. Cornell University Press. USA.
Moore, I.D., Gessler, P.E., Nielsen, G.A. and Peterson, G.A., 1993, Soil Attribute Prediction Using Terrain Analysis. Soil Science Society of America Journal 57: 443-452. Paegelow, M., Camacho Olmedo, M.T. and Menor Toribio, J., 2003, Cadenas de Markov, evalución multicriterio y evaluación multiobjetivo para la modelización prospectiva del paisaje. GeoFocus 3: 22-44. Pontius, G.R., 2006, GEOMOD Modeling. Clark University. Pontius, G.R. and Malanson, J., 2005, Comparison of the structure and accuracy of two land change models. International Journal of Geographic Information Science 19:243–265 Poska, A., Sepp, E., Veski, S. and Koppel, K., 2008, Using quantitative pollen-based landcover estimations and a spatial CA_Markov model to reconstruct the development of cultural landscape at Rouge, South Estonia. Veget Hist Archaeobot 17:527–541. Rejmanek, M. and Pitcairn, M.J., 2002, When is eradication of exotic pest plants a realistic goal?.Turning the Tide: the Eradication of Invasive Species. Veitch, C.R. and Clout, M.N., editors. Schofield, E., 1989, Effects of Introduced Plants and Animal on Island Vegetation: Examples from the Galápagos Archipelago. Conservation Biology 3(3): 227-238. Sørensen R., Zinko, U. and Seibert, J., 2006, On the calculation of the topographic wetness index: evaluation of different methods based on field observations. Hydrology and Earth System Sciences 10: 101–112. Strayer, D., Eviner, V., Jeschke, J. and Pace, M., 2006, Understanding the long-term effects of species invasions. Trends in Ecology and Evolution 21(11): 645-651. Suárez, E., Tierney, G.L., Fahey, T.J. and Fahey, R., 2006, Exploring patterns of exotic earthworm distribution in a temperate hardwood forest in south-central New York, USA. Landscape Ecology 21: 297-306. TNC-CLIRSEN, 2006, Elaboración de Cartografía Planimétrica y Temática de las Islas Galápagos. Memoria Técnica. Ecuador. Thomas, M. and Reid, A., 2007, ¿Are exotic natural enemies an effective way of controlling invasive plants?. Trends in Ecology and Evolution 22(9): 447-453. Tso, B. and Mather, P., 2001, Classification Methods for Remotely Sensed Data. Taylor and Francis Group, Great Britain. USA. Vázquez, J.I. and Oliver, J., 2008, Evolución de autómatas celulares utilizando algoritmos genéticos. Universidad de Deusto. Spain. Vitousek, P.M., D´Antonio, C.M., Loope, L., Rejmánek, M. and Westbrooks, R., 1997, Introduced species: a significant component of human-caused global change. New Zealand Journal of Ecology 21(1): 1-16. Wolfram, S., 1984, Cellular automata as models of complexity. Nature 311: 419 – 424.
Tables Table 1. Markov chain transition probabilities Table 1 Native vegetation
P. guajava
Agriculture
Settlement
Wilderness
Native vegetation
0.845
0.127
0.007
0.000
0.022
P. guajava
0.173
0.608
0.211
0.000
0.008
Agriculture
0.004
0.438
0.524
0.001
0.000
Settlement
0.000
0.091
0.182
0.727
0.000
Wilderness
0.1253
0.016
0.000
0.000
0.858
Table 2. Results of ordinary minimal squared regressions related to factors of Psidium guajava growth and spreading. Table 2. Results of ordinary minimal squared regressions related to factors of Psidium guajava growth and spread. Significance levels of every independent variables are shown: 1% (*), 5% (**), n= 90 Total abundance
Canopy cover
Trees height
R2= 0,49
R2= 0,48
R2= 0,19
Variable
Coeficient
Constant
0,9789
pH Conductivity
Stand. Error
Coeficiente
Stand. Error
Coeficiente
Stand. Error
0,6013
1432,5
5084.619 *
1,6940
21,5465
0,1221
0,0834
-30,1407
705,1309
2,7529
2,9880
0,0022
0,0019
-59,9114
15,6714 *
0,0868
0,0664
Humidity
-0,0943
0,0345 *
-784,5933
292,1985*
-2,6889
1,2382**
Aspect
-0,0010
0,0004 **
6,9887
3,9236
0,0207
0,0166
Elevation
-0,0005
0,0002 **
-6,0531
1,7471*
0,0214
0,0074*
Slope
-0,0279
0,0064 *
-64,8181
53,9316
0,1163
0,2285
Dist. to GNP
-0,0001 7,0789e-005
1,5019
0,5986*
-0,0061
0,0025**
Jarque-Bera
4,0378
4,5864
2,3686
BreuschPagan
10,9663
15,9219*
12,2123
Table 3. Area of Psidium guajava in years 1980, 2001, 2009 and 2030 Table 3 Year
P. guajava (Ha)
1980
4554.42
2001
9529.20
2009
11338.56
2030
13620.00
Figures Figure 1. Study Area Location Map Figure 2. Land cover maps and CA_Markov_GEOMOD model Figure 1
Figure 2.