Using Sonification to Teach Network Intrusion Detection: A Preliminary Usability Study
Miguel A. Garcia-Ruiz, Arthur Edwards, Raul Aquino-Santos University of Colima, School of Telematics, Colima, Mexico {mgarcia, arted, aquinor}@ucol.mx Miguel Vargas Martin, University of Ontario Institute of Technology, Faculty of Business and Information Technology, Oshawa, Canada Ricardo Mendoza-Quezada Autonomous University of Aguascalientes, Aguascalientes, Mexico
[email protected]
Abstract: Network intrusion detection, or NID (the unauthorized perpetrations of people and computer viruses in a computer network) is a complex topic to teach, because students have to study extensive amounts of data from network logs and identify intricate patterns of perpet rations, making these tasks visually tiring, among other problems. This paper describes ongoing research concerned with designing and applying sounds that represent meaningful information in interfaces (sonification) to support teaching of NID. An exploratory usability test was conducted with engineering students to receive feedback and determine if sound effects (auditory icons) and musical sounds (earcons) effectively represent information on network attacks. A post-activity questionnaire shows that most students preferred auditory icons for studying NID, and all of them were very interested in the design and application of new types of sonifications. We plan to apply our proposed intrusion detection system to a server with bio-molecular information working as a test bed.
Introduction Security incidents perpetrated on computer networks have dramatically increased over the past twenty years, significantly affecting domestic and international security, electronic commerce, and corporate and personal information systems. A network intrusion can be defined as a person or software that gains access to a networked computer system without authorization, violating established security policy (Northcutt and Novak, 2002). One of the main problems caused by intruders is that they take over or consume resources for their own benefit (e.g., bandwidth, processing power, or services), and compromise vulnerable systems. In some cases, even non-vulnerable systems are affected by the massive propagation of malicious software attacks such as denial-of-service (DoS) or computer worms. Network intrusion detection (NID) has been generally dealt with using sophisticated software and statistical analysis, although sometimes it has to be done by human specialists, either by detecting the intruders in real time or by revising network logs, making this a time-consuming and tedious task. Consequently, more network security specialists are needed than ever to cope with the problem of network intrusion. Bishop (2002) states that there is a shortage of network and Information Assurance (IA) professionals in the marketplace, in part, because there are few educational institutions offering specialized Network Intrusion Detection and Information Assurance courses. Recognizing the current shortfall of skilled professionals, countries like Japan and China are establishing specialized IT universities and colleges, as well as creating training certifications on network security (Ahlgren et al., 2005). Intrusion detection analysis is one of the core topics that must be taught in computer security courses, either in classrooms or in computer labs (Frank and Wells, 2002). However, teaching NID is not a trivial task. For ethical and practical reasons, publicly available network logs should be used for teaching NID, such as the U.S. Department of Defense Advanced Research Projects Agency (DARPA) dataset (MIT Lincoln Laboratory, 1999). Despite known flaws in the DARPA dataset, we believe it suffices for preliminary student practices. Moreover, students have to
learn many NID issues, such as types of attacks and covering techniques, and “footprints” of typical human and software-based network attacks, commonly done at the network server ports at given times and even dates. A student carrying out the NID process can be easily confounded by harmless network accesses that look like a threat (a false positive), or malicious accesses that go undetected (a false negative). Thus, NID is a time -consuming (but very important) process of discerning between malicious and non-malicious attacks registered in network logs and in real time. A number of pedagogical techniques have been devised for teaching Network Intrusion Detection. Frank and Wells (2002) agree that an effective way of teaching NID is to have students continuously practice network analysis at the computer laboratory. Jones and Romney (2004) set up a honeypot (also termed honeynet) as a real-time case study for undergraduate and graduate students. A honeypot is a computer system designed to attract hackers and malicious software to a particular and controlled port of a computer network. This gives students the opportunity to observe and learn typical and state-of-the-art attacks and techniques that happen in real time. Carlson (2004) proposes a technique where students analyze web pages of real hackers to identify (with caution) their possible attack profiles and intentions, and set up a network server. The analysis of network logs and network ports by students in real time can be visually tiring and can possibly overload their visual sensory channel (and their working memory) if it is performed repeatedly. We propose using sound parameters to represent information on attacks and footprints present in the network log, in addition to the log visualization.
Network Sonifications Auditory Display is the branch of Computer Science that studies non-speech sound applications to represent meaningful information and actions in a computer interface (Kramer, 1994a). Sounds can be very effective in Human-Computer Interaction (HCI) for discriminating data patterns, mapping complex information, and representing alarms, as long as the sounds are correctly designed and adapted to the computer interface. However, sounds can be unpleasant if they are played too loud, or distract persons who are in close proximity (Shneiderman and Plaisant, 2004). This difficulty may be solved, however, by careful sound design (Brewster et al., 1995). Another alternative is to have the network analyst wear headphones, to avoid disturbing people nearby. Sonification (also called auralization) is the action of mapping data onto parameters of non-verbal sound, such as volume, pitch, timbre, duration, frequency, amplitude, and rhythm in a computer interface (Kramer, 1993; Kramer et al., 1997). Sonification has been used in a number of fields, and has also been successfully applied to computer networks and particularly to conduct NID analysis. Barra et al. (2001) and Gilfix and Couch (2000) used sound parameters to effectively represent web server status, working as alarms to inform the network administrator about web malfunctions and other issues regarding email spam, high load, and excessive network traffic. Varner and Knight (2001) developed an audio/visual and an agent-based system to monitor a network and identify malicious attacks in real time. Gopinath (2004) conducted a study where mapped data from network logs signaled malicious attacks by identifying false positives and denial-of-service (DoS).
Our Approach Sonification has been researched and employed successfully in educational settings to help students study structures and identify “bugs” of computer programs (Vickers and Alty, 2005), to demonstrate mathematics concepts on complex datasets (Upson, 2001), and for learning molecular information in Chemistry (Garcia -Ruiz and GutierrezPulido, 2006), to mention some applications. An obvious and important use of sound in education is in interfaces for visually impaired and blind students, used to replace visual information (Cohen et al., 2006; Walker et al., 2004; Shepherd, 2001). Sound can be a powerful medium to motivate and engage students (Kramer, 1994b), to maintain their attention on particular information details and relationships, support the identification of information patterns and trends, serve as a “mnemonic device” for students to help recall “chunks” of information, and favor learning styles (Kramer et al., 1997). In addition, sonification may alleviate the problem of visualization overload (Brewster, 1997) of network logs by coding information into both the auditory and visual human sensory channels. The latter has been proposed elsewhere in Garcia -Ruiz, Vargas Martin, and Green (2006). Our preliminary research question
studies whether this coding may serve as an effective tool for helping students in NID analysis, as well as engage them in the process. Another research question asks whether this tool can lower the cognitive load of persons trying to understand and associate the relationships between the types of network attacks, the network ports and the times they occur. Our research is based on the Cognitive Load Theory (Sweller, 1988; Chandler and Sweller, 1991), which states that effective learning takes place when the working memory load of individuals is kept to a minimu m in order to facilitate knowledge transfer to their long term memory, in which cognitive load can be decreased by adding non-redundant auditory and visual learning materials to the working environment.
First Prototypes of a Network Log Sonification This research explores technical aspects of sound parameters and sound delivery techniques that may serve to develop educational applications of network log sonifications. For instance, we are testing stereophony, pitch, and timbre to find out whether they can effectively communicate the magnitude of network attacks, identify their patterns and work as auditory alarms. To test our idea of using sonification to teach NID, we have generated two sonification prototypes of a network log (MIT Lincoln Laboratory, 1999). This log is a text file that was generated by a network intrusion detection system of the Defense Advanced Research Projects Agency (DARPA), which has been declassified and made publicly available for educational and research use, and contains markers of five types of possible attacks. We used the log as is, without modifications. A fragment of this log is shown in Table 1. 259 01/23/1998 17:04:29 00:00:05 telnet 2020 23 192.168.1.30 192.168.0.20 1 port-scan 261 01/23/1998 17:04:29 00:00:04 ftp 2022 21 192.168.1.30 192.168.0.20 1 port-scan 262 01/23/1998 17:04:29 00:00:03 finger 2023 79 192.168.1.30 192.168.0.20 1 port-scan 268 01/23/1998 17:04:30 00:00:04 rsh 2030 1021 192.168.1.30 192.168.0.20 1 port-scan 269 01/23/1998 17:04:30 00:00:04 rlogin 2031 513 192.168.1.30 192.168.0.20 1 port-scan 270 01/23/1998 17:04:29 00:00:05 exec 2032 512 192.168.1.30 192.168.0.20 1 port-scan 308 01/23/1998 17:05:08 00:00:37 telnet 1042 23 192.168.1.30 192.168.0.20 0 310 01/23/1998 17:05:31 00:00:01 smtp 1048 25 192.168.1.30 192.168.0.20 0 311 01/23/1998 17:06:00 00:00:01 finger 1050 79 192.168.1.30 192.168.0.20 0 Table 1. A fragment of the DARPA network log used in our studies. One sonification prototype contains auditory icons (sound effects of animals) and the other has earcons (sounds of piano notes). Auditory icons can be defined as sound effects found in nature that represent information or actions at the computer interface (Gaver, 1986). Similarly, earcons are composed of short musical sounds made of string, wind or percussion instruments, and represent actions or information in interfaces (Blattner et al., 1989). We developed a program in Tcl language (Ousterhout, 1994) that makes calls to the freeware audio processing program Sound Exchange (Sox) to generate the log sonifications. Our Tcl program can generate sonifications of other network logs as well.
Sonification Prototype No. 1 A .WAV file with the log sonification and auditory icons was generated using our program. These are the mappings of auditory icons to the five types of attacks registered in the log: • • • • •
A frog sound is mapped to “guess” A cat sound is mapped to “rcp” A horse sound is mapped to “rsh” A cock sound is mapped to “rlogin” A bird sound is mapped to “port-scan”
Sonification Prototype No. 2
We generated a second sonification using earcons (piano notes). These are the mappings of earcons to the five types of attacks registered in the log: • • • • •
A 128Hz key note is mapped to “guess” A 197Hz key note is mapped to “port-scan” A 263Hz key note is mapped to “rcp” A 525Hz key note is mapped to “rsh” A 1056Hz key note is mapped to “rlogin”
Each line of the log with no possible attack is mapped to a 0.125 second of silence. The mappings were assigned randomly. The sounds were played in stereo with the intention to ease discrimination of sound and attack mappings. In prototype 1, the leftmost sound played in the left channel is the frog sound. The rightmost sound played in right channel is the bird sound. In prototype 2, the leftmost sound played in left channel is the 128Hz piano key note. The rightmost sound played in right channel is the 1056Hz piano key note. All auditory icons and earcons were about 1 second long. We chose these sounds because we wanted to use five distinguishable sounds in terms of their average frequency (pitch) and timbre. Another reason for choosing these sounds is that they are not commonly heard in classrooms, which we feel may help hold student attention and not easily be confused with typical classroom sounds, such as a door opening, a sound of a chair dragging, etc. The auditory icons were obtained from a set of CDs of sound effects, produced by the company P.D.I., S.A. from Spain, published in the year 2000. The piano key sounds were obtained from various Web sites offering publicly available sounds, and were edited with the Cool Edit program. To ease identification of the mappings, in future developments we will let participants choose sound effects from a repertoire. Both sonifications that we generated with our program were recorded in .WAV format and can be downloaded from http://docente.ucol.mx/~mgarcia/Sonificatedlog.htm. Each earcon and auditory icon was edited following the guidelines for using sounds at the interface of Brewster et al. (1995), Mynatt (1994), and Kramer (1994a).
Preliminary Usability Study A series of studies are being devised to see if auditory icons and earcons in our sonification prototypes are an effective pedagogical tool for analyzing network intrusion detection in network logs. The purpose of our preliminary usability study is to obtain student feedback on the delivery media and types of sound sources to represent network attacks, and thus modify them or choose other types of sounds or sound parameters. Usability studies are needed because it has been found that educational software with high usability has a positive support for learning (MacFarlane et al., 2005). Usability measures, among other aspects, the efficacy, effic iency, errors, and pleasantness of use of a computer interface (Dumas and Redish, 1999). The sonification prototypes we developed were initially and informally tested by two of our project participants using a pair of closed-cup Maxell Studio Series HP-2000 headphones. After playing the sounds back and trying to identify the types of attacks, they commented that the auditory icons (the animal sounds) were more useful than earcons (the piano sounds) to recall better their mappings of the attack types. We believe this is possibly because the students use the animal sounds and visualize the corresponding animal, thus actually combining two senses. What follows describes a usability test carried out with Telematics engineering students.
Design A usability test was carried out with a group of students. After the test, we administered a post questionnaire with questions that collected subjective opinions on the sounds quality and sound sources for representing attacks in NID.
Materials
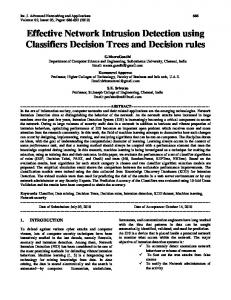
A set of Labtec Pulse 475 computer speakers (a pair of speakers and a subwoofer, rated at 28 Watts RMS) was used for playing the sonifications. We used this set of speakers because of its low cost, easy transport, simple set up, good audio fidelity, and loudness. The speakers were mounted on tripods in front of the classroom to ensuring all students could easily listen to the sounds. The speakers were placed at a height of approximately 1.80 meters and both the speakers and subwoofer were placed in front of the classroom. A laptop connected to a data projector was used to show the test objective and the log sound mappings, as well as play the prototype sonifications. The speaker set up is shown in Figure 1. The sonification prototypes earlier described in this paper were used in the test.
Figure 1. Some test participants and the speaker setup.
Participants Twenty-nine Telematics Engineering students were asked to voluntarily participate in the usability test. The students averaged 20 years (3 female and 26 males), representing both the size and the composition of a typical class at the College of Telematics. Although most of the students knew the basics of Computer Networks, none of them knew of network intrusion detection in depth. Sixteen participants had received differing degrees of musical training or knew how to play a musical instrument.
Procedure The usability test was conducted in one of the classrooms of the College of Telematics, thus assuring ecological validity to the test. The purpose of the test and its sound mappings were explained to the students using a Powerpoint projection. The students listened to the sound mappings (auditory icons and earcons) and watched their corresponding network values four times. After that, students listened to the two sonification prototypes only; the Powerpoint projection was turned off. The auditory icons’ sonification was played first. After playing the sonification, a number of questions were asked, including: How many auditory icons could you identify? What is the auditory icon mapping to “port-scan” and “rlogin”? Next, the earcons sonification was played, and the same questions again asked. After playing the sonifications, a usability questionnaire was administered to the students.
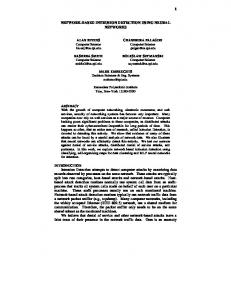
Preliminary Results According to the answers from the post-questionnaire, nineteen students (66%) preferred using auditory icons (the animal sound effects) for analyzing NID in further Network Security classes, while only seven students (24%) preferred using earcons. Only three students preferred using both auditory icons and earcons in class (See Figure 2).
The post questionnaire included a 5-point Likert opinion scale (1=strongly agree, 5=strongly disagree) asking whether the played sonifications were annoying for the students. The statistical mean of the answers for this scale was 4. Other Likert-scale results are depicted in Table 2. Table 3 shows condensed results of open questions from the post activity questionnaire, which asked whether what types of sounds (auditory icons and earcons) students recommended for representing further hackers and software (viruses or worms) attacks on a computer network.
10% 24%
Earcons Auditory icons Both 66%
Figure 2. Student sonification preferences
Likert scales
Average scale value The sounds volume level (loudness) was perceived as adequate 1 The sounds were clearly heard 2 The auditory icons were useful for recalling the attacks 1 The earcons were useful for recalling the attacks 5 Both earcons and auditory icons can be useful for learning NID 2 Table 2. Opinion scales of the questionnaire (1=strongly agree, 5=strongly disagree)
Sounds for making earcons
Sounds for making auditory icons Guitar Breaking glass Electric guitar Breaking china (plates) Drums Water stream Trumpets Thunder Violin Nature sounds Bass Rain Chello Beach waves Piano Cars crashing Flute Screams Dog barking Table 3. A condensed list of sounds students suggested for earcons and auditory icons representing network attacks.
Conclusions
There was no student consensus about which sounds would best represent a hacker or software attacks using auditory icons and earcons. Interestingly, one student suggested using Morse code to represent NID. In addition, a number of students suggested using spoken words to name the attack types. Further study is needed to see whether Morse code or spoken words are useful for representing network attacks without increasing student cognitive load. Auditory icons appear to perform better in identifying attacks, although more formal usability tests are needed to confirm this. It seems that the auditory icons and the earcons played at different stereo positions helped students to identify better the mappings of the network attacks and their corresponding auditory icons. Also, the speaker position was very effective for conveying a stereo sound effect. Other usability studies will determine whether other types of speaker systems like headphones and home-theater speaker sets can be effective for perceiving and better discriminating the mappings of the earcons and auditory icons onto network attacks. Our preliminary usability study provided important insights on the use of auditory icons and earcons to support network intrusion detection in network education. All students showed interest in sound design and application to the subject of Computer Networks, and enjoyed the opportunity to suggest new types of sounds for constructing further sonifications. This sonification design and construction per se could be effective for supporting NID teaching. Our next usability study will be designed to obtain educational gains from the sonifications, particularly on student motivation, engagement, and ways to discern and recall the types of network attacks. Future tests will measure student cognitive load using NASA Task Load Index (TLX) instrument (Hart & Staveland, 1988). We are planning to apply our proposed NID system to a computer server with bio-molecular information (it contains 3D graphical models of organic molecules and genetic sequences), working as a test bed, which is being used for educational applications and for research at the University of Colima, Mexico.
References Ahlgren, M., Breidne, M., Hektor, A. (2005). IT Security in the USA, Japan and China. A Study of Initiatives and Trends within Policy, R&D, Industry and Technology. Swedish Institute for Growth Policy Studies, Stockholm, Sweden. Barra, M., Cillo, T:, De Santis, A., Petrillo, U.F., Negro, A. and Scarano, V. (2001). Personal WebMelody: Customized sonification of web servers. Proceedings of the International Conference on Auditory Display (ICAD), Espoo, Finland. Bishop, M. (2002). Computer Security Education: Training, Scholarship, and Research. IEEE Computer 35 (4) Privacy and Security Supplement pp. 30-32 . Blattner, M. M., Sumikawa, D. A., and Greenberg, R. M. (1989). Earcons and icons: their structure and common design principles,” Human–Computer Interaction, vol. 4, pp. 11–44. Brewster, S.A., Wright, P.C. & Edwards, A.D.N. (1995). Experimentally derived guidelines for the creation of earcons. In Adjunct Proceedings of HCI'95, Huddersfield, UK. Brewster, S.A. (1997). Using non-speech sound to overcome information overload. Displays, Special issue on multimedia displays, 17, pp 179-189. Carlson, D. (2004). Teaching Computer Security. SIGCSE Bulletin. Vol. 36 no. 2 Chandler,P. and Sweller, J. (1991). Cognitive load theory and the format of instruction. Cognition and Instruction, 8(4), 293-332. Cohen, R. F., Meacham, A., and Skaff, J. (2006). Teaching graphs to visually impaired students using an active auditory interface. In Proceedings of the 37th SIGCSE Technical Symposium on Computer Science Education SIGCSE '06. ACM Press, New York, NY, 279-282. Dumas, J.S., and Redish, J.C. (1999). A practical guide to usability testing. Exter, England: Intellect, Ltd; Revised edition.
Frank , C.E. and Wells, G.A. (2002). Tutorial on laboratory exercises for a computer security course. Consortium for Computing in Small Colleges. Garcia-Ruiz, M.A. and Gutierrez-Pulido, J.R. (2006). An overview of auditory display to assist comprehension of molecular information. Interacting with Computers, 18(4), pp 853-868. Garcia-Ruiz, M.A., Vargas Martin, M., Green, M. (2006). Towards a Multimodal Human-Computer Interaction to Analyze Intrusion Detection in Computer Networks. In Proceedings of the First Human-Computer Interaction Workshop (MexIHC), University of the Americas, Puebla, Mexico. Gaver, W. W. (1986). Auditory icons, using sound in computer interfaces. Human– Computer Interaction, vol. 2, pp. 167–177. Gilfix, M. and Couch, A. (2000). Peep (The network auralizer): Monitoring your network with sound. Proceedings of 14th System Administration Conference (LISA XIV), New Orleans (LA) USA. Gopinath, M.C. (2004). Auralization of intrusion detection system using Jlisten. Unpublished thesis, Birla Institute of Technology and Science, India. Hart, S. G. & Staveland, L. E. (1988). Development of NASA-TLX (Task Load Index): Results of empirical and theoretical research. In P. A. Hancock and N. Meshkati (Eds.), Human Mental Workload (pp. 139-183). North Holland: Elsevier Science Publishers B. V. Jones, J.K. and Romney, G.W. (2004). Honeynets: An educational resource for IT Security. Proceedings of SIGITE’04, ACM. Kramer, G., ed. (1994a). Auditory display: Sonification, audification, and auditory interfaces. Santa Fe Institute Studies in the Sciences of Complexity, Proc. Vol. XVIII. Reading, MA: Addison-Wesley. Kramer, G. (1994b) Some organizing principles for representing data with sound. In G. Kramer (ed.) Auditory display: Sonification, audification and auditory interfaces Proceedings of the First International Conference on Auditory Display (ICAD). 185-221. Santa Fe Institute Studies in the Sciences of Complexity, Proc. Vol. XVIII, 85-221. Reading, MA: Addison Wesley. Kramer, G., Walker, B., Bonebright, T., Cook, P., Flowers, J.H., Miner, N., Neuhoff, J., et al. (1997). Sonification report: status of the field and research agenda. Available at: http://www.icad.org/websiteV2.0/References/nsf.html MacFarlane S, Sim G, Horton M. (2005). Assessing usability and fun in educational software. In Proceeding of the 2005 Conference on interaction Design and Children. Boulder, Colorado. Mayer, R.E. (2001). Multimedia Learning. : New York, NY: Cambridge University Press. MIT Lincoln Laboratory (1999). DARPA intrusion http://www.ll.mit.edu/IST/ideval/data/data_index.html.
detection
evaluation:
Data
sets.
Available
at:
Mynatt, E. D. (1994). Designing with auditory icons: how well do we identify auditory cues?. In Conference Companion on Human Factors in Computing Systems (Boston, Massachusetts, United States, April 24 - 28, 1994). C. Plaisant, Ed. CHI '94. ACM Press, New York, NY, 269-270. Northcutt, S. and Novak, J. (2002). Network Intrusion Detection. Third Edition. Indianapolis: Sams Publishing. Ousterhout, J. (1994). Tcl and the Tk Toolkit, Addison-Wesley: Reading, MA. Shepherd, I. (2001). Providing Learning Support for Blind and Visually Impaired Students Undertaking Fieldwork and Related Activities, University of Gloucestershire. Available at: http://www.glos.ac.uk/gdn/disabil/blind/index.html Shneiderman, B., Plaisant, C. (2004). Designing the User Interface: Strategies for Effective Human-Computer Interaction. Fourth edition. Boston, MA: Addison-Wesley. Sweller, J. (1988). Cognitive load during problem solving: Effects on learning. Cognitive Science, 12 (1): 257-285. Upson, R. (2001). Sonifications as mathematics teaching tools. In: Hiipakka, J., Zacharov, N., Takala, T. (Eds.), Proceedings of the 2001 International Community of Auditory Display (ICAD), Espoo, Finland.
Varner, P.E. and Knight, J.C. (2001). Security monitoring, visualization, and system survivability. IEEE/SEI. Information Survivability Workshop (ISW).. Vickers, P. and Alty, J. L. (2005). Musical program auralization: Empirical studies. ACM Trans. Appl. Percept. 2, 4, 477-489. Walker, B. N., Lindsay, J., and Godfrey, J. (2004). The audio abacus: representing numerical values with nonspeech sound for the visually impaired. In Proceedings of the 6th international ACM SIGACCESS Conference on Computers and Accessibility Assets '04. ACM Press, New York, NY.
Acknowledgements The authors would like to thank the PROMEP grant program from the Mexican Ministry of Education, the School of Telematics of the University of Colima, Mexico, and the Natural Sciences and Engineering Research Council of Canada (NSERC), for their support.