Using Test Data for Successive Refinement of an Online Pre-Course in Mathematics Katja Derr1, Reinhold Hübl1 and Mohammed Zaki Ahmed2 1Baden-Wuerttemberg Cooperative State University Mannheim, Germany 2Plymouth University, UK
[email protected] [email protected] [email protected] Abstract: Prior knowledge in mathematics has repeatedly been found related to study success in engineering, making its lack a variable to identify “at risk” students. Not all secondary school graduates are equally prepared to meet the demands of an engineering programme; different school types and mathematics curricula lead to broad differences in basic knowledge. As a remedy, universities offer pre-courses or bridging courses in mathematics, more and more frequently employing e-learning or blended learning programmes. The paper describes the development of an online course for study preparation in mathematics. The design process is accompanied by a research project that analyses both quality of the learning material and performance of the participants. In a multiphase research design repeated evaluations of test results, questionnaire data and statistical information are used to revise and successively improve the programme. The overall goal is to build a precourse that meets the demands of the group of prospective engineering students. The main research interest is to build a consistent data model that relates students’ personal and demographic backgrounds, prior knowledge in mathematics, and learning outcomes in the pre-course. In the first design phase, or pre-study, the most relevant issues that should be addressed in the further course of the project were identified, applying qualitative methods to question (or confirm) quantitative outcomes. Based on these results, learning material and quantitative tools were modified, and re-evaluated. The final data model for the main study is based on three quantitative sources: pre- and posttest performance, personal questionnaire, and evaluation questionnaire. The results so far reveal a highly heterogenic learner group regarding cognitive and metacognitive variables. While many students are able to close minor gaps via self-study, others lack the ability to selfregulate and need support structuring and monitoring the learning process. Thus different learning scenarios, from self-study to blended learning to online tutoring, were provided and evaluated in 2014. In the article examples for the use of learning analytics in the developmental design process and the latest version of the programme are given. The pre-posttest design’s reliability was increased based on statistical analyses of students’ test results. Test results then could be related to known predictors of mathematics performance, e.g. school grades, or attitude towards mathematics. Analytics were also made accessible for students by relating individual results to the peer group’s overall score. Finally, pretest results were used to cluster students with similar results and assign them to matching learner groups. In the further course of the project the data collected in the pre-course will be related to external datasets, like first year exams in mathematics, and overall study success. It will be investigated if and how these correlate with learning progress in the pre-course and predictive variables like prior knowledge, type of secondary school, or attitude towards mathematics. Findings are incorporated into a joint research project funded by the German Federal Ministry of Education and Research (www.optes.de). Keywords: e-assessment, design based research, self-study, mathematics, STEM
1. Introduction / background In the last decade, the number of students entering higher education has grown considerably, entailing an increase in diversity of educational background (Lawson, 2003). Not all first year students are adequately prepared for their chosen course of study, and especially in engineering it is quite challenging to close gaps in school mathematics and at the same time meet the demands of the course programme. The “lack of preparedness” (Croft et al., 2009: 109) has not only been observed in the UK (Appleby et al., 2000) but in Germany as well (Fischer and Biehler, 2011). As a result, preparatory courses in Mathematics have become the rule rather than the exception. In these courses, school contents are recapitulated and related to mathematics at university level, thus trying to ease the transition from secondary to tertiary education. E-learning or blended learning courses are one approach to address the heterogeneous group of pre-course participants as they allow for higher flexibility in both content provision and time management. The project described in this paper was initiated in 2010 and started with an entry-test, learning modules provided as pdf-files, an online posttest and an evaluation questionnaire. Based on the first year’s experiences it was decided to build up an online self-study platform, combined with a research project monitoring not only test and evaluation results but the design process as well. The pre-study that was conducted in 2011 and 2012
173
Katja Derr, Reinhold Hübl and Mohammed Zaki Ahmed led to the selection of a set of didactical, technical and motivational issues that were addressed in the subsequent years.
1.1 Multiphase design and learning analytics An open design approach seemed appropriate for the project as students could benefit from the programme at an early stage. Learning material and evaluation tools were developed successively, and data collected from each cohort helped the designers to improve the following release. The focus on development allowed identifying problems not anticipated by the designers and addressing them immediately. This approach has been suggested for projects that involve the development, roll-out, and evaluation of information technology, or elearning software (Richey et al., 2004). It takes into account that educational designs cannot be completely specified by the designers; interactions between participants (teachers, students), and the learning material will almost inevitably influence the setting, and may interfere with the research interest. A developmental design approach allows using the openness of the situation and investigating a set of variables and correlations between them instead of just one (Wang and Hannafin, 2005). With the technology at hand to collect and administer large datasets it has become easier to follow this proposition. “Educational data mining” (Romero and Ventura, 2010) has been found valuable for analysing and predicting student performance (Macfadyen and Dawson, 2010) as well as for operational decision making. As for the mathematics pre-course, a learning analytics approach was used to investigate the relation between domain-specific prior knowledge, learner behaviour, and learning success. With reference to known predictors of mathematics achievement personal and demographic data were collected, as well (Mullis et al., 2009; Fischbach et al., 2013). For each evaluation, test and questionnaire data collected from the LMS (learning management system), were analysed and, if needed, conceptual changes made. In order to triangulate the information derived from the quantitative tools a set of group interviews with pre-course participants was conducted in 2011 and 2012. This combination of qualitative and quantitative evaluation helped to decide the priorities for the further course of the project (Creswell & Plano Clark, 2011).
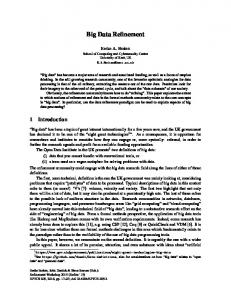
2. Project overview The self-study programme in mathematics is open for all prospective students at the faculty of engineering. The course starts each year at the beginning of July, thus leaving three months’ time for study preparation. Participation is voluntary and access to the e-learning resources is free of charge. In the privacy statement students are informed that their results and user data are treated confidentially and will be anonymised. The technical platform is an installation of the free LMS Moodle. Figure 1 shows an overview of the self-study programme’s elements in the version enacted in 2014. The e-learning platform provides an initial diagnostic test, learning modules covering ten basic mathematical fields, and a final control-test. Students that still perform poorly in the latter are advised to visit additional mathematics tutorials during the first semester.
Figure 1: Overview of the pre-course elements and collected datasets
174
Katja Derr, Reinhold Hübl and Mohammed Zaki Ahmed
2.1 Data sets and sample 2.1.1 Quantitative data Pre-and posttest: As a measure of prior mathematics knowledge the diagnostic entry-test is the starting point of the learning programme. Its role is to inform students of their level of basic mathematics knowledge meets the demands of their chosen degree programme. If deficits are identified the diagnostic test feedback then enables students to plan and structure their learning. The pre-course is concluded by the control-test which is taken at the university’s computer labs during induction week. In the last four years the number of complete datasets (pretest + posttest + demographic information) increased from 69% in 2011 to 84% in 2014. Table 1: Number of students and pre-course participants from 2011 to 2014 pre-study First year students
2011 724
2012 876
2013 738
2014 722
Pre-and posttest participation
506
654
604
603
Posttest only
212
197
121
105
Missing
6
25
13
14
Inventories: Two online questionnaires were used to collect statistical data and evaluate the e-learning programme. The first questionnaire covered demographic and personal data, e.g. gender, type of secondary school, mathematics school grades, and attitude towards mathematics. The second questionnaire addressed satisfaction with the e-learning programme, e.g. level of difficulty, usability, and technical performance. 2.1.2 Qualitative data In order to better understand students’ problems with and expectations of the preparatory course two sets of group interviews with first-year students were conducted during the pre-study (2011: n = 14; 2012 n = 11). After transcription the interview statements were clustered to 1. feedback on learning contents (e.g. level of difficulty, intelligibility of texts), 2. feedback on usability, and 3. students’ individual learning strategies. Based on these data the evaluation questionnaire was revised, adding items addressing students’ attitude towards mathematics learning, effort regulation, and helpfulness of different didactical elements of the e-learning design (see also section 3.2). 2.1.3 Description of the samples (2011-2014) On average, thirteen per cent of the students were female which is representative for the gender relation in engineering degree programmes in Germany (cf. National Report on Education, 2012). The majority of first-year students (70%) were either 19 or 20 years old. Roughly a quarter of each year’s cohort already lived near the university, but most participants came from other areas in Germany. The most frequently attended secondary school type was the “Gymnasium” (approx. 70%), followed by subject-related secondary schools (“Berufliches Gymnasium”, 15%), and schools leading to “Fachhochschulreife”, a certificate that allows studying at Universities of Applied Sciences only (10%). Asked about their mathematics grades at school, more than 25% of the participants claimed that they had performed very good (A*/A) in mathematics, 52% good (A/B), 19% average (B/C) and 2% below average (D and lower) (2% stated that they had nearly all grades from A to D). A comparison of the four cohorts revealed similar distributions in the collected demographic variables, indicating that the student body does not change significantly from year to year.
2.2 Main design revisions based on pre-study data Quantitative and qualitative pre-study outcomes revealed a set of minor problems that could be solved rather quickly, e.g. technical issues or the revision of learning contents that were found too difficult or too complex. These general evaluation outcomes will not be reported in detail. The following two aspects were considered most relevant for the didactical concept of the pre-course: Formative e-assessment: Nearly all interview or open question comments revealed a high approval of online tests, and many participants demanded even more opportunities to self-assess. It therefore was decided to put
175
Katja Derr, Reinhold Hübl and Mohammed Zaki Ahmed a focus on the formative e-assessment concept and use its potential for activation and motivation (Black et al., 2003). Modularisation: Regarding the learning process, student feedback was far from homogeneous. While many students wanted to learn independently, and alone, others claimed to need additional support and missed faceto-face sessions. Considering the differences in participants’ starting positions and their personal situation in the phase between school and university it was decided to modularise the programme, with different learning scenarios open for self-selection. In the remainder of this paper three examples are provided that document the use of learning analytics to address these issues. With the high importance of the diagnostic test for all subsequent learning activities it was decided to analyse the test’s reliability, and that of the pre-posttest design (see section 3.1). Furthermore, the diagnostic entry-test feedback was revised (section 3.2) and elements of the modularised programme are described in section 3.3.
3. Design revisions 3.1 Analysis and improvement of quantitative tools: pre-posttest design Placement tests in Mathematics are not mandatory at German universities, therefore no standardised test items were available for the development of the diagnostic test. The joint mathematics curriculum as suggested by a group of educators from different school systems and university engineering faculties was used as a reference (see cosh, 2014; and Core zero curriculum, SEFI, 2002). Furthermore, suggestions from the university’s mathematics lecturers were incorporated into the first version of the test. The posttest, documenting a student’s knowledge level at the end of the pre-course, was designed to be equally difficult, but consisted of different items as suggested for single group pre-posttest designs (Kane, 2013). After being reviewed by three experts (mathematics lecturers) and a test-run with university students, both tests were published on the e-learning platform. The first cohort’s test results then served as a database for classical and probabilistic item analyses. Inter-item and item-test-correlations helped to identify outliers, or items that did not correlate with the overall test results. An IRT (Item Response Theory) approach was used to model each item’s difficulty. In IRT, item difficulty and participant ability are related to each other in an interdependent equation, with item properties expressed by level of difficulty and discriminating power. The probability that participants will answer an item correctly is thus influenced by these properties, in relation to their abilities (Hambleton and Swaminathan, 2010). Items that do not fit the model are likely to be unfair, as they address a hidden trait. For example, a mathematics problem might be embedded in a narrative that demands a high level of verbal proficiency. As all items were dichotomous, a simple Rasch analysis could be performed (Embretson, 1996). For the Rasch analysis the free R software package eRm was used (Mair and Hatzinger, 2007) (all other analyses were performed with SPSS, Version 20). Items unfit to the model were considered for revision or replacement, so that each year the number of outliers could be minimised. In 2013 both tests’ internal consistency was considered acceptable (Cronbach’s α between .910 in the pretest and .852 in the posttest) and in 2014 the design remained unchanged. On average, fifty per cent of the entry-test items were answered correctly in 2013 and 2014. In both years, and in the pre-study respectively, variance was rather high (see Table 2). The average control-test results showed a moderate but significant increase in score (repeated measurement ANOVA for both years: p