Gaining access to contextual information when developing sales forecasts ...... Moon, M.A. and Mentzer, J.T. (1999), âImproving salesforce forecastingâ, Journal ...
The Emerald Research Register for this journal is available at www.emeraldinsight.com/researchregister
IJPDLM 34,2
140
The current issue and full text archive of this journal is available at www.emeraldinsight.com/0960-0035.htm
Using the assortment forecasting method to enable sales force involvement in forecasting A case study Johanna Sma˚ros Department of Industrial Engineering and Management, Helsinki University of Technology, Helsinki, Finland, and
Markus Hellstro¨m Candyking International Ltd, Helsinki, Finland Keywords Sales forecasting, Confectionery, Process efficiency Abstract The paper presents how a European pick-and-mix confectionery company has employed a new forecasting approach – assortment forecasting – to reduce significantly time spent on forecasting by working with an entire assortment at a time instead of producing a forecast for each product individually. The implementation of a less time-consuming forecasting method has enabled the company to involve its salespeople in forecasting and in this way gain access to their product and market knowledge. The case company’s implementation of the new forecasting method is described and its forecasting accuracy and time spent on forecasting before and after the implementation are measured. The results demonstrate a remarkable increase in forecasting efficiency as well as improved communication within the company.
International Journal of Physical Distribution & Logistics Management Vol. 34 No. 2, 2004 pp. 140-157 q Emerald Group Publishing Limited 0960-0035 DOI 10.1108/09600030410526932
Introduction Surveys examining corporate forecasting practices indicate continuing widespread use of judgmental and opinion-based forecasting methods in parallel with or even in preference to quantitative methods (Sparkes and McHugh, 1984; Herbig et al., 1993; Sanders and Manrodt, 1994). In the context of estimating future sales, surveys conducted by, for example, Dalrymple (1988) and Peterson and Jun (1999) have demonstrated that judgment is the most important method of practical sales forecasting. Although some researchers argue against the use of judgmental forecasting methods when statistical methods are available (Armstrong, 2001) and point out the risk of attaining biased results when using judgmental techniques (Makridakis, 1988), authors such as Basu and Schroeder (1977), Edmundson et al. (1988), and Fildes (1991) have shown that judgmental forecasts using contextual data can, in fact, be significantly more accurate than quantitative The authors wish to thank Tekniikan Edista¨missa¨a¨tio¨ and Emil Aaltosen Sa¨a¨tio¨ for their financial support.
forecasts. The importance of access to contextual information, such as knowledge of competitor activities, is highlighted by Webby and O’Connor (1996); based on a literature review, they conclude that access to contextual information appears to be the prime determinant of judgmental superiority over statistical methods. Gaining access to contextual information when developing sales forecasts requires involvement of experts with market, product, and customer knowledge. Often these experts can be found in a company’s sales and marketing departments (Reese, 2000). Involving sales and marketing people in forecasting is suggested not only to improve the quality of the sales forecast, but also to improve communication within the company and reduce the problem of every department working based on its own goals and forecasts (Fosnaught, 1999; Helms et al., 2000). Attaining sales force involvement in forecasting is, however, not easy. Many salespeople consider time spent on forecasting as time taken away from their real job of selling (Moon and Mentzer, 1999). There is a clear need for tools and methods that enable not only accurate, but also as quick and easy forecasting as possible. In this paper, we use a case study approach to examine a new forecasting method – assortment forecasting – that has been proposed to support judgmental forecasting. The case company is a European pick-and-mix confectionery company that has recently implemented the assortment forecasting method with the aim of shifting forecasting responsibility from the company’s purchasing function to its sales function. The paper starts with a brief literature review. It continues by describing the methodology used. Next, the assortment forecasting approach and some results of its implementation at the case company are discussed. Finally, some conclusions and suggestions for further research are presented. Literature review Existing literature looks at sales force involvement in forecasting from several angles: the need for involving the sales and marketing departments in forecasting, organizational and motivational problems related to involving salespeople in forecasting, and guidelines for setting up a working forecasting process that utilizes input from a company’s sales force. The need for sales force involvement in forecasting Although quantitative techniques are arguably very useful and often should be part of a company’s forecasting process, they have certain weaknesses that can be counterbalanced by the use of qualitative forecasting. (Fulcher, 1998; Moon and Mentzer, 1999; Helms et al., 2000). Quantitative time-series techniques are designed to identify and forecast trends and seasonal patterns in data and to adjust quickly to changes in these trends or patterns. Their limitation is that
Assortment forecasting method 141
IJPDLM 34,2
142
they do not consider contextual information, such as price changes (Mentzer and Schroeter, 1994). Regression analysis makes it possible to take such factors into consideration, but the complexity of the method and its significant data requirements limit its use (Lapide, 1999). Neither of the methods does well in dealing with changes that have never happened before, or that have happened before but for which no data exist in the system. This is where expert judgment can add significant value to the forecasting process. (Mentzer and Bienstock, 1998). Situations in which expert judgment is needed include, in addition to the price changes mentioned above, assortment changes, promotions, competitor activities, and product introductions. The best information concerning these situations oftentimes resides with the company’s marketing and sales personnel (Fulcher, 1998; Fosnaught, 1999; Moon and Mentzer, 1999; Helms et al., 2000; Jain, 2000; Reese, 2000). Achieving sales force involvement in forecasting Although both researchers and practitioners seem to agree that sales force involvement in forecasting is important, benefiting from it in practice can be difficult. Several motivational, organizational, and tool-related obstacles have been identified. In their in-depth study of the sales forecasting management practices at 33 companies, Moon and Mentzer (1999) found there to be some resistance from salespeople concerning their forecasting responsibilities in almost all of the companies studied. Many salespersons felt that it was not their job to forecast and that time spent on forecasting was time taken away from their real job of managing customer relationships and selling products and services. Similar observations have been reported by Helms et al. (2000) and Reese (2000). According to Reese (2000), these motivational problems are often aggravated by the lack of forecasting incentives; salespersons are seldom rewarded for producing accurate forecasts. Moreover, Moon and Mentzer (1999) claim that even when companies get salespeople to forecast, they tend to do a relatively poor job. As they put it: [. . .] even when the salespeople are provided with a history of their customers’ demand patterns, they frequently will either see patterns that do not exist, or will fail to see patterns that do exist (Moon and Mentzer, 1999).
Based on their research, Moon and Mentzer (1999) have compiled a set of guidelines for overcoming the barriers that hinder companies from fully benefiting from sales force involvement in forecasting. They suggest that companies should: . Make forecasting part of the salespeople’s job by including forecasting as a part of their job descriptions, creating incentives for high performance in forecasting, and providing feedback and training.
.
.
.
Minimize game playing by making forecasting accuracy an important outcome for salespeople and clearly separating sales quotas from forecasts. Keep it simple by asking salespeople only to adjust statistically generated forecasts rather than producing forecasts from scratch and by providing them with adequate tools that enable them to complete their forecasting work as efficiently as possible. Keep it focused by having the salespeople deal only with the products and customers that are truly important and where their input can significantly affect the company’s supply chain.
The first two recommendations concern organizational and motivational factors, such as rewards, job descriptions, and training. The other two are about creating forecasting processes and tools that support sales force involvement by making forecasting simpler, more efficient, and more focused on the products and customers that really matter. These latter ones are the focus of this paper. Methodology We examine a new forecasting approach – assortment forecasting – presented by Holmstro¨m (1998). The approach has been designed to support judgmental forecasting and make it more efficient. Instead of producing a sales forecast for each product individually, the approach is based on working with an entire product range, an assortment, and adjusting the products’ relative positions within this assortment. The product level sales forecasts are then derived based on the products’ estimated positions within the assortment. (We will present the approach in more detail in a later section.) When introducing the assortment forecasting method, Holmstro¨m (1998) also presented some initial test results. However, since the results were somewhat mixed and not derived from an actual forecasting situation, the practical applicability of the suggested forecasting method is still unknown. The aim of this study is to further examine the usefulness of the assortment forecasting method and to answer the following research question: “Can the assortment forecasting approach be employed to facilitate successful sales force involvement in forecasting?”. The research is, thus, hypothesis testing in nature, a research design that, for example, Mentzer and Kahn (1995) strongly encourage. The research follows a case study approach. The first known actual implementation of the assortment forecasting is documented, and the resulting impact on the case company’s forecasting performance is measured. Case company The case company operates in several European countries and is represented by a regional business unit in each of its markets. The company’s business
Assortment forecasting method 143
IJPDLM 34,2
144
model is to provide supermarkets, video rentals, cinemas and the like with a broad assortment of pick-and-mix sweets from several confectionery suppliers. The company also provides its customers with in-store display equipment and merchandising services, i.e. it runs the entire pick-and-mix category on behalf of its customers. The company works with an assortment consisting of some 200 different products. The assortment is very dynamic. New products are frequently introduced and old ones delisted. In addition, campaigns and seasons introduce fluctuations in demand. Traditionally, the company’s sales forecasts have been developed by the regional business units’ purchasing departments to support their own purchasing decisions. Although the purchasing departments have done a good job, the lack of sales force involvement has caused noticeable problems. Poor communication between sales and purchasing has, for example, resulted in last minute deliveries when purchasing has been taken by surprise by unexpected product introductions. Similarly, late information concerning product delistings or campaigns has occasionally caused inventory management problems such as excess stock or stock-outs. Although shifting the forecasting responsibility from purchasing to sales has been identified as a key improvement opportunity, the lack of suitable tools to support sales force involvement in forecasting has hindered development. Since the sales people do not, in general, have any experience of forecasting and have very limited time to spend on producing the forecast, the forecasting tools and the whole process should be very easy and quick to use. The company’s traditional forecasting tools and methods have not been able to provide the necessary support. In 2000, the company heard of the assortment forecasting approach. The same year, it conducted some initial data analyses and tests, which produced promising results, and concluded that the new forecasting approach presented an opportunity to streamline forecasting and shift the forecasting responsibility from purchasing to sales. In 2001, a spreadsheet tool supporting the new forecasting approach was developed and tested. The first actual implementation took place in January 2002, when the sales force of the company’s Swedish business unit started using the new forecast approach for producing sales forecasts. The company is currently expanding the use of the new forecasting approach to its other markets as well. Data collection and analysis Information about how the assortment forecasting approach was implemented at the case company was attained by interviewing the company’s logistics manager, who supervised the entire development process from initial tests and tool development to actual implementation. The logistics manager was interviewed on several occasions during the years 2000-2003.
In addition to the interviews, quantitative analyses examining the impact of the new forecasting approach on the case company’s forecasting accuracy as well as the time spent on forecasting were conducted. These two performance measures were selected as they reflect the objectives of the company: to increase its forecasting efficiency by reducing time spent on forecasting and to increase its forecast accuracy by eliminating the problems caused by poor communication. The company’s forecast accuracy was calculated by comparing forecasts developed four weeks in advance with the actual realized sales. The forecast accuracy before and after the implementation was measured in order to evaluate the impact of the new forecasting approach. The forecast and sales information was extracted from the company’s enterprise resource planning (ERP) system. The change in workload was calculated using estimates from the purchasing department who produced the forecasts before the implementation of the new forecasting approach and comparing them to estimates received from the sales personnel producing the forecasts after the implementation. Access to information on the implementation and to the forecast performance data needed for the analyses was volunteered by the company. Due to the researcher’s prior knowledge of the assortment forecasting method as well as her position as an “outsider”, the company considered her a suitable observer, capable of producing an unbiased assessment of the implementation of the forecasting approach. The assortment forecasting method The solution implemented by the case company builds on Holmstro¨m’s (1998) original idea, but has been slightly adapted to better suit the company’s needs. The original idea Holmstro¨m (1998) argues that traditional forecasting methods often are inefficient since the same forecasting operation – be it a time series calculation or expert judgment – needs to be repeated for each product separately. When there are many products and the forecasting process includes qualitative elements, this often means that forecasting requires much time and feels tedious. As an alternative, Holmstro¨m promotes the idea of working with an entire product range – an assortment of products catering to the same customer need – at a time. The suggested forecasting approach consists of the following steps: (1) Estimate ranks for products within the assortment, i.e. put them in ascending order based on their expected unit sales. (2) Estimate the assortment’s total unit sales. (3) Use a scaling function to divide the assortment’s total unit sales between the individual products based on their ranks.
Assortment forecasting method 145
IJPDLM 34,2
146
According to Holmstro¨m (1998), the value of the assortment forecasting method is based on taking advantage of the fact that it is easier to forecast the total sales of an assortment than the sales of each individual product. The method also enables sales and marketing people to give input in a format, product ranks, which is convenient and fits their way of thinking. When changing the ranks of selected products within the assortment, ranks and, thus, forecasts are automatically adjusted for the other products, as well. If, for example, the forecaster decides to change a product’s rank from seventh to third in the assortment, the product’s forecasted share of total assortment sales will automatically be increased, while the ranks of the products previously ranked third to sixth will be decreased, causing their forecasted shares to decrease. This means that product dependencies and cannibalisation effects (Cadeaux, 1997; Safavi, 2000) are taken care of automatically. This makes it possible to focus on the most relevant products, the top sellers, and the most important events, such as campaigns and new products introductions, and in this way speed up the forecasting process. As Holmstro¨m (1998) points out, the most critical part of the assortment forecasting method, and a key factor affecting its applicability, is the scaling function used to model the relationship between the products’ ranks and their share of total assortment sales. Selecting the appropriate scaling function can be difficult. In his article, Holmstro¨m (1998) suggests that a logarithmic function of the following form be used: Share ðrankÞ ¼
1 ðrank þ constantÞ1þpower
:
ð1Þ
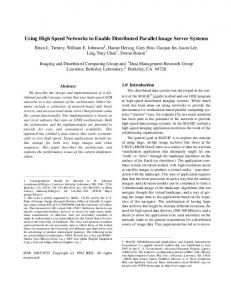
The relative weight of the higher ranks can be increased by decreasing the constant or increasing the power. The scaling function would typically be calculated based on an assortment’s historical sales data, but according to Holmstro¨m (1998) it may be necessary to make judgment-based changes to the function. As an example, he presents a real-life situation where an assortment’s second most selling article was removed, altering the sales distribution of the entire assortment. To produce accurate forecasts, the salespeople would, therefore, have needed to forecast total assortment sales, product ranks, as well as the shape of the scaling function. The case company’s approach When the case company first got interested in the assortment forecasting method, it did some data analyses to examine what the sales distribution of its assortment looked like. By analysing historical sales data, the case company noticed that a relationship between the product ranks and their shares of total assortment sales could be identified. In addition, despite varying total sales, product changes, and shifting popularity of the individual products (Figure 1), the relationship, i.e. the scaling function, looked rather similar from week to
Assortment forecasting method 147
Figure 1. The Swedish business unit’s total sales vary during the year
week (see Figure 2). The idea of using a scaling function to divide total assortment sales between the individual products was thus supported by the company’s sales data. The company first tried to use a logarithmic function to model the relationship between product rank and share of total sales, as suggested by Holmstro¨m (1998). This approximation, however, introduced a significant error. The logarithmic function simply did not correspond accurately enough with the actual distribution.
Figure 2. The assortment’s sales distribution is rather stable despite varying total sales of example weeks
IJPDLM 34,2
148
The company, therefore, decided to try a different approach and use a historical sales distribution as the scaling function. The scaling function was formed by calculating the average shares corresponding to different product ranks over a period of several randomly selected weeks. The historical distribution was then tested and, as it worked well, selected to be the scaling function. After identifying a suitable scaling function, the company started testing the approach in practice. After several steps of trial and error, the company’s current forecasting process emerged: (1) Load sales and forecast data from the company’s ERP system into the spreadsheet tool. (2) Delist products that will be removed from the assortment. (3) Update product ranks: start with top-selling products and move downwards, focus on most important products and changes. Use products’ historical ranks as an aid. (4) Add and rank new products. (5) Select the scaling function. (Although it is possible to select different scaling functions, in practice usually the same one is always used.) (6) Estimate total assortment sales. (7) Use the tool to calculate product level sales forecasts and load the forecast data into the ERP system. The first step is very simple: the forecaster, i.e. the salesperson, just clicks on a button and all the necessary background information – realized sales and previous forecasts – are loaded from the company’s ERP system into the spreadsheet used for forecasting. Steps 2-4 concern the products’ ranks. The salesperson first delists the products that will be removed from the assortment. Next he updates product ranks, starting with the top selling products and moving downwards. To make it easier to accurately estimate the ranks, the spreadsheet tool displays each product’s ranks for three historical weeks selected by the user, as well as the average rank of the product during these weeks. The salesperson can, for example, select three fairly recent weeks to look for potential trends in a product’s demand or look at last year’s ranks to examine seasonal factors. Finally, new products are added and ranked. When the ranking has been completed, it is time for Step 5, selecting the scaling function. The user can choose a predefined scaling function or he can create a new function based on the historical sales of a selected period, for example, Easter or Halloween. In practice, however, the salesperson currently only uses one predefined scaling function, which has been found to be fairly accurate and is regularly updated based on historical data. In step 6, the total weekly sales of the entire assortment are forecasted.
When all the necessary information has been inputted, the spreadsheet tool calculates the actual product level sales forecasts, which are then loaded into the ERP system. The sales function at the Swedish business unit develops product level forecasts for a rolling 52 weeks each month. Although the forecast period is one year, greater emphasis is placed on the upcoming months than on the long term forecast. If new information regarding, for example, promotions is attained, forecasts can be updated more frequently. Implementation results Next, we will examine how the implementation of the assortment forecasting method at the case company’s Swedish business unit has affected its forecasting performance and time spent on forecasting. Time spent on forecasting When introducing the new forecasting approach, the main objective of the case company was to shift the forecasting responsibility from its regional purchasing functions to its sales functions, where important business decisions concerning assortment changes and campaigns are made. However, to enable the shift, forecasting had to be made much simpler and quicker than it had previously been. Otherwise, the sales force would have neither the time nor the interest to forecast. Before the implementation of the new forecasting method, it took the purchaser of the case company’s Swedish business unit between one-and-a-half and two days per month to create the forecasts. The forecasts were developed product by product for a rolling 52 weeks on a monthly basis in the company’s ERP system. After the implementation of the assortment forecasting approach, time spent on forecasting has dropped to an average of two hours per month, although the salesperson producing the forecasts has no previous experience of forecasting. This means that forecasting only takes a small fraction of the salesperson’s time, letting him concentrate on his main job – selling – the rest of the time. The entire efficiency improvement cannot be credited to the new forecasting approach alone. Part of the improvement, corresponding to a few hours of work, is a result of replacing the inflexible ERP tool with a user-friendlier spreadsheet tool. However, the bulk of the improvement clearly comes from the opportunity of working with the entire assortment at the same time, focusing on products and events that really matter and spending very little time on the less important products. Impact on forecast accuracy In order to evaluate the Swedish business unit’s forecast accuracy before and after the implementation two measures were used: the weekly mean absolute percentage error (MAPE) and the median absolute percentage error (MdAPE)
Assortment forecasting method 149
IJPDLM 34,2
150
of product specific forecasts developed four weeks in advance. The absolute percentage error (APE) is calculated by dividing the absolute difference between a product’s forecast and actual sales with the product’s actual sales. The MAPE is the most commonly used sales forecast performance measure (Kahn, 1998) and is calculated by taking the weekly mean of the product specific APEs. The MdAPE is calculated by taking the weekly median of the product specific APEs, i.e. leaving out the best and the worst weekly forecasts. The forecasting accuracy of the Swedish business unit was satisfactory already before the implementation of the new forecasting method. The main target of the company was to improve communication of special events, such as product introductions and campaigns, by shifting the forecasting responsibility from purchasing to sales. In fact, there were some worries that the overall forecasting accuracy would drop as the forecasting responsibility was given to a person with no previous forecasting experience. When comparing the Swedish business unit’s forecasting performance before the implementation (weeks 8 to 48 in 2001) and after the implementation (weeks 8 to 48 in 2002) no obvious change in forecast accuracy could be detected. The MdAPE decreased from 29 per cent to 22 per cent, whereas the MAPE increased from 103 per cent to 137 per cent (Table I). There is a notable difference between the MdAPE and the MAPE. There are two reasons for this. First, since the company’s assortment includes a lot of small products for which the weekly variation in sales can be significant, sometimes extremely large forecast errors, even over 1,000 per cent, occur. These errors have a significant impact on the MAPE, although they do not affect the company’s operations in practice. Second, two seasons – Easter and Halloween – are notoriously difficult to forecast and have a significant impact on the MAPE as can be seen in Figure 3. Shift in responsibility reducing communication lead time The main reason why the confectionery company wanted to involve its sales force in forecasting was that it hoped that this would improve the communication between sales and purchasing and ensure that information on such events as product introductions and campaigns would be passed on more efficiently than before. When talking to company representatives, it seems that the goal of increased communication has been achieved at the Swedish business unit, although not fully. According to the logistics manager of the company, sales are now
Table I. Forecast error before and after the implementation of the new forecasting approach
Period Weeks 8-48, 2001 Weeks 8-48, 2002
MdAPE during period Average (%) SD (%) 29 22
37 14
MAPE during period Average (%) SD (%) 103 137
207 137
Assortment forecasting method 151
Figure 3. Weekly forecast errors (MAPE and MdAPE) before and after the implementation
increasingly committed to availability and the communication gaps have been reduced. Quantitative measurement of the change in communication efficiency is difficult. In this case, product introductions were monitored. The proportion of product introductions for which a forecast had been inputted into the ERP system on time (i.e. for which a forecast had been inputted into the ERP system at least four weeks before the product was introduced) before and after the implementation was calculated. The proportion of on-time forecasts was 33 per cent before the implementation and 54 per cent after the implementation (Table II), despite a significantly larger number of introductions in the latter period. Analysis of forecast accuracy Next, we will examine the forecast accuracy in somewhat more detail. We look at the three main components of the assortment forecast approach – product ranks, total sales, and the scaling function – and examine the accuracy of each of these components. The first component of the assortment forecasting is the ranking of the products. The rank error was calculated by comparing each product’s forecasted rank to its actual rank and taking the absolute value of this Proportion in 2001a (%)
Proportion in 2002b (%)
Table II. Timeliness of forecasts for product Forecast on time 33 54 introductions before and Forecast delayed by one-two weeks 33 23 after the Forecast delayed by three weeks or more 33 23 implementation of the Notes: a Total amount of product introductions during weeks 8 to 48 in 2001: 12; b Total amount assortment forecasting of product introductions during weeks 8 to 48 in 2002: 52 approach
IJPDLM 34,2
152
difference. On average, the absolute rank error of the 20 best selling products was 3.2 positions. For the top 50 products the average rank error was 4.9 positions, and for all products 8.1 positions (Table III). Based on the results, it can be concluded that there is some room for improvement as far as the top 20 products are concerned, but that the general accuracy is good. The second component of the assortment forecasting approach is estimating total assortment sales. During weeks 8 to 48 in 2002, i.e. after the implementation of the new forecasting approach, the MAPE of estimated total assortment sales was 16 per cent, despite significantly fluctuating sales (Figure 4). This must be considered a good achievement. The third and final component of the assortment forecasting approach is the scaling function used to link product ranks with shares of total sales. In Figure 5, the actual weekly sales distributions for weeks 8 to 48 in 2002 and the distribution used for producing the forecasts, i.e. the scaling function, are presented. As can be seen, the estimated distribution is quite close to the realized distributions. There is only one exception; week 48 has quite a different distribution than the other weeks. The top selling product this week stands for Average absolute error
Table III. Average absolute rank errors
Figure 4. Weekly total assortment sales and forecasts developed four weeks in advance
Top 20 products Top 50 products All products
3.2 4.9 8.1
Assortment forecasting method 153
Figure 5. Actual weekly sales distributions for weeks 8 to 48 in 2002 and sales distribution used for forecasting
more than 4.5 per cent of total sales, whereas the top seller usually represents between 2.75 per cent and 3.25 per cent of total sales. According to the logistics manager, the most likely reason for this unusual sales distribution is supply problems for one or more high-volume products. The unusual sales distribution has undoubtedly affected the forecast accuracy that week. Conclusions The objective of the research was to examine whether the assortment forecasting approach could be employed to facilitate successful sales force involvement in forecasting. Based on studying the implementation of assortment forecasting at the Swedish business unit of a European pick-and-mix confectionery company, the answer is yes. The implementation of the new forecasting approach has significantly increased forecasting efficiency and, in this way, enabled a shift of forecasting responsibility from the company’s purchasing function to its sales function. Benefits of the assortment forecasting method In his article, Holmstro¨m (1998) attributed three major strengths to the assortment forecasting method. First, he argued that the method’s top-down approach would enable it to take advantage of the typically very high accuracy of estimates of total sales. Second, he maintained that adjusting forecasts by updating product ranks would enable sales and marketing people to give input in a format that is more convenient and fits their way of thinking. Third, the assortment forecasting method should increase forecasting efficiency by allowing the forecaster to focus on the essential products and events. The results of the case study support these propositions. Despite significant weekly variation in total assortment sales, the business unit’s salespeople were
IJPDLM 34,2
154
able to produce accurate estimates on the aggregate level. This supports the ideas presented by Holmstro¨m (1998) as well as other researchers (Plossl, 1973; Muir, 1979) that estimating total product group sales is easier than estimating sales of individual products. In addition, based on the results of the case study, updating forecasts by adjusting product ranks seems to work well. The product rank accuracy was in general good, although there was some room for improvement in the top 20 products. Furthermore, Holmstro¨m’s (1998) suggestion that working with an entire assortment at a time and focusing on the most important products and events could increase forecasting efficiency was clearly validated. The implementation of the new forecasting method resulted in a striking reduction in the time spent on forecasting. In his article, Holmstro¨m (1998) identifies the scaling function, i.e. the function modelling the relationship between a product’s rank and its share of total assortment sales, as the weak point of the assortment forecasting method. However, in this case, the relationship between rank and share was very stable and, thus, easy to model, despite varying sales and a dynamic assortment. Limitations of the assortment forecasting method The results of employing the assortment forecasting method in the case company’s Swedish business unit can be considered very promising. However, to be able to evaluate the generalisability of the results, the business context in which they have been attained needs to be discussed. Several characteristics of the Swedish business unit’s situation make it a particularly attractive candidate for assortment forecasting and present potential limitations for its applicability in other business settings. First, the business unit’s assortment is very dynamic with frequent product introductions, delistings, and seasonal products as well as significantly varying total sales. Traditional time-series methods are, therefore, rather ill suited, presenting an opportunity for qualitative forecasting methods. In less dynamic assortments, the benefits of assortment forecasting in comparison to efficient, automated time-series methods are likely to be small or even non-existent. Second, the confectionery company’s assortment is very wide. This increases the stability of the assortment’s sales distribution, as individual products or events usually do not significantly affect the distribution. In narrower assortments there is always the risk of a forceful campaign or an important new product introduction shifting the whole sales distribution, thus hindering the application of the assortment forecasting approach. Third, as the confectionery company’s Swedish business unit uses direct store deliveries, it has access to very high-quality demand information. There is no additional party, such as a wholesaler or customer warehouse in between introducing order batching in the demand information. This means that the sales data accurately reflects actual product ranks and that products’ ranks do not move up and down without reason. When introducing the assortment
forecasting method in new markets where the confectionery company’s goods pass through wholesalers, the company has noticed that product ranks can behave irrationally due to order batching. Although there are means to filter out the distorting effect of order batching, access to high-quality demand information obviously supports implementation of the assortment forecasting.
Assortment forecasting method 155
Connection to previous findings Obviously, the value of a new forecasting approach cannot be conclusively established based on a single case study. However, even though the case study presented in this paper is the first known implementation of assortment forecasting, analogous, although somewhat less sophisticated forecasting approaches have been implemented before. McClelland et al. (2000) document how a Japanese apparel retailer’s store managers and assistants produce forecasts by giving garments ranks from 1 to 7, sorting the products according to their mean rank and rank standard deviation, and associating a certain share of sales with the “A”, “B”, “C”, and “D” products identified based on the ranking process. Two large US corporations also successfully use similar, slot-based forecasting approaches to forecast sales of shoes, music CDs, and computer software (Freeland, 2003). Their approaches are based on having merchandisers allocate products to a handful of different segments, or slots, based on the products’ estimated sales success. These previous implementations support the assumption that the use of ranks and scaling functions, rather than direct volume estimates, can be very useful in situations where: . large assortments of products catering to a similar need and competing for the same customer attention are offered; and . assortments are dynamic, having, for example, frequent product introductions. Discussion and further research As many studies demonstrate, judgmental methods play an important part in business forecasting (Dalrymple, 1988; Sanders and Manrodt, 1994). There is, thus, need for research on how the process of judgmental forecasting could be better supported and made more efficient. Holmstro¨m’s (1998) work – the assortment forecasting method – is a new and interesting approach to judgmental forecasting. Based on the results of the case study presented in this paper, the assortment forecasting method has the potential to reduce significantly time spent on judgmental forecasting. As increased efficiency is an important element in attaining sales force involvement in forecasting, this is an intriguing result. However, more testing and especially additional real-life implementations of the assortment
IJPDLM 34,2
156
forecasting approach or similar rank-based approaches are needed to understand fully the method’s potential benefits and limitations. In addition, since forecasting efficiency is an important prerequisite for forecasting collaboration, an interesting line of research would be to test the applicability of the assortment forecasting in inter-company collaboration. Finally, there are several opportunities to develop further the assortment forecasting method. In its current form, the method makes only limited use of traditional forecasting models. The performance of the assortment forecasting approach could potentially be improved by using, for example, time-series forecasting to produce a first suggestion of product ranks and total assortment sales, and then let the forecaster make qualitative adjustments. As the combination of judgmental and statistical forecasting is supported by several researchers (Bunn and Wright, 1991; Lim and O’Connor, 1996), it can be considered likely that by seizing this opportunity, a very useful new forecasting approach could be developed. References Armstrong, J.S. (2001), “Selecting forecasting methods”, in Armstrong, J.S. (Ed.), Principles of Forecasting, Kluwer Academic Publishers, Norwell, MA. Basu, S. and Schroeder, R.G. (1977), “Incorporating judgments in sales forecasts: application of the Delphi method at American Hoist and Derrick”, Interfaces, Vol. 7 No. 3, pp. 18-27. Bunn, D. and Wright, G. (1991), “Interaction of judgemental and statistical forecasting methods: issues & analysis”, Management Science, Vol. 37 No. 5, pp. 501-18. Cadeaux, J.M. (1997), “A closer look at the interface between the product lines of manufacturers and the assortments of retailers”, International Journal of Retail & Distribution Management, Vol. 25 No. 6, pp. 197-203. Dalrymple, D.J. (1988), “Sales forecasting practices”, International Journal of Forecasting, Vol. 3 No. 3, pp. 379-91. Edmundson, R.H., Lawrence, M.J. and O’Connor, M.J. (1988), “The use of non-time series data in sales forecasting: a case study”, Journal of Forecasting, Vol. 7 No. 3, pp. 201-11. Fildes, R. (1991), “Efficient use of information in the formation of subjective industry forecasts”, Journal of Forecasting, Vol. 10 No. 5, pp. 597-617. Fosnaught, K. (1999), “The strategic power of consensus forecasting: setting your organization up to win”, Journal of Business Forecasting Methods & Systems, Vol. 18 No. 3, pp. 3-7. Freeland, K. (2003), Personal communication, 14 August. Fulcher, J. (1998), “A common vision”, Manufacturing Systems, Vol. 16 No. 2, pp. 88-94. Helms, M.M., Attain, L.P. and Chapman, S. (2000), “Supply chain forecasting – collaborative forecasting supports supply chain management”, Business Process Management Journal, Vol. 6 No. 5, pp. 392-407. Herbig, P., Milewicz, J. and Golden, J.E. (1993), “Forecasting: who, what, when and how”, Journal of Business Forecasting Methods & Systems, Vol. 12 No. 2, pp. 16-21. Holmstro¨m, J. (1998), “Handling product range complexity: a case study on re-engineering demand forecasting”, Business Process Management Journal, Vol. 4 No. 3, pp. 241-58. Jain, C.L. (2000), “Editorial: which forecasting model should we use?”, Journal of Business Forecasting Methods & Systems, Vol. 19 No. 3, pp. 2-4.
Kahn, K.B. (1998), “Benchmarking sales forecasting performance measure”, Journal of Business Forecasting Methods & Systems, Vol. 17 No. 4, pp. 19-23. Lapide, L. (1999), “New developments in business forecasting”, Journal of Business Forecasting Methods & Systems, Vol. 18 No. 2, pp. 13-14. Lim, J.S. and O’Connor, M. (1996), “Judgmental forecasting with time series and causal information”, International Journal of Forecasting, Vol. 12 No. 1, pp. 139-53. McClelland, A.S., Raman, A. and Fisher, M. (2000), “Supply chain management at World Co Ltd.”, Harvard Business School Case N9-601-072. Makridakis, S. (1988), “Metaforecasting: ways of improving forecasting accuracy and usefulness”, International Journal of Forecasting, Vol. 4 No. 3, pp. 467-91. Mentzer, J.T. and Bienstock, C.C. (1998), “The seven principles of sales-forecasting systems”, Supply Chain Management Review, Fall, pp. 76-83. Mentzer, J.T. and Kahn, K.B. (1995), “A framework of logistics research”, Journal of Business Logistics, Vol. 16 No. 1, pp. 231-50. Mentzer, J.T. and Schroeter, J. (1994), “Integrating logistics forecasting techniques, systems, and administration: the multiple forecasting system”, Journal of Business Logistics, Vol. 15 No. 2, pp. 205-26. Moon, M.A. and Mentzer, J.T. (1999), “Improving salesforce forecasting”, Journal of Business Forecasting, Vol. 18 No. 2, pp. 7-12. Muir, J.W. (1979), “The pyramid principle”, Proceedings of 22nd Annual Conference, American Production and Inventory Control Society, pp. 105-7. Peterson, R.T. and Jun, M. (1999), “Forecasting sales in wholesale industry”, Journal of Business Forecasting Methods & Systems, Vol. 18 No. 2, pp. 15-17. Plossl, G.W. (1973), “Getting the most from forecasts”, Production and Inventory Management, Vol. 14 No. 1, pp. 1-16. Reese, S. (2000), “The human aspects of collaborative forecasting”, Journal of Business Forecasting Methods & Systems, Vol. 19 No. 4, pp. 3-9. Safavi, A. (2000), “Choosing the right forecasting software and system”, Journal of Business Forecasting Methods & Systems, Vol. 19 No. 3, pp. 6-10. Sanders, N. and Manrodt, K. (1994), “Forecasting practices in US corporations: survey results”, Interfaces, Vol. 24 No. 2, pp. 92-100. Sparkes, J.R. and McHugh, A.K. (1984), “Awareness and use of forecasting techniques in British industry”, Journal of Forecasting, Vol. 3 No. 2, pp. 37-42. Webby, R. and O’Connor, M. (1996), “Judgemental and statistical time series forecasting: a review of the literature”, International Journal of Forecasting, Vol. 12 No. 1, pp. 91-118.
Assortment forecasting method 157