USING THE RIGHT MODULUS OF ELASTICITY TO GET THE BEST GRADES OUT OF SOFTWOOD TIMBER SPECIES IN GREAT BRITAIN David Gil-Moreno1, Dan Ridley-Ellis2, Paul McLean3
ABSTRACT: The correct characterisation of modulus of elasticity in bending is fundamental for timber grading, especially when that property limits the allocation to a strength class. The aim of this paper is to empirically determine the relationship between EN 408 local and global modulus of elasticity using data from six British-grown conifer species and to investigate the recent change in EN 384 for the calculation of pure bending stiffness from global modulus of elasticity. For our data, the relationship between local and global modulus of elasticity was almost identical across species and for practical purposes one linear relationship could be used for all species. However our empirical relationship was considerably different to the default EN 384 calculation. Use of our empirical determined conversion substantially improves grading yields on this dataset compared to the default EN 384 calculation. We additionally investigated the effect of sample size on determining the conversion and found that using substantially less than 450 pieces required in EN 384 would be adequate in our case. A preliminary investigation of whether a special conversion according to the standard is required could be performed with fewer test pieces, but further testing is required to ensure safe grading.
KEY WORDS: Modulus of elasticity, Grading, Structural timber, Strength classes, Yields, European standards
1
INTRODUCTION 123
There are three properties that determine the strength grading of a population of timber: bending stiffness (or modulus of elasticity, E), bending strength (or modulus of rupture, fm) and density (). In order to attain a strength class, such as those specified in EN 338 [1] (Table 1), values of these three properties for a population of timber, subject to some adjustments [2], must at least meet the required values for that strength class. Table 1: Characteristic values for strength classes C14 to C24
EN 338 strength class Property C14 C16 C18 C20 C22 C24 fm,k N/mm2 14 16 18 20 22 24 Emean kN/mm2 7 8 9 9.5 10 11 k kg/mm3 290 310 320 330 340 350 Note: the characteristic value for E must equal or exceed 95% of the value given for the strength class.
1
David Gil-Moreno, Edinburgh Napier University, UK
[email protected] 2 Daniel Ridley-Ellis, Edinburgh Napier University, UK
[email protected] 3 Paul Mclean, NRS, Forest Research, UK,
[email protected]
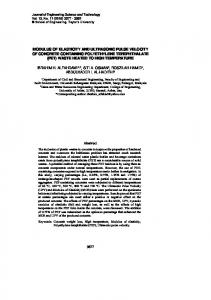
EN 408 [3] defines two methods for measurement of E via a four-point bending test. The global measurement of E is determined by the mid-span deflection in relation to the supports (Eglobal), while the local measurement of E is determined on middle third of the beam (Elocal) by the relative deflection of the middle of the beam (Figure 1). Elocal and Eglobal are related but there are key differences in what they are measuring. For Elocal the deformation is measured at the neutral axis as the average displacement of two transducers placed on each side face. Within this region of the four-point bending test, the bending moment is constant and so it is regarded to be under “pure bending”, where, theoretically, the shear effect does not exist. On the other hand, the deformation for Eglobal is measured at the centre of the span, typically from the centre of the tension edge. In this measurement, part of the deformation is due to shearing action between the support and load point. Regardless of the presence or absence of shear effects, the distribution and nature of defects, and experimental errors, play a key role in test results and therefore the comparison of Elocal to Eglobal. The smaller deflection and method of mounting make the measurement of Elocal more susceptible to errors and localised effects in the wood (e.g. splitting). The sensitivity to the exact positioning of the worst defect makes identification of it important, but it is not always easy in practice and what
is worst defect for strength (the priority) is not necessarily worst defect for stiffness. This also means results can be biased by the length of the specimens and the flexibility of positioning. The Eglobal measurement is an easier to implement test procedure, less sensitive to experimental error and exact positioning of the worst defect, but it does usually include a component of compression deformation at the supports and loading points which can be quite influential on the results. Nonetheless, the benefits of using Eglobal are considered to outweigh the disadvantages. Eglobal was added in the 2003 version of EN 408. Previously Elocal had been the standard method. In addition to the benefits outlined above, this also brought some equivalence with other testing standards (e.g. North America and Australia) [4]. However there remain differences in the associated European standards for timber grading: notably, EN 384 [5] requires that the worst defect be placed centrally in the test. The 0.95 factor applied to the stiffness requirement for the strength class is there to compensate for the difference between testing at the critical section compared to random positioning [2]. As Eglobal became the preferred measurement, the option of using measured Elocal was proposed to be removed from EN 384:2016, but it was retained primarily to allow use of test data that predates 2003. The move from Elocal to Eglobal measurement required an adjustment to bring the measurements in line with previous practice. This was incorporated in the form of an equation that adjusts Eglobal to an equivalent “shear free” stiffness (E0), representative of what had previously been obtained with the local measurement. This conversion is now provided as equation 7 in EN 384:2016. It is identical to that added to the 2004 version (contemporary to the addition of Eglobal measurement in EN 408:2003). The adjustment was originally formulated on the mean stiffness, but in practice was applied to individual results when calculating machine grading settings. Consequentially EN 384:2016 presents the equation as an adjustment for each specimen, this is given here as equation (1).
E0 Eglobal *1.3 2690 (N/mm2)
(1)
EN 408:2010, was amended in 2012 to prevent a double adjustment where the results are to be later used for EN 384 procedures. The ratio of Elocal/Eglobal and the influencing factors have been researched by a number of authors. Broadly speaking it is thought that the ratio Elocal/Eglobal is mainly affected by shear deformation for large dimensions specimens, and by the variation of stiffness within the specimen (especially the nature and exact position of the critical defect) for smaller dimension timber[4, 6]. The intrinsic assumption on which equation (1) is based is that the relationship between Elocal and Eglobal is homoscedastic. This assumption breaks down for two reasons. Firstly, as E decreases because stiffness cannot be negative. Recently, a grading dataset for British spruce (WPCS) [7] had to have two 22x47 specimens removed from the analysis because EN 384 calculated negative E0. Secondly, this equation is not mechanically consistent because much of the deformation measured by Eglobal is a consequence of the bending for Elocal. With standard EN 408 spans, and assuming measurements are not affected by experimental error, Elocal cannot be less than 0.326 Eglobal. (the limiting situation of perfectly stiff shear spans) [8]. This limit of plausibility is breached by the EN 384 equation when Eglobal is less than 2.76 kN/mm2. For these reasons, the 2016 version of EN 384 contains a new provision in relation to the adjustment to shear free stiffness: “If another relevant equation is available from test data, it shall be used instead…This alternative equation shall be established on at least 450 pieces, covering the full range of sizes, sources and quality corresponding to the intended use.” The provided equation is also now limited to softwoods in recognition that hardwoods may be substantially different. A number of researchers have proposed conversion equations over the years. Some are listed in Table 2. Different studies investigated the nature of the correlation between Eglobal and Elocal [9, 10], but since the change in EN 408 (2003) researchers have also considered the consequences for grading of using the EN 384 adjustment to E0. Table 2: Studies investigating the relationship Elocal:Eglobal. Elocal and Elocal in kN/mm2
Study [9] [10] [11] [12] [13] *
Figure 1. EN408 test arrangement (for beam of depth h)
Equation (1) is empirical, based on data from previous tests in Europe. It covers the various factors that govern the difference between Elocal and Eglobal, including shear deformation. This is why the shear adjustment, added to the calculation of global modulus of elasticity in
Elocal 10.8 11.4 8.9 12.4 12.3 to 15.4
Eglobal 9.8 10.8 8.1 11.4 11.5 to 14.0
Slope 1.18 1.13 1.1 1.21
Interc. - 856 - 800 -225 -1421
R2 0.89 0.82 0.63 *
1.28
2300
0.88
Not reported
A study conducted in Spain [11] with radiata pine (cross section 200x150 mm; Eglobal = 8.11 and mean Elocal = 8.92 kN/mm2) questioned the applicability of equation (1) but accepted that differences of timber allocation would be small and in favour of safety compared to the investigated regression ( Elocal Eglobal 1.1 225 , R2 = 0.63).
In [12] working with high stiffness German timber (Eglobal = 11,4 and mean Elocal = 12,4 kN/mm2) from four conifer species of different dimensions, the author recommended not to change the equation in EN 384. It was reported that an alternative equation would fit the data better, but the differences were small so not consequential in their case. In south Italy [13] a study investigated a linear equation for material from three softwoods and one hardwood. The parameters found for the overall equation was very close to the given in EN 384 ( Elocal Eglobal 1.28 2300 , R2 = 0.88) but again the mean stiffness was high (ranged by species from 11.5 kN/mm2 to 15.4 kN/mm2). The same study warned that “the conversion equation used (in EN 384) can have an important effect mainly for stiffness limited material” and so this reduces the yields. This is a particular concern in the British Isles where British spruce (a combination of about 90% Sitka spruce Picea sitchensis and 10% Norway spruce Picea abies), produces the vast majority of home-grown structural timber, but is stiffness limited [14] to lower strength class than the European grown timber previously used for most of the research. The British forest industry had previously studied the relationship for specimens of Sitka spruce, and produced conversion equations [15] that are very different to equation (1) The consequences for grading yields are commercially significant, and hard to appreciate from looking at correlations alone. The characteristic values for E is the mean while for strength and density it is the lower 5th percentile. Increasing the mean of a population requires the rejection of more specimens than increasing the 5 th percentile and so grading yields of stiffness limited timber can be affected quite strongly by relatively small changes in mean E. It is therefore necessary to additionally investigate impacts on grading that are a consequence of any conversion. The first aim of this study is to investigate the relationship between Eglobal and Eglobal on six conifer species in the UK, exploring the new possibility offered in EN 384 of establishing an empirical equation obtained locally at the test facility to calculate modulus of elasticity in pure bending (E0) from Eglobal. A simplified grading analysis is then used to examine the effects on yield, assuming a perfect grading machine. Secondly, the study explores the reliability of using a smaller number of specimens than the 450 specified by EN 384:2016.
2
MATERIAL AND METHODS
2.1 MATERIAL To negate effects of varying dimensions of test pieces, the data used here are only for nominally 50x100 mm cross section specimens. The material investigated in this paper comes from six species groups, named with common name, botanical name and the standard four letter code [7] respectively. The main commercial species are larch (Larix decidua, kaempferi and x eurolepis - WLAD) and Sitka spruce (Picea sitchensis PCST). For larch, the majority of the material was
obtained from normal sawmill production. For the Sitka spruce the majority of the material was obtained during scientific studies. In both cases the sampling covered the mainland Great Britain. These data were used previously as part of datasets for establishing grading machine settings. The other four species are: western red cedar (Thuja plicata - THPL), noble fir (Abies procera - ABPR), western hemlock (Tsuga heterophylla - THST) and Norway spruce (Picea abies - PCAB). This material was obtained from a scientific study investigating even-aged single species plantations. This timber was obtained from 109 trees (28 for western hemlock and 27 for the rest of species) spread across three growing environments, representative of the southern, middle and northern latitudes in Great Britain. Specimens were mostly produced following radial transects centred on the pith (Figure 2). Additional specimens were also produced from the remaining parts of some of the Norway spruce logs. The dataset used here consists of 252 pieces of larch, 194 of Sitka spruce, 138 of western red cedar, 127 of noble fir, 150 of western hemlock and 233 of Norway spruce. The total number of specimens is 1094. Hereafter when referring to data: full population is used to describe the 1094 pieces and species datasets are referred to by their four letter prefix.
Figure 2. Processing of a western red cedar log with a portable sawmill.
2.2 MECHANICAL TESTING All timbers were kiln dried and conditioned in a controlled environment prior testing in four point bending according to EN 408:2012. Global modulus of elasticity (Eglobal) and local modulus of elasticity (Elocal) were measured simultaneously (Figure 3). Following testing, a 50 mm length sample was cut near the failure point of each specimen to determine moisture content according to EN 13183-1 [16]. The measured global and local modulus of elasticities were then adjusted to 12% moisture content in accordance with EN 384 [5]. The fixed equation (1) given in the current EN 384 was used to convert the Eglobal to Elocal, hereafter referred to as EEN384.
samples being replaced between each draw. For each subsample draw we: i. Calculated a conversion equation for EPBG by linear regression for the draw, then used this to calculate EPBG for each piece in the full population of 1049 pieces. ii. Graded the full 1049 piece population by EPBG to achieve the target Emean. iii. Used the measured Elocal for the pieces passing grading to calculate a "true" pure bending Emean iv. Calculated the percentage of the “true” pure bending E0,mean achieved by the process of grading with the converted Eglobal.
Figure 3. Transducers for measurement of Eglobal (bottom face) and Elocal (side faces).
2.3 ANALYSIS The statistical analysis was made using R software version 3.2.5 [17]. 2.3.1 Relationship between Elocal and Eglobal The means of Eglobal and Elocal where compared with a paired t-test. EEN384 was compared to measured Elocal in the same way. We then investigated whether the linear relationship between Elocal and Eglobal changed according to dataset (set) by conducting an analysis of variance (ANOVA) on a General Linear Model which had the form: 𝐸𝑙𝑜𝑐𝑎𝑙 = 𝛼0 + 𝛼1 𝐸𝑔𝑙𝑜𝑏𝑎𝑙 + 𝛼2 𝑠𝑒𝑡 + 𝛼3 𝐸𝑔𝑙𝑜𝑏𝑎𝑙 𝑠𝑒𝑡 + 𝜀 (2)
Additionally, a conversion equation based a dataset that presented an obviously different relationship between Elocal and Eglobal was applied to the full population. This is referred to as ELOW and was derived using the THPL dataset. We investigated the yields obtained and compared those with results with EEN384 and EPBG. This analysis assumes the measured Elocal is the true measurement and so yields are relative to the yields obtained when grading based on Elocal, referred to as perfect grading.
3
RESULTS
3.1 RELATION BETWEEN ELOCAL AND EGLOBAL The comparison of Eglobal and Elocal with a paired t-test showed that they were significantly different (p = [3] EN 408:2010+A1:2012. Timber structures— structural timber and glued laminated timber— Determination of some physical and mechanical properties EN408:2010+A1:2012. European Committee for Standardization. [4] Boström, L.: Determination of the modulus of elasticity in bending of structural timber– comparison of two methods. European Journal of Wood and Wood Products, 57(2): 145-149, 1999. [5] EN 384:2016. Structural timber-Determination characteristic values of mechanical properties and density. European Committee for Standardization. [6] Ridley-Ellis, D., Moore, J. and Khokhar, A. M. Random acts of elasticity: MoE, G and EN408. In: WG meetings COST Action E53 "Quality Control for Wood and Wood Products" and Wood Drying Seminar in Bled, Slovenia, 2009. < http://researchrepository.napier.ac.uk/2520/>. [7] EN 13556:2003. Round and sawn timberNomenclature of timbers used in Europe. European Committee for Standardization. [8] Ridley-Ellis, D.: Impact of clause 5.3.2 in EN 384:2010 on grading of timber - Report to UKTGC. Technical Report. Edinburgh Napier University, 2011. < http://researchrepository.napier.ac.uk/9773/> [9] Solli, K.H.: Modulus of elasticity—local or global values, In Proceedings of the 6th World Conference on Timber Engineering, 2000. [10] Holmqvist, C., Boström.: Determination of the modulus of elasticity in bending of structural timber—comparison of two methods, Proceedings of the 6th World Conference on Timber Engineering, 2000. [11] Iñiguez Gonzalez, G.: Clasificación mediante técnicas no destructivas y evaluación de las propiedades mecánicas de la madera aserrada de coníferas de gran escuadría para uso estructural, Doctoral dissertation, EITS Montes, 2007. [12] Denzler, J., Stapel, P., Glos, P., Relationship between global and local MOE. CIB W18 Meeting 41, St. Andrews, Canada, Paper 41-10-3. 2008 [13] Nocetti, M., Brancheriau, L., Bacher, M., Brunetti, M., Crivellaro, A.: Relationship between local and global modulus of elasticity in bending and its consequence on structural timber grading. European Journal of Wood and Wood Products, 71(3): 297308, 2013. [14] Moore, J.R., Lyon, A.J., Searles, G.J., Lehneke, S.A., Ridley-Ellis, D.J.: Within-and between-stand variation in selected properties of Sitka spruce sawn
timber in the UK: implications for segregation and grade recovery. Annals of forest science, 70(4): 403415, 2013. [15] Holland C., Comparison of results for the current method of determining Modulus of Elasticity and the proposed “Global-E” method on Sitka spruce. Client report number 80323. Building Research Establishment, 2000. [16] EN13183-1:2002. Moisture content of a piece of sawn timber—Part 1:Determination by oven dry method. European Committee for Standardisaon. [17] R Core Team. 2016 R: A language and environment for statistical computing. R Foundation for Statistical Computing, Vienna, Austria.