September 23, 2007
14:26
WSPC - Proceedings Trim Size: 9.75in x 6.5in
ws-gi-975x65˙2e˙master
109
USING TRANSCRIPTION FACTOR BINDING SITE CO-OCCURRENCE TO PREDICT REGULATORY REGIONS HOLGER KLEIN
[email protected]
MARTIN VINGRON
[email protected]
Max Planck Institute for Molecular Genetics, Ihnestr. 63-73, D-14195 Berlin, Germany Transcription factors (TFs) bind to the regulatory regions of genes in a cooperative manner. This article describes a method to detect pairs of transcription factor binding sites which co-occur in known regulatory regions more often than expected by mere combination of the individual binding sites. We determine frequently co-occurring TF pairs and evaluate the method using known TF interactions. Furthermore we use co-occurrence scores to assess the regulatory potential of a sequence region by calculating a graph-based score. We show results for the score on known regulatory regions. Keywords: transcription factor binding sites; co-occurrence; transcription factor interactions; regulatory potential; promoter/enhancer prediction.
1. Introduction The regulation of transcription is controlled by transcription factors (TFs) binding to specific motifs in the DNA around and upstream of the transcriptional start site (TSS) of transcripts. These transcription factors form complexes with other TFs and cofactors which do not bind the DNA themselves. Hence the binding sites for transcription factors (TFBSs) taking part in these protein complexes usually occur in sterical proximity to each other. The TFBSs can be found organized in cis-regulatory modules or clusters. For metazoans such a cis-regulatory module typically consists of up to ten binding sites for at least three different sequence-specific transcription factors stretched over roughly 500bp [14]. These modules can function to direct complex spatial or temporal expression patterns. For some transcription factors potential interaction partners are well known. The type of interaction can be homotypic (e.g., GATA-1 with a second protein GATA-1 [6]), heterotypic (e.g., NFAT with AP-1 [4]), or mediated via co-factors. Usually a transcription factor can interact with several different other factors. The prediction of individual transcription factor binding sites (TFBSs) is errorprone. The search for putative hits is carried out using position weight matrices (PWMs), and the procedure entails plenty false positive hits, since typical binding
September 23, 2007
110
14:26
WSPC - Proceedings Trim Size: 9.75in x 6.5in
ws-gi-975x65˙2e˙master
H. Klein & M. Vingron
sites are short and sometimes degenerate. One remedy for this problem it the application of phylogenetic footprinting, where only TFBSs in evolutionary conserved regions are taken into account. For reviews on TFBS prediction see [2] and [21]. The motivation for this study is the assumption that the predicted binding sites of interacting factors co-localize more often than expected by chance despite the high error rate for the TFBS prediction. The idea is that the signal of co-occurrence patterns is large enough to identify interacting transcription factors and to improve the prediction of regulatory regions. There are different approaches to identify putative interaction transcription factors. Rateitschak et al. [19] annotate conserved regions from the CORG database [7] with predicted binding sites. A log-odds score is used to identify pairs of TFBSs which occur together in upstream regions of genes in a maximum distance. The numbers of expected pairs are computed using the marginals of the co-occurrence count matrix. Hannenhalli et al. [10] define a co-localization index based on permutation of TFBSs. A recent study applied the detection of co-occurring TFBSs to identify tissuespecific pairs of TFs [23] in human. Here the number of observed co-localizations in tissue-specific sets of genes is compared to the number observed genome-wide. Previous works on the identification of regulatory regions using clusters of predicted TFBSs are for example COMET, ClusterBuster [8, 9] or MSCAN [11], which use limited sets of motifs for the prediction of regulatory regions. For a review of various other promoter prediction tools see Bajic et al. [1]. We had two major goals for this study. First is the prediction of putative synergistic transcription factor pairs, based on the analysis of co-occurrence of their respective binding sites in known regulatory regions. The second goal is the calculation of a regulatory potential score for previously not characterized sequence regions. To achieve these objectives we annotate sets of upstream regions with TFBSs and slide a window over the sequences. We count the number of times each combination of TFBSs shows up in the data set. The expected number of pairs is calculated by recounting the number pairs on annotation sets whose TFBS labels have been permuted before. Using a log-odds score of observed counts over expected counts pairs of binding sites are identified which are present more often than expected. Furthermore we build a graph based on the previously introduced co-occurrence scores and TFBSs predicted in unknown sequence regions and subsequently calculate a matching score. Hence regions with pairs of TFBSs which are common in known regulatory regions achieve higher scores than other regions. This way we hope to add a method to the field of prediction of regulatory regions, which does not rely as much on the presence of CpG-islands as many of the other tools. This would improve the dection of CpG-less promoters and enhancers. This article is structured in the following way: first we describe how we prepare the
September 23, 2007
14:26
WSPC - Proceedings Trim Size: 9.75in x 6.5in
ws-gi-975x65˙2e˙master
Using Transcription Factor Binding Site Co-Occurence
111
sequence data and the transcription factor binding site predictions. In the Methods section the co-occurrence score and the matching score for the calculation of the regulatory potential of a sequence are introduced. In the Results section we show putative interacting transcription factors and test the performance of the score on known and yet unknown interactions. Moreover we present results for the regulatory potential on known regulatory regions. 2. Data 2.1. Sequence Data The regulatory sequence data set we use for the calculation of the co-occurrence scores was prepared as follows. We extracted the upstream regions of all known human genes in the EnsEMBL database (v. 34, based on NCBI 35) [12] in a region of -1500 bp 5’-upstream and +100 bp 3’-downstream relative to the most 5’ transcription start site annotated. Overlapping regions in the resulting sequences were merged and the regions which are conserved to the respective upstream regions of orthologous mouse genes were marekd. We masked repeats [20] and predicted the TFBSs on conserved regions. 2.2. Position Weight Matrices In the transcription factor binding site data sets which are available one can observe a certain degree of redundancy. It happens that different TFs have similar binding site specificity, moreover for some TFs multiple binding site descriptions of different quality are available. For that reason we chose a subset of TFBS descriptions for our work. We annotated the set of regulatory sequences with the non-redundant set of vertebrate position weight matrices from TRANSFAC. The TFs were grouped based on their similarity and biological relatedness. From each group the profile with the smallest number of false-positive hits was selected as representative. As of TRANSFAC version 10.3 this set consists of 151 out of 586 total vertebrate profiles [16]. We used the methods of Rahmann et al. [18] to annotate putative transcription factor binding sites. The scanning cutoff was chosen in such a way that the probability to get a false positive prediction in a sequence of length 500bp is at 5% (fixed type I error). We prepared the sequence sets and predicted transcription factor binding sites using the BioMinerva set of perl libraries [13]. 2.3. Known Interactions of Transcription Factors We built a reference set of PWM-combinations representing combinations of transcription factors known to interact. For the set of PWMs used we flagged all combinations belonging to factors known to interact in TRANSFAC. As of TRANSFAC 10.3 we find 176 pairs of PWMs.
September 23, 2007
112
14:26
WSPC - Proceedings Trim Size: 9.75in x 6.5in
ws-gi-975x65˙2e˙master
H. Klein & M. Vingron
3. Methods 3.1. Co-occurrence Score We define a co-occurrence score as the log-odds score of the observed over the expected number of annotated TFBS pairs in the set of known regulatory sequences. The number of TF pairs was counted using a sliding window over each sequence in the data set. The strand of the hit and the orientation of the TFBS pair was disregarded. Multiple occurrences of a specific combination of TFBSs in the same window were only counted once to reduce the influence of transcription factors that usually bind in homotypic clusters. Since binding motifs may resemble each other we only count non-overlapping hits. Furthermore we count the same pairs in overlapping windows only once. The co-occurrence score for a pair of PWMs i and j is then defined as the log-odds score of the observed cij,obs over the expected number of pairs cij,exp .
Sij := log
cij,obs cij,exp
This was acquired by a repeated permutation of the TFBS labels in the original data set followed by recounting the pairs of TFBSs. The expected number of pairs then equals the average number of pairs from all recounts after permutations. Pnperm cij,exp =
p=1
cij,p
nperm
The score gets high values for pairs that occur in the data set more often than expected by chance. It has a value of 0 if the observed counts equal the expected counts, and it gets a negative value for pairs which are less common than expected by chance. We used pseudocounts to avoid problems on data sets with small numbers of predicted TFBS. 3.2. Calculation of Regulatory Potential We calculated a score that reflects the regulatory potential of a given stretch of sequence by building a bipartite graph. As input data to build the graph the predicted transcription factor binding sites and a reference co-occurrence score matrix were used. The score assigned to the stretch of sequence is then the sum of edge weights for the maximum weighted bipartite matching (MBPM) of the respective graph.
September 23, 2007
14:26
WSPC - Proceedings Trim Size: 9.75in x 6.5in
ws-gi-975x65˙2e˙master
Using Transcription Factor Binding Site Co-Occurence
113
Each TFBS corresponds to a vertex in both partitions of the graph. Subsequently we connect the vertices from the two partitions by edges. Edge weights are set to the co-occurrence score for the given pair of TFBSs.
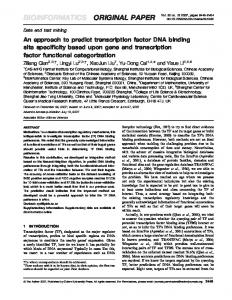
Fig. 1. A bipartite graph is built out of the predicted TFBSs and the co-occurrence scores. Subsequently a maximum weighted bipartite matching is carried out. The score for the respective sequence window is the sum of edge weights of the maximum weighted bipartite matching.
The usage of a bipartite graph permits to take into account the two most important interactions for each factor as represented by the co-occurrence score. The maximum weighted bipartite matching on the graph allows for one edge connecting to a vertex in the opposite partition for each vertex. The sum of edge weights in the maximum weighted bipartite matching is maximal. There is no other combination of edges possible whose sum of edge weights is higher [5]. We define the aforementioned sum as the regulatory potential of the given stretch of sequence.
4. Results and Discussion 4.1. Co-occurrence of Predicted TFBSs In the results shown here we use a sliding window size of 100bp. This choice is justified by experimental data from the database TRANSCompel (v. 10.3) [16]: Of 375 known composite elements from vertebrates 98.16% have a distance between the experimentally determined transcription factor binding sites < 100bp (see Fig. 2). Moreover we tested the influence of the window size on the dissimilarity of the score distributions for combinations of TFs known and not known to interact on another vertebrate sequence set with a smaller set of PWMs. The results suggest that the dissimilarity of the two distributions was largest for the window size of 100bp (data not shown). In Fig. 3 we show the cumulative histogram for the scores for pairs known to interact in TRANSFAC and for pairs not known to interact. The distributions of scores overlap, but the scores related to known interactions are shifted to larger values compared to the scores for the unknown interactions. The p-value for a comparison
September 23, 2007
114
14:26
WSPC - Proceedings Trim Size: 9.75in x 6.5in
ws-gi-975x65˙2e˙master
H. Klein & M. Vingron
Fig. 2. Distance distribution of transcription factor binding sites from composite elements from TRANSCompel 10.3.
Fig. 3. Cumulative histogram for scores of known TF pairs (red) and TF pairs not known to interact (blue).
of the two score distributions using a Wilcoxon two sample test is 4.34 × 10⁻⁴ . Table 1 shows the twenty top scoring pairs of PWMs. Whereas only four are annotated as interacting in TRANSFAC, on manual inspection interaction information for three other pairs can be found in the literature and in TRANSFAC itself. For the factor Stra13 (PWM: V$STRA13 01) the formation of homodimers is mentioned in TRANSFAC full text, but an interaction entry is missing. The same is true for CDP. In protein-protein interaction databases like UniHI [3] additional hints for direct and indirect interactions can be found. Despite the precautions taken we observe a tendency for transcription factor binding sites to occur in homotypic clusters. Nine of the twenty top scoring pairs are combinations of two different factors. A comparison of the score distributions of homotypic and heterotypic pairs reveals a shift to higher values for the homotypic combinations. For simulations carried out on randomized TFBS data the score distributions were identical (data not shown). The observed bias that hits of individual motifs to cluster in the proximity of each other is in agreement with other studies e.g. in Drosophila [15] and human [24].
September 23, 2007
14:26
WSPC - Proceedings Trim Size: 9.75in x 6.5in
ws-gi-975x65˙2e˙master
Using Transcription Factor Binding Site Co-Occurence Table 1.
115
Top scoring PWM pairs.
PWM 1
PWM 2
Score
V$CHX10 01 V$STRA13 01 V$POU3F2 02 V$CAAT 01 V$CDC5 01 V$TEF Q6 V$IPF1 Q4 V$NFY C V$CART1 01 V$CDP 01 V$STRA13 01 V$CAAT 01 V$LHX3 01 V$CDC5 01 V$CDP 01 V$CDP 01 V$CDP 01 V$HP1SITEFACTOR Q6 V$USF 01 V$HMGIY Q3
V$CHX10 01 V$STRA13 01 V$POU3F2 02 V$CAAT 01 V$POU3F2 02 V$TEF Q6 V$S8 01 V$NFY C V$CART1 01 V$CDP 01 V$USF 01 V$NFY C V$LHX3 01 V$TEF Q6 V$HNF6 Q6 V$LHX3 01 V$E4BP4 01 V$HP1SITEFACTOR Q6 V$USF 01 V$HNF6 Q6
1.93 1.9 1.9 1.89 1.88 1.84 1.75 1.75 1.75 1.73 1.73 1.72 1.68 1.67 1.66 1.63 1.62 1.61 1.61 1.61
Note: Known interactions in bold type.
Clearly not all interacting pairs of transcription factors obtain a high score for their respective PWMs. One reason might be a too stringent cutoff while scanning for the individual binding sites, so that some functional TFBSs are missed. Looking at a few examples it seems that the known interactions, whose TFBS combinations seem to be underrepresented have at least one partner with many known interactions. It is imaginable that the interaction in question is a specific one while at least one partner is involved in many other interactions. Examples for PWM combinations with a described interaction and co-occurrence scores < 0 are V$P53 01 (P53, seven known interactions in TRANSFAC) and V$YY1 02 (YY1, 13 known interactions), or V$DR4 Q2 (bound by a plethora of hormone receptors, e.g., RAR, which on its own already has more than 14 interaction entries in TRANSFAC) and V$MEF2 01 (MEF-2, three known interactions). 4.2. Regulatory Potential on Known Regulatory Regions 4.2.1. Pax6 To test the regulatory potential score described in section 3.2 we annotate known regulatory regions. The size of the sliding window for which the scores of the examples in this section are calculated is 200bp. Our first example are the well understood regulatory regions of Pax6. The region around the Pax6 locus in Mus musculus on chromosome 2 is annotated with the
September 23, 2007
116
14:26
WSPC - Proceedings Trim Size: 9.75in x 6.5in
ws-gi-975x65˙2e˙master
H. Klein & M. Vingron
MBPM score (Fig. 4). Furthermore the areas which are known to have a regulatory function [17] are marked. In all known regulatory regions but the ones upstream of exon 1 the MBPM score shows peaks that are higher than scores from the surrounding region. Some peaks are located in regions not known to influence the regulation of Pax6, examples are the one between exons 8 and 9 and the one directly upstream of exon 12. It remains to be seen if these regions fulfill a regulatory function.
Fig. 4. Pax6 regulatory regions and regulatory potential score. The exons of murine Pax6 are marked in blue. The known enhancers and promoter regions of Pax6 are marked in yellow [17].
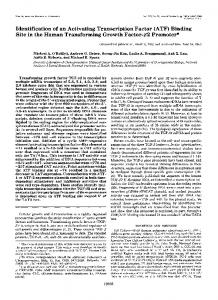
4.2.2. VISTA Enhancer Data Set We annotate the VISTA enhancer data set [22] with the MBPM score. Visel et al. generated this set using comparative genomics followed by experimental verification of the predictions. The experimentally verified enhancer regions are extended by 5000 bp upstream and downstream and the complete region was annotated with the described MBPM score. In the example from Fig. 5 we plot the score around the experimentally verified enhancer element 174. The enhancer region itself is marked in yellow. This enhancer, located on chromosome 1, has been shown to be specific for forebrain and partly for limb in vivo. The genes surrounding this enhancer are LMO4 and PKN2.
Fig. 5. Enhancer element 174 from the VISTA enhancer data set annotated with the MBPM score. The enhancer element is marked in yellow.
We take the whole set of enhancers that were tested positive for enhancer activity in
September 23, 2007
14:26
WSPC - Proceedings Trim Size: 9.75in x 6.5in
ws-gi-975x65˙2e˙master
Using Transcription Factor Binding Site Co-Occurence
117
vivo, extend it in a similar way to the procedure described for the example above and annotate it with the MBPM score. For roughly 21% of the enhancers in the set the highest score for the complete region is achieved within the known enhancer region, while the fraction of sequence covered by the known enhancers is ca. 12%. During the extension of the known enhancer regions we did not check for the presence of promoters or other enhancers, which could explain high MBPM scores even outside the annotated regions from the VISTA data set. 4.3. Discussion We have shown a method to identify co-occurring pairs of predicted transcription factor binding sites based on a log-odds score for observed pair counts of PWM hits over expected pair counts of PWM hits. The score distribution for PWM pairs belonging to transcription factors which are known to interact is shifted to higher values compared to the distribution of scores for pairs not known to interact yet. The two score distributions overlap largely though, which makes it hard to define a threshold above which one can assume two transcription factors to interact. In accordance with other studies we find a bias towards higher scores for homotypic pairs of transcription factor binding sites. Moreover we have described a method to assess the regulatory potential using the described co-occurrence score and TFBS predictions in uncharacterized sequence regions. We can identify known regulatory regions, while a systematic examination of the influence of different parameters (reference score matrix, threshold for the TFBS prediction, performance on different data sets) is still in progress. Also several other ways for the calculation of a graph-based score describing the regulatory potential of a window of unknown sequence are researched.
Acknowledgments We would like to thank Szymon M. KieÃlbasa for discussions and providing the BioMinerva library and Utz J. Pape, Hugues Richard and Hannes Luz for discussions and comments. HK is supported by the International Research Training Group for Genomics and Systems Biology of Molecular Networks. References [1] Bajic,V.B., Tan,S.L., Suzuki,Y., and Sugano,S., Promoter prediction analysis on the whole human genome, Nat. Biotechnol, 22(11):1467–1473, 2004. [2] Bulyk,M.L., Computational prediction of transcription-factor binding site locations, Genome Biol., 5(1):201, 2003. [3] Chaurasia, G., Iqbal, Y., Hanig, C., Herzel, H., Wanker, E.E., and Futschik, M.E., UniHI: an entry gate to the human protein interactome, Nucleic Acids Res., 35(Database issue):D590–594, 2007. [4] Chen, L., Glover, J.N., Hogan, P.G., Rao, A., and Harrison, S.C., Structure of the
September 23, 2007
118
[5] [6]
[7]
[8] [9]
[10] [11]
[12] [13] [14] [15] [16] [17] [18]
[19] [20] [21] [22]
[23]
[24]
14:26
WSPC - Proceedings Trim Size: 9.75in x 6.5in
ws-gi-975x65˙2e˙master
H. Klein & M. Vingron
DNA-binding domains from NFAT, Fos and Jun bound specifically to DNA, Nature, 392(6671):42–8, 1998. Cormen, T.H., Leiserson, C.E., Rivest, R., and Stein, C., Introduction to Algorithms, Second Edition, MIT Press, 2001. Crossley, M., Merika, M., and Orkin, S.H., Self-association of the erythroid transcription factor GATA-1 mediated by its zinc finger domains, Mol. Cell Biol., 15(5):2448– 2456, 1995. Dieterich, C., Grossmann, S., Tanzer, A., Ropcke, S., Arndt, P., Stadler, P., and Vingron M., Comparative promoter region analysis powered by CORG, BMC Genomics, 6(1):24, 2005. Frith, M.C., Li, M.C., and Weng, Z., Cluster-Buster: Finding dense clusters of motifs in DNA sequences, Nucleic Acids Res., 31(13):3666–3668, 2003. Frith, M.C., Spouge, J.L., Hansen, U., and Weng, Z., Statistical significance of clusters of motifs represented by position specific scoring matrices in nucleotide sequences, Nucleic Acids Res., 30(14):3214–3224, 2002. Hannenhalli, S. and Levy, S., Predicting transcription factor synergism, Nucleic Acids Res., 30(19):4278–84, 2002. Johansson, O., Alkema, W., Wasserman, W.W., and Lagergren, J., Identification of functional clusters of transcription factor binding motifs in genome sequences: the MSCAN algorithm, Bioinformatics, 19(1):i169–176, 2003. Hubbard, T.J.P., et al., Ensembl 2007, Nucleic Acids Res., 35(Database issue):D610– 617, 2007. Kielbasa, S., The biominerva framework (in preparation), 2007. Levine, M. and Tjian, R., Transcription regulation and animal diversity, Nature, 424(6945):147–151, 2003. Lifanov, A.P., Makeev, V.J., Nazina, A.G., and Papatsenko, D.A., Homotypic regulatory clusters in Drosophila, Genome Res., 13(4):579–588, 2003. Matys, V., et al., TRANSFAC and its module TRANSCompel: transcriptional gene regulation in eukaryotes, Nucleic Acids Res., 34(Database issue):D108–110, 2006. Morgan R., Conservation of sequence and function in the Pax6 regulatory elements, Trends Genet., 20(7):283–287, 2004. Rahmann, S., Muller, T., and Vingron, M., On the power of profiles for transcription factor binding site detection, Statistical Applications in Genetics and Molecular Biology, 2(1):7, 2003. Rateitschak, K., Muller, T., and Vingron, M., Annotating significant pairs of transcription factor binding sites in regulatory DNA, In Silico Biol., 4(4):479–487, 2004. Smit, A.F.A., Hubley, R., and Green, P., Repeatmasker open-3.0, http://www. repeatmasker.org, 1996-2004. Stormo, G.D., DNA binding sites: representation and discovery, Bioinformatics, 16(1):16–23, 2000. Visel, A., Minovitsky, S., Dubchak, I., and Pennacchio, L.A., Axel Visel, Simon Minovitsky, Inna Dubchak, and Len A Pennacchio. VISTA Enhancer Browser– a database of tissue-specific human enhancers, Nucleic Acids Res., 35(Database issue):D88–92, 2007. Yu, X., Lin, J., Zack, D.J., and Qian, J., Computational analysis of tissue-specific combinatorial gene regulation: predicting interaction between transcription factors in human tissues, Nucleic Acids Res., 34(17):4925–4936, 2006. Zhu, Z., Shendure, J., and Church, G.M., Discovering functional transcription-factor combinations in the human cell cycle, Genome Res., 15(6):848–855, 2005.