International Journal of Remote Sensing
ISSN: 0143-1161 (Print) 1366-5901 (Online) Journal homepage: http://www.tandfonline.com/loi/tres20
Using Twitter for tasking remote-sensing data collection and damage assessment: 2013 Boulder flood case study Guido Cervone, Elena Sava, Qunying Huang, Emily Schnebele, Jeff Harrison & Nigel Waters To cite this article: Guido Cervone, Elena Sava, Qunying Huang, Emily Schnebele, Jeff Harrison & Nigel Waters (2016) Using Twitter for tasking remote-sensing data collection and damage assessment: 2013 Boulder flood case study, International Journal of Remote Sensing, 37:1, 100-124, DOI: 10.1080/01431161.2015.1117684 To link to this article: http://dx.doi.org/10.1080/01431161.2015.1117684
Published online: 13 Dec 2015.
Submit your article to this journal
View related articles
View Crossmark data
Full Terms & Conditions of access and use can be found at http://www.tandfonline.com/action/journalInformation?journalCode=tres20 Download by: [68.177.129.57]
Date: 14 December 2015, At: 09:10
INTERNATIONAL JOURNAL OF REMOTE SENSING, 2015 VOL. 37, NO. 1, 100–124 http://dx.doi.org/10.1080/01431161.2015.1117684
Using Twitter for tasking remote-sensing data collection and damage assessment: 2013 Boulder flood case study Guido Cervonea, Elena Savaa, Qunying Huangb, Emily Schnebelea, Jeff Harrisonc and Nigel Watersa GeoInformatics and Earth Observation Laboratory, Department of Geography and Institute for CyberScience, The Pennsylvania State University, University Park, PA, USA; bDepartment of Geography, University of Wisconsin, Madison, WI, USA; cThe Carbon Project, Arlington, VA, USA
Downloaded by [68.177.129.57] at 09:10 14 December 2015
a
ABSTRACT
ARTICLE HISTORY
A new methodology is introduced that leverages data harvested from social media for tasking the collection of remote-sensing imagery during disasters or emergencies. The images are then fused with multiple sources of contributed data for the damage assessment of transportation infrastructure. The capability is valuable in situations where environmental hazards such as hurricanes or severe weather affect very large areas. During these types of disasters it is paramount to ‘cue’ the collection of remote-sensing images to assess the impact of fast-moving and potentially life-threatening events. The methodology consists of two steps. First, real-time data from Twitter are monitored to prioritize the collection of remote-sensing images for evolving disasters. Commercial satellites are then tasked to collect high-resolution images of these areas. Second, a damage assessment of transportation infrastructure is carried out by fusing the tasked images with contributed data harvested from social media such as Flickr and Twitter, and any additional available data. To demonstrate its feasibility, the proposed methodology is applied and tested on the 2013 Colorado floods with a special emphasis in Boulder County and the cities of Boulder and Longmont.
Received 26 May 2015 Accepted 28 October 2015
1. Introduction Environmental hazards pose a significant threat to the development and sustainment of our society. Rapid population growth, the emergence of megacities, and high-risk facilities such as high dams and nuclear power plants have increased the risk posed by natural hazards at unprecedented levels (Tate and Frazier 2013). A single catastrophic event can claim thousands of lives, cause billions of dollars of damage, trigger a global economic depression, destroy natural landmarks, render a large territory uninhabitable, and destabilize the military and political balance in a region (Keilis-Borok 2002).
CONTACT Guido Cervone © 2015 Taylor & Francis
[email protected]
INTERNATIONAL JOURNAL OF REMOTE SENSING
101
Downloaded by [68.177.129.57] at 09:10 14 December 2015
1.1. Remote sensing Remote-sensing data are paramount during disasters and have become the de facto standard for providing high-resolution imagery for damage assessment and the coordination of disaster relief operations (Cutter 2003; Joyce et al. 2009). Organizations such as the International Charter for Space and Disasters (http://www.disasterscharter.org/) provide high-resolution images from commercial and research air- and space-borne instruments within hours of major events, frequently including ‘before’ and ‘after’ scenes of the affected areas (Stryker and Jones 2009; Duda and Jones 2011; Cervone and Manca 2011). These ‘before’ and ‘after’ images are quickly disseminated through official government portals and news channels to inform the public of the magnitude of the event, and often serve to sensibilize citizens about the unfolding tragedies. In addition, first responders rely heavily on remotely sensed images to coordinate relief and response efforts as well as to prioritize resource allocations (Cutter 2003). Determining the location and severity of damage to transportation infrastructure is particularly critical for establishing evacuation and supply routes as well as repair and maintenance agendas (Oxendine, Sonwalkar, and Waters 2012). Following the Colorado floods of September 2013, over 1000 bridges required inspection and approximately 200 miles of highway and 50 bridges were destroyed. The assessment of transportation infrastructure over such a large area could have been accelerated through the use of high-resolution imagery and geospatial analysis (Uddin 2011). Despite the wide availability of large remote-sensing data sets from numerous sensors, specific data might not be collected in the time and space most urgently required. Geo-temporal gaps result due to satellite revisit time limitations, atmospheric opacity, or other obstructions. Tasking instruments on board satellites and other aerial platforms for data collection is thus crucial for the timely delivery of data for damage assessment and disaster relief. However, satellite tasking is usually limited by orbital restrictions and the locations of data-receiving stations. It is usually predefined and based on the statistical likeliness that data for an area are needed. A small number of satellite instruments can be oriented to collect data at an oblique angle with respect to the satellite path. For this class of instruments, a correct tasking can greatly increase the data coverage during emergencies. Furthermore, aerial platforms, especially Unmanned Aerial Vehicles (UAVs), can be quickly deployed to collect data over specific regions. UAVs are capable of providing high-resolution, near-real-time images often with less expense than manned aerial- or space-borne platforms. Their quick response time, high manoeuvrability, and resolution make them important tools for disaster assessment (Tatham 2009). Tasking data collection for specific regions affected by a hazard is particularly difficult during major events. For extremely large events such as Hurricane Sandy in 2012 or the Colorado floods of 2013, rapid and systematic evaluations were difficult because the area affected was so extensive. This difficulty is further enhanced when events quickly unfold and are mitigated by local infrastructure and relief efforts. Therefore, it is apparent that during emergencies the tasking of data collection from remote-sensing platforms must be constantly assessed and refined based on the needs of emergency responders and the constraints dictated by the number and type of instruments available. This assessment has historically been based on official
102
G. CERVONE ET AL.
measurements and established plans, and does not account for the availability of realtime, on-the-ground data freely contributed by citizens.
Downloaded by [68.177.129.57] at 09:10 14 December 2015
1.2. Social media and volunteered geographical information Novel information streams, such as social media-contributed videos, photographs, and text as well as other open sources, are redefining situation awareness during emergencies. When these contributed data contain spatial and temporal information, they can provide valuable Volunteered Geographical Information (VGI), harnessing the power of ‘citizens as sensors’ to provide a multitude of on-the-ground data, often in real time (Goodchild 2007). There are several opportunities and challenges associated with the use of VGI. Elwood (2008); Elwood, Goodchild, and Sui (2012) examine the content and characteristics of VGI, the technical and social processes through which it is produced, appropriate methods for synthesizing and the use of these data in research, and emerging social and political concerns related to this new form of information. Although these volunteered data are often published without scientific intent, and usually carry little scientific merit, it is still possible to mine mission critical information (Huang and Xiao 2015). For example, during hurricane Katrina, geolocated pictures and videos searchable through Google provided early emergency responders with groundview information. These data have been used during major events, with the capture, in near-real-time, of the evolution and impact of major hazards (De Longueville, Smith, and Luraschi 2009; Pultar et al. 2009; Heverin and Zach 2010; Vieweg et al. 2010; Acar and Muraki 2011; Verma et al. 2011; Earle, Bowden, and Guy 2012; Tyshchuk et al. 2012). Specifically, VGI based on Twitter and other non-authoritative data have been shown to contain valuable data that can be used for improving flood estimation in near-real-time (Poser and Dransch 2010; McDougall and Temple-Watts 2012; Triglav-Čekada and Radovan 2013; Schnebele and Cervone 2013; Schnebele et al. 2014a, 2014b). Volunteered data can be employed to provide timely damage assessment, help in rescue and relief operations, as well as for the optimization of engineering reconnaissance (Laituri and Kodrich 2008; Dashti et al. 2014). While the quantity and real-time availability of VGI make it a valuable resource for disaster management applications, data volume, as well as its unstructured, heterogeneous nature, makes the effective use of VGI challenging. Volunteered data can be diverse, complex, and overwhelming in volume, velocity, and in the variety of viewpoints they offer (Huang and Xu 2014). Negotiating these overwhelming streams is beyond the capacity of human analysts. Current research offers some novel capabilities to utilize these streams in new, groundbreaking ways, leveraging, fusing, and filtering this new generation of air-, space-, and ground-based sensor-generated data (Oxendine et al. 2014). This research presents a novel approach to prioritizing the collection of remotesensing data from satellites, airplanes, and UAVs during hazard events by utilizing VGI as a filtering tool. In addition, it proposes the use of VGI for disaster assessment to fill in the gaps when remote-sensing data are lacking or incomplete. In order to use social media efficiently and effectively and VGI to ‘cue’ or augment satellite observations, it is necessary to filter the data for content and to geolocate them using a variety of textmining and network analysis algorithms. Filtering yields a rapid and direct identification
INTERNATIONAL JOURNAL OF REMOTE SENSING
103
of affected areas, which can aid authorities to prioritize site visits and response initiatives as well as to task additional data collection.
Downloaded by [68.177.129.57] at 09:10 14 December 2015
1.3. 2013 Boulder CO floods We present an application of this new methodology to the 2013 floods that occurred around the City of Boulder, CO. The September 2013 flooding in Colorado was the worst hydrological disaster in the state’s history. The severity of the event was the result of extreme precipitation, pre-existing drought, and recent wildfires that hardened the ground and reduced the vegetation layer. With precipitation exceeding 50 cm in parts of Boulder County, the area experienced catastrophic flooding, property destruction totalling over $2 billion in damage, the evacuation of over 180,000 people, and a tragic loss of eight lives. Damage to transportation infrastructure was especially severe and affected large areas of the state. Boulder is located near the foothills of the Rocky Mountains approximately 50 km northwest from Denver. This unique location has made Boulder the number one flash flood community in the state of Colorado as major flash floods have developed in the past and still continue to occur (Elaine 2014). Development in Boulder started in 1910 when prominent planner Frederick Law Olmstead Jr. recommended Boulder Creek be lined with a park and preserved as open space to limit structural damage in case of a flood (Crumpacker 1985). More recently the city’s rapidly growing population raised concerns about the loss of open space. In the last 15 years alone, Boulder has spent more than $45 million dollars on sustainable projects based on the blueprint of the community (Elaine 2014). However, the 2013 flood was not the large flash flood officials had been planning for. It was an unprecedented event where Colorado received the amount of its average annual precipitation in only eight days. The 2013 Colorado flood propagated quickly and with little warning. From 11 to 15 September, a catastrophic storm system formed over the Rocky Mountain Front Range impacting 18 counties and resulting in severe flooding in many parts of Colorado. Record-breaking precipitation occurred along the Colorado Front Range from Larimer and Weld Counties southward to El Paso County. Boulder County was the worst hit with 25 cm of rain on 12 September 2013 and over 43 cm by 15 September 2013. The effects of the storm were not only felt in-state, but flooding and heavy precipitation also extended into several neighbouring states such as Nebraska, New Mexico, and Wyoming (Gochis et al. 2014).
1.4. Objectives The present article describes a methodology and its implementation to achieve two main objectives. (1) Using Twitter data to task the collection of remote-sensing data during emergencies. A program called CarbonScanner is described to automatically scan Twitter data, and to identify hotspots and keywords for an unfolding emergency. While the current research focuses on commercial high-resolution satellite platforms, it
104
G. CERVONE ET AL.
can also be applied for the collection of aerial images using manned or unmanned platforms. (2) Fusing the tasked remote-sensing images with additional contributed data, including tweets and VGI, for damage assessment. The current research specifically discusses the assessment of transportation infrastructure; however, it can be extended to other situations.
2. Data
Downloaded by [68.177.129.57] at 09:10 14 December 2015
Multiple sources of contributed, remote-sensing, and open source geospatial data were collected and used during this research. A summary of the sources and collection dates of the contributed and remote-sensing data are available in Table 1.
2.1. Twitter Twitter is one of the largest social networking sites, and it is widely used to share information through micro-blogging (Waters 2014). These micro-blogs, or ‘tweets’, are limited to 140 characters, so abbreviations and colloquial phrasing are common, making the automation of filtering by content challenging. Twitter is very popular during emergencies and disasters, and it is being used by both official government agencies and the public to disseminate information. Central to the operation of Twitter is the use of hashtags, words or unspaced phrases prefixed with the sign #. They are identifiers unique to Twitter and are frequently used to search and filter information. The creation and use of a hashtag can be established by any user who wants to create a concept category to share specific information about a subject. For example, during the 2013 Boulder floods, the hashtag #boulderflood was used by users and agencies to share information about this particular event. Twitter data can be queried for specific hashtags or text present in the tweets, and for spatial and temporal constraints. There are several web-based tools and an API for the automatic querying, filtering, and displaying of tweets. For this study, tweets are harvested using the CarbonScanner application to identify ‘hotspots’ and task satellite data collection. CarbonScanner scans tweets, identifies relevant keywords and hashtags, and georectifies the data (see Sections 3.1.2 and 3.1.1). Table 1. Quantity of data collected for each source from 11 September 2013 to 21 September 2013. The ‘many’ for the Falcon UAV indicates that a stream of images was collected. September Data Source Ground Tweets Flickr Photographs Aerial Images CAP Falcon UAV Satellite Images WorldView2 Landsat 8
11
12
13
14
15
16
17
18
191 2
22432 313
57840 37
20923 334
22295 20
13419 517
7878 8
3401
many
many
1595 many
33
1572
894
67
654
2
5 1
3
19
104
20
21
788
INTERNATIONAL JOURNAL OF REMOTE SENSING
105
The specific geographical locations, hashtags, and keywords identified by CarbonScanner are used to collect additional Twitter data using applications developed at The Pennsylvania State and the University of Wisconsin at Madison. Specifically, for the current research the following three criteria were used: ● Tweets extending from 105°4ʹ53ʹʹ – 105°17ʹ50ʺ W and 40°5ʹ58ʹʹ – 39°57ʹ12ʺ N and
containing the hashtag ‘#boulderflood’ from 12 to 16 September 2013; ● Tweets extending from 105°01ʹ56ʹʹ – 105°25ʹ49ʺ W and 40°5ʹ58ʹʹ – 39°56ʹ01ʺ N and
containing all hashtags from 11 to 17 September 2013; and ● Tweets extending from 12 to 16 September 2013 and containing the hashtag
‘#boulderflood’.
Downloaded by [68.177.129.57] at 09:10 14 December 2015
About 150,000 tweets have been analysed in the current research (see Table 1).
2.2. Ground photographs Ground photographs contributed both by official sources and by ordinary citizens were collected to document the flooding in the Boulder area. For this study, a total of 1232 images relative to the period from 11 to 17 September 2013 were harvested using Flickr, a popular image-sharing portal (http://www.flickr.com). Flickr provides an API to query for spatial and temporal extents, making it possible to fully automate the analysis. Only geotagged Flickr photographs were used.
2.3. WorldView2 Ten, full-resolution GeoTIFF WorldView2 multispectral images collected by Digital Globe on 13 September 2013 (two images), 14 September 2013 (five images), and 17 September 2013 (three images) provide high-resolution data of Boulder and the surrounding counties. The WorldView2 data used were tasked using the CarbonScanner application developed for this research. WorldView2 is a commercial Earth observation satellite owned and operated by DigitalGlobe that was launched into orbit on 8 October 2009. It provides commercially available panchromatic images of 0.46 m resolution, and eight-band multispectral images with 1.84 m resolution. The eight multispectral bands at a 1.84 m resolution cover the following part of the electromagnetic (EM) spectrum: coastal (0.400–0.450 µm), blue (0.450–0.510 µm), green (0.510–0.580 µm), yellow (0.585–0.625 µm), red (0.630–0.690 µm), red edge (0.705– 0.745 µm), near-IR 1 (0.770–0.895 µm), and near-IR 2 (0.860–0.900 µm).
2.4. Landsat 8 Two resolution multispectral Landsat 8 OLI/TIRS images collected on 12 May 2013 and on 17 September 2013 provide data of the Boulder County area before and after the flooding, respectively. The data were downloaded from the United States Geological Survey (USGS) Hazards Data Distribution System (HDDS).
106
G. CERVONE ET AL.
Landsat 8 consists of nine spectral bands with a resolution of 30 m: Band 1 (coastal aerosol, useful for coastal and aerosol studies, 0.430–0.450 µm); Bands 2–4 (optical, 0.450–0.510, 0.530–0.590, 0.64–0.67 µm), Band 5 (near-IR, 0.850–0.880 µm), Bands 6 and 7 (shortwave-IR, 1.570–1.650, 2.110–2.290 µm), and Band 9 (cirrus, useful for cirrus cloud detection, 1.36–1.38 µm). In addition, a 15 m panchromatic band (Band 8, 0.500– 0.680 µm) and two 100 m thermal IR (Bands 10 and 11, 10.600–11.190, 11.500– 12.510 µm) were also collected from Landsat 8 OLI/TIRS.
Downloaded by [68.177.129.57] at 09:10 14 December 2015
2.5. Civil Air Patrol Satellite remote-sensing data may be insufficient as a function of spatial resolution, revisit time, or may be obstructed due to clouds or vegetation. Therefore, data from other sources can be used to provide supplemental information. The Civil Air Patrol (CAP) is a congressionally funded, non-profit corporation that functions as an auxiliary to the United States Air Force. The CAP conducts a variety of missions in support of federal, state, local, and non-governmental entities, including search and rescue, disaster relief support, and aerial reconnaissance for homeland security. CAP images were captured from 14 to 17 September 2013 in the areas surrounding Boulder (105°32′11ʹ – 104°59′33ʹ W and 40°15ʹ37ʹ – 39°56ʹ10ʹ N) and provide a third source of remote-sensing data. The georeferenced CAP red-green-blue (RGB) composite images were downloaded from the USGS HDDS.
2.6. Falcon UAV Falcon UAV images were collected over the cities of Lyons and Longmont from 12 to 14 September 2013. Falcon UAV collected valuable RGB composite images while other aircraft were grounded due to weather conditions (http://www.falconunmanned.com/). The mosaicked, georeferenced images were downloaded as a .kmz file from the Falcon Unmanned website.
2.7. Open source geospatial data Shapefiles defining the extent of the City of Boulder and Boulder County were downloaded from the City of Boulder (https://bouldercolorado.gov) and the Colorado Department of Local Affairs (http://www.colorado.gov) websites, respectively. In addition, a 2012 TIGER/line® shapefile of road networks for Boulder County was downloaded from the United States Census Bureau (http://www.census.gov).
3. Methodology The proposed methodology is based on two separate tasks: (1) Remote-sensing data collection (2) Damage assessment
INTERNATIONAL JOURNAL OF REMOTE SENSING
107
Downloaded by [68.177.129.57] at 09:10 14 December 2015
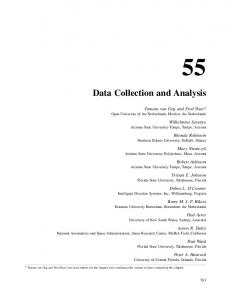
Figure 1. Flow chart of the proposed methodology.
Figure 1 shows the flow chart of the proposed methodology, indicating three main phases. The first phase consists of a series of methods to ingest and process Twitter data to identify regions of interest and to task remote-sensing data collection. Data are also added to characterize the transportation infrastructure network (e.g. roads, tunnels, bridges). Additional VGI data such as photographs and aerial images are also downloaded. In the second phase, Twitter data are fused with the tasked remote-sensing data, and the additional VGI to estimate the damage. In the final and third phase the data are made freely accessible through web services.
3.1. Remote-sensing data collection The first task consists of the analysis of Twitter data to identify the location of natural hazards, or ‘hot spots’, and the tasking of remote-sensing data collection for these areas.
3.1.1. Geolocation of tweets The proposed methodology is heavily dependent on the availability of geolocated data. Only between 1% and 2% of all tweets contain geolocation information. Because of the huge volume of Twitter data, usually even such a small percentage can be used to extract meaningful spatial patterns. However, during emergencies it is paramount to maximize the amount of spatial information, and therefore it is necessary to find alternative methodologies for geolocating tweets. For each tweet entry that does not contain geolocation information collected by the CarbonScanner application, all non-words are removed (punctuation, special characters, URLs, emoticons, and white space). The remaining text is then tokenized into uni-, bi-, and tri-grams, which correspond to one, two, and three consecutive words after stop words (e.g. a, an, and are). All of the stop words are removed. Each n-gram is queried against a gazetteer database. A gazetteer is a geographic index or dictionary to help identify the geographic location associated with a place name. In general, gazetteer entries consist of place names, locations, and other descriptive information. For this work, a database was created using data from the USGS and from GeoNames (http:// www.geonames.org/), and containing approximately 2.1 million entries. If a match is
108
G. CERVONE ET AL.
Downloaded by [68.177.129.57] at 09:10 14 December 2015
returned for a place name query, the associated geometry is used to derive the location of the tweet where it was sent from. If the location of a place is represented as a polyline or polygon feature, its centroid is used to georeference the tweet. The CarbonScanner constantly processes Twitter streams and matches the tweet content to the gazetteer database in real time. This same methodology is employed to geolocate the tweets used for damage assessment (Section 3.2). As a result, an additional 8% of tweets were given location information, increasing the percentage of geolocated tweets used in this research from the original 2% (circa 3000 tweets) to 10% (circa 15,000 tweets).
3.1.2. Identification of hot spots The CarbonScanner scanning application was developed to access and harvest social media data by browsing Twitter in real time. This application ‘scans’ the United States each hour to assess and generate alerts by clustering in space and time tweets whose text contains specific keywords for natural hazards (e.g. floods, tornadoes). These alerts or ‘hot spots’ are areas where natural hazards may be potentially occurring. The application system is highly flexible with filter settings managed by a portal service enabling manager-level users to quickly adjust keyword and other settings as events develop. A potential event is detected when a significant amount of activity (in space and time) is identified in a region. In this work, the threshold for significant activity is set to 10 tweets within a 100 km2 area. A 100 km2 extent was selected because it is sufficient to capture significant transportation infrastructure in many urban areas as well as being the minimum ordering area for DigitalGlobe orthorectified images. The threshold settings can be adjusted to user requirements or preferences. When the threshold is reached, an alert box is generated, cueing the collection of images for that region. The request for data collection is automatically issued to DigitalGlobe, which is satisfied pending the constraints of the satellites and their orbits. Figure 2(a) shows the CarbonScanner application during the 2013 Boulder floods identifying several tweets that clustered in space and time, and which caused an alert to be generated. The alert boxes generated are shown in Figure 2(b). An additional task performed by CarbonScanner is the identification of most common hashtags among the tweets that are used to generate an alert. These hashtags are used to query additional Twitter data for damage assessment. Once the data are acquired, they are made available as open data services. The imagery is deployed in near-real-time using OpenImageMap (http://www.cubewerx. com/solutions/openimagemap/) services as well as other open mapping services including Open Geospatial Consortium Web Map Service (OGC WMS), Web Map Tile Services (WMTS), Web Coverage Services (WCS), Google Maps API, Google Earth KML overlays, and Open Source Geospatial Foundation Tile Map Service (OSGeo TMS). Providing the images in an open source format ensures rapid deployment as well as open access to the data. System settings are adjustable and managed by a portal service enabling manager-level users to quickly add images, manage services, and access controls. Images may also be accessed by the WMS standard and combined with National Spatial Data Infrastructure (NSDI) framework data in any GIS supporting this popular standard.
INTERNATIONAL JOURNAL OF REMOTE SENSING
(a)
109
(b)
Downloaded by [68.177.129.57] at 09:10 14 December 2015
Figure 2. Screenshot of CarbonScanner during the 2013 Boulder floods showing filtered and geolocated tweets captured by scanning application in real time (a), and the alert box generated for which remote-sensing data collection was tasked (b).
3.2. Damage assessment Once a potential ‘hot spot’ is identified and remote-sensing data tasked and acquired, these images are fused with Twitter and additional available data for damage assessment. For the Boulder flood test case described, the most important task consisted in identifying the flood extent. This task called for the automatic detection of water in the images available (satellite, aerial, ground), as well as the identification of tweets that specifically mentioned flooded areas. This damage assessment is tailored to classify transportation infrastructure during and after an event to determine which roads are impassable.
3.2.1. Classification of satellite images A decision tree supervised machine learning classifier is employed to semi-automatically identify water regions in each of the satellite images (Ripley 2008). Cervone and Haack (2012) describe the general rule induction methodology and its implementation used in this study. Several control areas of roughly the same are manually identified as examples and counter-examples of water pixels. This task involves visually inspecting the images using graphics software to identify the flooded and non-flooded regions. These regions are then used as training events by the classifier, which learns a binary decision tree. This is an upside-down tree-like structure, where each node is an attribute-value condition (e.g. band_7 < .088), and each branch represents the path that is taken if the condition is satisfied (left) or not (right). A classification is made by transversing the entire tree starting at the root, and assigning the class (water or no water) associated with the leaf. Figure 3 shows a sample decision tree built using multispectral satellite data for the classification of pixels. In this particular example, class 1 is water, class 2 is an urban area, and class 3 is a vegetated area. The learned tree is used to classify all pixels in all images available. The decision tree algorithm uses a combination of bands to determine a classification. Most important is the near-IR band because in this part of the EM spectrum, water is easily distinguished from soil and vegetation due to its strong absorption (Smith 1997).
Downloaded by [68.177.129.57] at 09:10 14 December 2015
110
G. CERVONE ET AL.
Figure 3. Decision Tree learned for the classification of pixels of a satellite image into one of three classes. In this particular example, class 1 is water, class 2 is an urban area, and class 3 is a vegetated area.
3.2.2. Classification of RGB images Working with aerial and ground images poses challenges because the data are usually collected using conventional digital cameras that can only capture information in visible light. Therefore, each image contains only thee spectral channels in RGB colour space. Conversely, advanced multispectral sensors available through various remote-sensing platforms are structured to collect data in different parts of the EM spectrum usually ranging from ultraviolet (UV) to emissive infrared (IR). For the identification of water, near-IR is particularly important (see Section 3.2.1). The aerial (CAP and Falcon UAV) and ground images are classified using an ensemble of a supervised decision tree machine learning classifier and a Maximum Likelihood Classifier. Two classifiers are used because of the additional difficulty introduced by the lack of IR information. Furthermore, because of the lack of IR data, a 2D wavelet transformation using the Haar mother wavelet is first run to extract texture information for all the images, and thus expands the search space beyond RGB. Then for each transformed image representation (RGB + wavelet coefficient components) a decision tree learning algorithm is used to classify each pixel as water in a similar manner to that described in Section 3.2.1. There are thousands of aerial images, and thus training regions are chosen only in a small subset of the total data. Once the decision tree is learned using this small training set, it is applied to all images in the data set. An identical process is repeated for the ground images. The overall goal of the proposed method is not to achieve a 100% accuracy in pixel classification, but rather to perform a quick assessment to determine which areas are
INTERNATIONAL JOURNAL OF REMOTE SENSING
111
Downloaded by [68.177.129.57] at 09:10 14 December 2015
more likely to be flooded. Even if large errors might occur, they are naturally filtered and smoothed when thousands of points across the different data sets are fused together.
3.2.3. Spatial interpolation The data fusion problem consists of merging together heterogeneous data with different temporal and spatial resolutions. Furthermore, especially in the case of tweets, the amount of data to be analysed is very large although it is usually only 1% of the entire data stream. This is usually referred to as the ‘Big Data paradox’, where very large amounts of data to be analysed are only a small sample of the total data. This sample might or might not be representative of the distribution of the entire population. The absence of data in some parts of the region is likely to underestimate the total damage. To compensate for missing data, a non-homogeneous weighting is employed (Tobler 1970, 236). This assumes some level of dependence among spatial data as well as to closely examine spatial information found to be inconsistent with its surroundings (Waters, forthcoming). For these reasons a punctual representation of data may not be sufficient to provide a complete portrayal of the hazard; therefore a spatial interpolation is employed to estimate flood conditions and damage from point sources. Spatial interpolation consists of estimating the damage at unsampled locations by using information about the nearest available measured points. This process can be implemented by using two different approaches: deterministic models and statistical techniques. The first method does not provide an indication of the extent of possible errors, whereas the second method supplies probabilistic estimates. Deterministic models include Inverse Distance Weighted (IDW), Rectangular and Spline (Waters 2009). Statistical methods include Kriging and kernel (Myers 1994). Kernel interpolation is the most popular non-parametric density estimator that is a ^ : < ! ð


![Scraping Twitter and Web Data Using R - NYU [PDF]](https://m.moam.info/img/260x300/scraping-twitter-and-web-data-using-r-nyu-pdf_647d3dca098a9ebc738b4673.jpg)