o uso da Análise Independente de Componentes, técnica comum para reduzir o ruÃdo em dados .... SF is a technique developed for online compressing, that is, the samples are ..... DisponÃvel em: .
A framework for data compression and damage detection in structural health monitoring applied on a laboratory three-story structure Manoel Lima 1 Claudomiro Sales 1 Adam Santos 1 Reginaldo Santos 1 Moisés Silva 1 João Costa 1 Marissa Carvalho 1 Michell Cruz 1
Resumo: o Monitoramento de Integridade Estrutural (MIE) é uma importante técnica usada para preservar vários tipos de estruturas a curto e longo prazo, usando redes de sensores para coletar continuamente os dados desejados. No entanto, isso provoca um forte impacto no tamanho dos dados a serem armazenados e processados. Uma solução comum é utilizar algoritmos de compressão, em que o nível de compressão de dados deve ser adequado o suficiente para permitir a correta identificação de danos. Neste trabalho, utilizamos os dados provenientes de uma estrutura de laboratório com três andares para avaliar o desempenho de algoritmos de compressão comuns que, em seguida, são combinados com algoritmos de detecção de danos utilizados em MIE. Analisamos, também, como o uso da Análise Independente de Componentes, técnica comum para reduzir o ruído em dados brutos, pode ajudar o desempenho da detecção. Os resultados mostraram que PWLH combinado com NLPCA têm o melhor custo-benefício entre a compressão e detecção para limiares de compressão pequenos enquanto que APCA com PCA Adaptativo é melhor com valores de limiares mais elevados. Palavras-chave: Framework. Compressão de dados. Detecção de danos. Efeitos ambientais. Efeitos operacionais. Monitoramento de integridade estrutural.
Abstract: Structural Health Monitoring (SHM) is an important technique used to preserve many types of structures in the short and long run, using sensor networks to continuously gather the desired data. However, this causes a strong impact in the data size to be stored and processed. A common solution to this issue is using compression algorithms, where the level of data compression should be adequate enough to allow the proper damage identification. In this work, we use the data sets from a laboratory three-story structure to evaluate the performance of common compression algorithms which, then, are combined with damage detection algorithms used in SHM. We also analyze how the use of Independent Component Analysis, a common technique to reduce noise in raw data, can assist the detection performance. The results showed that Piecewise Linear Histogram combined with Nonlinear PCA have the best trade-off between compression and detection for small error thresholds while Adaptive PCA with Principal Component Analysis perform better with higher values. Keywords: Framework. Data compression. Damage detection. Environmental effects. Operational effects. Structural health monitoring.
1
Introduction
Structural Health Monitoring (SHM) aims to identify damages in a structure to execute the needed measures for prevention and correction. This process involves the structure observation over time using dynamic response 1 Programa
de Pós-graduação em Ciência da Computação, Universidade Federal do Pará, R. Augusto Corrêa, 1 - Guamá, 66075-110, Belém, Pará, Brasil {manoel.lima,reginaldo.filho,moises.silva,marissa.carvalho,michell.cruz}@icen.ufpa.br {cssj,jweyl,adamdreyton}@ufpa.br http://dx.doi.org/10.5335/rbca.v8i2.5703
Revista Brasileira de Computação Aplicada (ISSN 2176-6649), Passo Fundo, v. 8, n. 2, p. 129-143, jul. 2016 129
measures with periodical intervals [1]. This is done by using electronic sensors, suitable to the parameter (e.g., acceleration, strain and temperature) that must be monitored. The information obtained from the monitoring is usually used to plan and project maintenance activities, enhance security, check hypotheses, reduce uncertainty and broaden the knowledge about the structure [2]. There are many machine learning algorithms which can be used in the context of damage detection on the structure by analyzing its temporal series of traffic loading, vibration, pressure and other parameters. However, structures are subject to environmental and operational influences, such as varying temperature, moisture and loading conditions. All of these effects may impact the performance of a damage classifier, which can signal a damage because of changes in the environment when, in reality, there is none [3]. On top of that, in large and complex systems, such as bridges and buildings, continuous monitoring generates a large volume of data, reaching thousands of samples per second [4]. As a result, it may be possible that substantial overloads occur on the network and on the measurement database [5]. In this context, data compression is extremely useful since it can diminish the amount of data and preserve the characteristics – or features – that are sensitive to structural changes [1], leading to cost savings by reducing storage and processing requirements. Some data compression methods have precision limits and, based on these limits, sensor data are approximated [6]. This implies that the chosen method should be appropriate for the type of measurement in question – temperature and vibration, for example – so that the accuracy limits do not affect the performance of structural damage detection. Some of the most used compression algorithms for SHM are: Piecewise Constant Approximation [7], Adaptive Piecewise Constant Approximation [8], Piecewise Linear Histogram [9], Slide Filters [5] and Chebyshev Approximation [10]. Recent literature contains many works addressing the performance of data compression. A notable example in SHM can be found in [11], which compares six algorithms applied to real structure data sets containing information about 11 physical variables. They conclude that, overall, Adaptive Piecewise Constant Approximation and Slide Filters performed better, regarding compression ratio and transmission cost, specially when data values in a sensor signal show low fluctuations. Additionally, they found that Slide Filters can be a promising technique by facilitating data communication in wireless or in-network sensing environments. On the other hand, the study performed in [12] compared four machine learning algorithms (Auto-associative neural network, Factor analysis, Mahalanobis distance and Singular value decomposition) aimed to identify vibration-based damages on data sets based on a laboratory structure. The normal condition of the structure was established as a function of the operational and environmental variability. The results shown that all algorithms were reliable techniques to distinguish between damaged and undamaged scenarios, even when simulated operational and environmental variability is present in both cases. However, combining data compression and damage detection algorithms is not a trivial task. The features of each compressed time series supplied to a damage detection algorithm may not be the best ones to maximize the detection performance. Hence, an optimal compressed data sets might not hold the sensitive features in enough detail to allow the proper identification by a specific damage detection algorithm. For this reason, some works perform a particular setup of compression and detection algorithms. In [13], the authors use Principal Component Analysis (PCA) for compression and Root-mean Square-deviation (RMSD) for damage detection. The authors used k-Means algorithm to confirm that PCA was able to distinguish sensitive data from noise, concluding that the compressed data still kept the features necessary for the correct identification of damages. A similar work was done in [14], using, also, PCA for compression and Self Organizing Map (SOM) for damage detection. To evaluate the detection performance, Q-statistic and T 2 -statistic were used in the model generated by SOM. The results shown that this setup was able to correctly classify the data into damaged or undamaged scenarios. As it can be seen, the performance evaluation of compression and detection techniques are not standardized. Furthermore, the data sets used are from a variety of sources, from a real structure, as in [11] and [13], or from an experimental setup, as in [12] and [14]. Therefore, this paper aims to develop a framework for SHM in terms of data compression efficiency and how this affects damage detection techniques. Such framework will consist in a set of steps which establish a common ground for analyzing the performance of data compression versus damage detection, allowing techniques to be included or excluded as well as customizing their parameters. The main contribution of our work is to make it possible to generate results regarding a specific data set, real or experimental, providing insights on how several techniques behave in the desired context. Furthermore, the use of our framework will aid other studies to detect the techniques’ advantages and weaknesses when they are compared, allowing further enhancement to these techniques, ease the decision making step when deploying a SHM system and reducing costs
Revista Brasileira de Computação Aplicada (ISSN 2176-6649), Passo Fundo, v. 8, n. 2, p. 129-143, jul. 2016 130
with storage while maintaining an acceptable level of damage detection. To this end, we implement the framework for use with the data sets from a laboratory three-story building structure developed by [12], because the undamaged and damaged states are known and well-behaved. This work is outlined as follows: Section 2 explains the methodology, the algorithms and the structure data sets used in the framework; Section 3 shows the results obtained from the several setups tested and a discussion about their efficiency; Finally, section 4 draws the conclusions and future works.
2
Theoretical Background of the Framework
There are several ways to evaluate the performance of a compression algorithm. One of the most common methods is to calculate its compression ratio [15], defined as C=
Zo , Zi
(1)
where Zo is the size of the output stream and Zi , the size of the input stream. As an example, the value of 0.7 means that the compressed data uses 70% of the original size. However, to observe the space savings, we use 1 − C as compression ratio, that is, there was a reduction of 30% in data size. Furthermore, compression algorithms may have difficulties when approximating a signal. This happens because the presence of environmental and operational variations, which are natural to the structure and do not represent damages, misleading the approximation resulting in unnecessary data being compressed. A common technique to attenuate these interferences is Independent Component Analysis (ICA), which works by decomposing signals into uncorrelated independent components [16]. In this work, we use compression algorithms that are commonly used in the literature, as seen in [11], [5] and [10]. Table 1 shows their names and abbreviations. Subsequently, we briefly describe how they operate. Table 1: Compression algorithms and their abbreviations Piecewise Constant Approximation [7] Adaptive Piecewise Constant Approximation [8] PieceWise Linear Histogram [9] Slide Filter [5] Chebyshev [10]
PCA-C APCA PWLH SF CHEB
Source: The authors PCA-C is a simple technique that divides the data into fixed-size portions (windows) and tries to represent their data points using a constant function. Considering a data set S = {v1 , v2 , · · · , vn } with n data points, a fixed window size w and a maximum error threshold �, the first window to be read is W = {v1 , v2 , · · · , vw }. Then, the maximum value vmax and the minimum value vmin of W are calculated. The compression occurs when vmax − vmin < 2�, meaning that all the data points of W are represented by a constant function defined as vˆ = (vmax − vmin )/2, otherwise the original points are left untouched. This process is repeated for all data points. APCA works similarly as PCA, however, the window size w is variable. To form a window W , APCA consecutively reads the data points until vmax − vmin > 2�, excluding the last point when this condition is met. Then, the points in W are represented by vˆ and a new empty window is created, repeating the process. PWLH is an extension of APCA [11], but uses a linear function to approximate the data in each window, contrary to PCA-C and APCA, which use constant functions. This allows PWLH to use lines with arbitrary slope to better represent the data points, minimizing the distance of any point to the line in any given window. SF is a technique developed for online compressing, that is, the samples are obtained and processed in real-time as they become available. The goal is to record only successive line segments instead of the individual
Revista Brasileira de Computação Aplicada (ISSN 2176-6649), Passo Fundo, v. 8, n. 2, p. 129-143, jul. 2016 131
data points. To do this, at any point in time, SF keeps a set of candidate approximation lines that satisfy a maximum error constraint �. When a new point is read, the lines that do not obey the constraint are removed. Lines can be connected or disconnected, but the latter case means more data to be stored. CHEB compression works by also creating fixed-sized windows. However, the approximation is done by a linear combination of Chebyshev polynomials, meaning that the lines can be curved and, therefore, better represents the original signal. Given a window W = {v1 , v2 , · · · , vw } and a degree d, we can represent W as a polynomial combination [11], described as
vˆ =
d X
βk · Tk (t0 ),
(2)
k=0
where • t0 = (t −
w+1 2 )
·
2 w−1
is the normalized value of t ∈ [−1, 1],
• Tk (t0 ) = cos(k · cos−1 (t0 )), t0 ∈ [−1, 1] is the Chebyshev polynomial of degree k, • βk is the coefficient of Chebyshev polynomial at degree k. Equally important, the performance evaluation of the damage detection algorithms, shown in Table 2, can be done by measuring their sensitivity, specificity, and the occurrences of Type I and Type II errors, as such algorithms aim to determine whether a signal has features that indicate damage or not. Considering that they have to classify an instance signal as damaged and undamaged, there are four possible situations [17]: 1. The instance is damaged and it is classified as damaged, counting as a true positive. 2. The instance is damaged and it is classified as undamaged, counting as false negative. 3. The instance is undamaged and it is classified as undamaged, counting as true negative. 4. The instance is undamaged and it is classified as damaged, counting as false positive. In this work, the fourth situation is named Type I error, while the second one is named Type II error. As it can be seen, Type II errors are the most harmful to an SHM application because it can pose a high security risk, showing no damage when, in fact, there is. Based on these metrics, sensitivity and specificity can be defined as shown in Equations 3 and 4. Ideal performances have both high sensitivity and specificity values, meaning a low rate of false positives and false negatives, respectively. True positives Total of damaged instances
(3)
True negatives Total of undamaged instances
(4)
sensitivity =
specif icity =
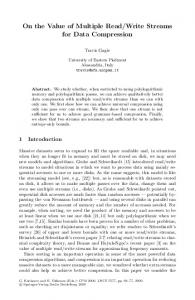
As for the damage detection algorithms, Table 2 shows the ones used in this work along with their abbreviations. For brevity, we refer the reader to the references of the algorithms for further details of their working principles. Furthermore, the damage detection algorithms can be applied onto the approximated data so that one can observe how the latter impacts the former. Such impact can be measured by analyzing sensitivity and specificity. Therefore, it is possible to check which of the algorithms performed better for the type of data compression used, taking into account the compression ratio and the preservation of the sensitive features. Figure 1 shows the steps for using the framework to evaluate the performance of compression and damage detection techniques. In the Data Acquisition step, we use the data sets from the work [22]. The data was extracted
Revista Brasileira de Computação Aplicada (ISSN 2176-6649), Passo Fundo, v. 8, n. 2, p. 129-143, jul. 2016 132
Table 2: Damage detection algorithms and their abbreviations Factor Analysis [12] Mahalanobis Squared Distance [18] Principal Component Analysis [19] Nonlinear PCA [20] Singular Value Decomposition [21]
FA MSD PCA-D NLPCA SVD
Source: The authors from a laboratory structure composed by three floors, each one having an accelerometer and also being coupled with a shaker to generate vibrations. The data was obtained from 1,700 tests, being 100 tests for each structural condition. Four accelerometers collected 4,096 samples in each test. In the Parameter Definition step, we test several algorithms settings regarding error thresholds, window size, and every other parameters related to the compression or damage detection algorithm. Then, the five compression algorithms are executed to compress the data from the Data Compression step. Once the compressed data is generated, it is readily decompressed so that we can validate the data, checking if it is correctly reconstructed in the Validation step. The ICA algorithm is used as a Pre-processing step, aiming to attenuate the environmental and operational conditions for damage detection algorithms unable to do this task directly, such as: PCA-D, MSD, and SVD. However, when not using ICA, the compressed data generated is supplied directly to the five damage detection algorithms without any pre-processing. Finally, the metrics obtained from the tests are analyzed in the Results Analysis step to rank the algorithms according to their performance. Figure 1: Framework’s flowchart depicting the steps to analyze the performance of data compression and damage detection
Source: The authors
3
Results and Discussion
The framework and the compression algorithms used were implemented in MATLAB® R2012. Regarding the damage detection algorithms, we use Structural Health Monitoring Tools MATLAB® package (SHMTools) [23]. All experiments were executed in a Windows® 10 operational system with 4 GB of main memory and a 2.5 GHz Intel® CPU. Firstly, we analyze the performance of the compression algorithms by varying their ε values, since they directly influence the compression ratio. However, to PCA-C be able to effectively compress the samples in the data sets, the ε values used are higher. Once the compression performance is known, we then use the damage detection
Revista Brasileira de Computação Aplicada (ISSN 2176-6649), Passo Fundo, v. 8, n. 2, p. 129-143, jul. 2016 133
algorithms supplying them with the compressed data. To evaluate these algorithms, sensitivity and specificity are used as well as the number of Type I and Type II occurrences, attributing a higher penalty to Type II errors since they are the most harmful between both. Finally, we investigate the benefits of using ICA in the raw data, since it is intended to enhance compression. 3.1
Compression Performance
To correlate our compression results with [11], we use their compression threshold values: ε = 0.01, 0.05 and 0.1. As for PCA-C and CHEB, their windows size were configured to 16, following the recommendations of [10, 11] Figure 2 shows the performance of the compression algorithms. We can note that SF was the one which achieved better compression ratios in every case. This can be explained by its variable size window. On the other hand, PCA-C and CHEB achieved the worst results because the ε values were not high enough so that they could filter the data more efficiently. Figure 2: Algorithms’ compression ratios with ε = 0.01, 0.05 and 0.1
Source: The authors On the other hand, increasing the value ε for PCA-C and CHEB from 0.2 up to 0.9 showed that it is possible to gain more compression ratio. The window sizes were also changed to 8, 16 and 24. However, only a window of size 24 achieved the best results compared to the other sizes. As an example, Figure 3 shows how the PCA-C performance reaches its maximum compression ratio of 96% when ε ≥ 0.5. The same overall behavior also applies to CHEB. Despite this gain in compression, any damage detection technique used will be negatively affected, since the approximated signal will be composed mainly by repeated data (constant values), rendering the signal worthless for any detection [6]. For this reason, we keep the ε and windows values as suggested by [10, 11]. 3.2
Damage Detection Performance
To test the damage detection algorithms, they were supplied with the approximated data from all the compression algorithms and their respective ε values. The evaluation consists in calculating the occurrences of Type I and Type II errors as well as their sensitivity and specificity values. In the scenario with ε = 0.01, PCA-C and CHEB achieved a compression ratio of 0% (see Figure 2), meaning that they were not able to reduce the signal data, giving no advantage for the damage detection procedures. For this reason, they will not be considered. Table 3 summarizes the occurrences of Type I and Type II errors obtained during the detection of damages in the approximated data. Since Type I occurrences were practically the same among all the algorithms and Type II errors are more harmful, only the latter is considered. As a result, SF has the worst performance due to the fact that the compressed data generated by it makes the damage detection algorithms encounter more Type II errors. On the other hand, APCA and PWLH share better results similar to one another. However, as shown in Figure 2, the compression ratio of PWLH (53%) is greater than that of APCA (10%), which leads to the conclusion that PWLH is the best compression technique when ε = 0.01, specially when combined
Revista Brasileira de Computação Aplicada (ISSN 2176-6649), Passo Fundo, v. 8, n. 2, p. 129-143, jul. 2016 134
Figure 3: Compression ratio (in %) for PCA-C and CHEB with varying ε and window size 24. Values above ε = 0.4 cause significant data loss in the approximated data
Source: The authors with NLPCA. This also can be noted on Table 4, where the highest values of specificity and sensitivity belongs to PWLH with NLPCA. Table 3: Occurrences of Type I and Type II errors from the damage detection algorithms when ε = 0.01. Values from the best combination are in bold Damage detection algorithms
APCA
Type I Type II
FA 18 220
MSD 42 135
PCA-D 18 147
NLPCA 26 146
SVD 23 226
PWLH
Type I Type II
19 222
50 123
32 148
34 115
16 227
SF
Type I Type II
16 238
46 166
34 169
32 163
15 251
Source: The authors Table 4: Sensitivity and specificity, in %, when ε = 0.01. Values from the best combination are in bold Damage detection algorithms
APCA
Sen. Spe.
FA 84.8 98.3
MSD 89.9 96.4
PCA-D 89.3 98.4
NLPCA 89.3 97.7
SVD 84.4 97.8
PWLH
Sen. Spe.
84.7 98.2
90.7 95.8
89.2 97.2
91.4 97.1
84.5 98.5
SF
Sen. Spe.
83.8 98.4
87.9 95.9
87.8 97.0
88.2 97.1
83.1 98.5
Source: The authors
Revista Brasileira de Computação Aplicada (ISSN 2176-6649), Passo Fundo, v. 8, n. 2, p. 129-143, jul. 2016 135
Table 5 shows the occurrences of Type I and Type II errors in the scenario with ε = 0.05. PCA-C will not be considered due to its 0% compression ratio. As it can be seen, SF performed worst again for the same reasons already stated in the previous scenario and the best results are from CHEB and PWLH. However, the compression ratio of PWLH (64%) is considerably greater than that of CHEB (10%), which makes PWLH the best technique when ε = 0.05. This can be confirmed by the Table 6, where PWLH combined with NLPCA yields one of the highest values for sensitivity and specificity when compared to most of the combinations of CHEB with all other detection algorithms. Table 5: Occurrences of Type I and Type II errors from the damage detection algorithms when ε = 0.05. Values from the best combination are in bold Damage detection algorithms
APCA
Type I Type II
FA 22 455
MSD 46 326
PCA-D 38 292
NLPCA 38 335
SVD 18 423
CHEB
Type I Type II
22 267
42 219
39 191
18 274
23 266
PWLH
Type I Type II
25 383
51 292
39 295
37 265
27 390
SF
Type I Type II
24 424
37 330
20 325
40 312
29 433
Source: The authors Table 6: Sensitivity and specificity, in %, when ε = 0.05. Values from the best combination are in bold Damage detection algorithms
APCA
Sen. Spe.
FA 73.0 97.3
MSD 78.7 95.3
PCA-D 80.6 96.2
NLPCA 78.3 96.0
SVD 74.4 97.9
CHEB
Sen. Spe.
82.1 97.8
84.7 96.1
86.4 96.4
81.8 98.2
82.2 97.7
PWLH
Sen. Spe.
76.2 97.2
80.4 94.9
80.4 96.1
82.1 96.4
75.8 97.0
SF
Sen. Spe.
74.2 96.7
78.6 96.1
79.1 97.9
79.5 95.9
73.8 96.6
Source: The authors
Revista Brasileira de Computação Aplicada (ISSN 2176-6649), Passo Fundo, v. 8, n. 2, p. 129-143, jul. 2016 136
Finally, in the scenario with ε = 0.1, the occurrences of Type I and Type II errors are reported in Table 7. Since PCA-C compression ratio (2%) is still too small for providing any benefit to the detection algorithms, it will not be considered. In contrast with the previous scenarios, PWLH achieved the worst performance causing the detection algorithms to encounter more Type II errors. The best results come from both CHEB combined with MSD and APCA combined with PCA-D, but it is worth noting that the compression ratio of APCA (64%) is greater than that of CHEB (44%). Despite this, Table 8 shows that both algorithms cause similar performance to detection techniques, which is reasonable to conclude that APCA is the best compression algorithm for ε = 0.1 primarily because of its compression ratio. Table 7: Occurrences of Type I and Type II errors from the damage detection algorithms when ε = 0.1. Values from the best combination are in bold Damage detection algorithms
APCA
Type I Type II
FA 14 457
MSD 33 348
PCA-D 28 336
NLPCA 21 401
SVD 23 488
CHEB
Type I Type II
25 354
41 297
25 317
28 330
24 351
PWLH
Type I Type II
17 548
49 349
24 400
18 458
22 604
SF
Type I Type II
13 519
46 352
23 360
34 364
18 578
Source: The authors Table 8: Sensitivity and specificity, in %, when ε = 0.1. Values from the best combination are in bold Damage detection algorithms
APCA
Sen. Spe.
FA 73.0 98.3
MSD 77.8 96.5
PCA-D 78.4 97.0
NLPCA 75.4 97.6
SVD 71.5 97.1
CHEB
Sen. Spe.
77.6 97.3
80.3 95.9
79.4 97.4
78.7 97.0
77.7 97.4
PWLH
Sen. Spe.
69.2 97.6
77.5 94.8
75.4 97.3
72.9 97.8
67.0 96.7
SF
Sen. Spe.
70.4 98.3
77.4 95.1
77.3 97.5
77.0 96.3
68.1 97.4
Source: The authors
Revista Brasileira de Computação Aplicada (ISSN 2176-6649), Passo Fundo, v. 8, n. 2, p. 129-143, jul. 2016 137
3.3
ICA Performance
To evaluate the performance of ICA, we applied it in MSD, PCA-D and SVD using ε = 0.01, 0.05 and 0.1 for the compression algorithms. Then, for comparison, we calculate the average occurrence of each error type of a compression technique combined with a damage detection technique with and without the use of ICA. As for the sensitivity and specificity, the difference between the values using and not using ICA is also calculated. Therefore, negative values of sensitivity or specificity differences imply that the use of ICA achieved smaller (worse) values than not using. Figure 4 shows the occurrences of Type I and Type II errors when ε = 0.01. It can be noted that PCA-C and CHEB share fairly similar results, with and without ICA, due to their low compression ratio in this scenario. However, as it can be seen, using ICA yields worse results. This can be confirmed by examining Table 9, in which most of the values are negative. The highest values are from PWLH with MSD, but since these values show a small difference – nearly 0 – this means that ICA does not provide substantial improvement to damage detection. Figure 4: Average occurrences of Type I and Type II errors with and without ICA applied in the damage detection techniques when ε = 0.01
Source: The authors
Revista Brasileira de Computação Aplicada (ISSN 2176-6649), Passo Fundo, v. 8, n. 2, p. 129-143, jul. 2016 138
Table 9: Sensitivity and specificity differences regarding the use and absence of ICA with ε = 0.01. Values from the best combination are in bold Damage detection algorithms
APCA
Sen. Spe.
MSD -7.9 -0.4
PCA-D 0.7 -3.4
SVD -6.4 0.2
CHEB
Sen. Spe.
-0.3 0
0 -1.6
-0.7 0.2
PCA-C
Sen. Spe.
-0.3 0.3
0 -1.8
-0.7 0.3
PWLH
Sen. Spe.
0.3 0.2
-0.2 -2.2
-1.5 -0.5
SF
Sen. Spe.
-4.9 0.1
1.2 -2
-4.1 -1.5
Source: The authors A similar behavior can be observed when ε = 0.05, as it can be attested in Figure 5. PCA-C still maintains the same performance either using or not using ICA since its compression ratio in this scenario is still 0%. On the other hand, we can see that CHEB has increased its Type II occurrences because its compression ratio has also increased to 10%. This fact can show that the higher the compression ratio, the lower the damage detection performance will be. This can be concluded intuitively as the more compressed a signal is, the more imprecise its approximated version will become, losing many of its features used for damage detection. This confirms the higher number of Type II occurrences in most of the compression algorithms since their compression ratio tends to be higher than that of PCA-C and CHEB. Regarding ICA performance in this scenario, we observe that it has not increased substantially, as shown in Table 10. The major enhancement is present in PCA-C with PCA-D, with the highest sensitivity difference. The cause, again, is PCA-C low compression ratio, which preserves the features aiding in the correct identification of damages.
Revista Brasileira de Computação Aplicada (ISSN 2176-6649), Passo Fundo, v. 8, n. 2, p. 129-143, jul. 2016 139
Figure 5: Average occurrences of Type I and Type II errors with and without ICA applied in the damage detection techniques when ε = 0.05.
Source: The authors Table 10: Sensitivity and specificity differences regarding the use and absence of ICA with ε = 0.05. Values from the best combination are in bold Damage detection algorithms
APCA
Sen. Spe.
MSD -5.7 0.7
PCA-D -1.6 -3.2
SVD -5.4 0.1
CHEB
Sen. Spe.
-10.7 -0.1
-6.4 -1.4
-10.2 0.3
PCA-C
Sen. Spe.
-0.8 -0.6
3.5 -1.6
-5.8 0.1
PWLH
Sen. Spe.
-0.4 0.1
-0.4 -6.1
-2.8 1
SF
Sen. Spe.
0.4 -0.1
1.9 -4.9
-0.8 0.4
Source: The authors When ε = 0.1, PCA-C still has a low compression ratio (2%), which will preserve the same overall behavior discussed in the previous scenario. For this reason we may ignore it from the current analysis. From the four remaining compression algorithms, ICA was able to reduce the number of Type II errors in two of them – SF and PWLH – showing a better performance than the previous scenarios as it shown it Figure 6. In this case, the best compression performance is achieved with SF (79%) when compared with that of PWLH (76%). Considering the damage detection performance, however, PWLH produce the highest gain in sensitivity, paired with SVD, as shown in Table 11. Since this gain in detection outperform all the ones from SF, and the compression ratio difference between PWLH and SF is small, is reasonable to conclude that PWLH with PCA-D is the best combination when ε = 0.1 and using ICA.
Revista Brasileira de Computação Aplicada (ISSN 2176-6649), Passo Fundo, v. 8, n. 2, p. 129-143, jul. 2016 140
Figure 6: Average occurrences of Type I and Type II errors with and without ICA applied in the damage detection techniques when ε = 0.1
Source: The authors Table 11: Sensitivity and specificity differences regarding the use and absence of ICA with ε = 0.1. Values from the best combination are in bold Damage detection algorithms
APCA
Sen. Spe.
MSD 0.2 -0.5
PCA-D 2.6 -6
SVD 0.5 0.9
CHEB
Sen. Spe.
-0.3 0.1
2.6 -5.4
-2.7 -0.4
PCA-C
Sen. Spe.
-3.7 0.3
4.2 -0.6
-4.6 0.3
PWLH
Sen. Spe.
-0.5 0.2
4.6 -6.3
5 1.3
SF
Sen. Spe.
-4.4 0.9
1.7 -4.5
0.9 0.6
Source: The authors
4
Conclusions
In conclusion, we developed a framework aimed to contrast the performance of several compression algorithms when combined with a set of damage detection algorithms, using data sets from measurements recorded by vibration sensors installed in a laboratory three-story structure. Also, the use of ICA was analyzed to verify its benefits to compression. The results obtained made possible the development of a framework capable of aiding the decision step when deploying a SHM system. Such tool can be used to avoid time consuming experiments and
Revista Brasileira de Computação Aplicada (ISSN 2176-6649), Passo Fundo, v. 8, n. 2, p. 129-143, jul. 2016 141
analysis of the best set of algorithms to be used. This study also investigates the best values ε for each compression algorithm, as this threshold undoubtedly interferes in the compression ratio. Then, as for damage detection, the occurrences of Type I and Type II errors, sensitivity and specificity served as evaluation metrics for them. Combined, they reveal how the two sets of algorithms behave. It was observed that when ε = 0.01 or 0.05, the best combination was PWLH with NLPCA, whereas when ε = 0.1, APCA with PCA-D showed best performance. On the other hand, applying ICA into the raw data as a pre-processing step to reduce redundancy has only been useful when ε = 0.1, making PWLH produce approximated data that yields less errors when supplied to the damage detection algorithms, specially SVD. As future work, the investigation of data compression and damage detection performance in other data sets is needed, since the results derived from the particular laboratory structure, via the developed framework, can not be generalized to other scenarios. We also suggest further investigation in outlier detection algorithms, since this is the main cause of reduced performance by the compression step. Finally, other algorithms may need to be included, given the rapid development of the SHM field.
Acknowledgments The authors would like to thank CAPES (Coordenação de Aperfeiçoamento de Pessoal de Nível Superior) and CNPq (Conselho Nacional de Desenvolvimento Científico e Tecnológico) for their financial support in this work.
Referências [1]
FARRAR, C. R.; WORDEN, K. Structural health monitoring: a machine learning perspective. [S.l.]: John Wiley & Sons, 2012. ISBN 9781118443118.
[2]
GLISIC, B.; INAUDI, D. Fibre optic methods for structural health monitoring. [S.l.]: John Wiley & Sons, 2008.
[3]
SOHN, H.; WORDEN, K.; FARRAR, C. R. Statistical damage classification under changing environmental and operational conditions. Journal of Intelligent Material Systems and Structures, v. 13, n. 9, p. 561–574, 2002. Disponível em: .
[4]
MADDEN, S. Database abstractions for managing sensor network data. Proceedings of the IEEE, v. 98, n. 11, p. 1879–1886, 2010. Disponível em: .
[5]
ELMELEEGY, H. et al. Online piece-wise linear approximation of numerical streams with precision guarantees. PVLDB, v. 2, n. 1, p. 145–156, 2009. Disponível em: .
[6]
SATHE, S. et al. A survey of model-based sensor data acquisition and management. In: Managing and Mining Sensor Data. [s.n.], 2013. p. 9–50. Disponível em: .
[7]
LAZARIDIS, I.; MEHROTRA, S. Capturing sensor-generated time series with quality guarantees. In: Proceedings of the 19th International Conference on Data Engineering, March 5-8, 2003, Bangalore, India. [s.n.], 2003. p. 429–440. Disponível em: .
[8]
KEOGH, E. J. et al. Locally adaptive dimensionality reduction for indexing large time series databases. In: Proceedings of the 2001 ACM SIGMOD international conference on Management of data, Santa Barbara, CA, USA, May 21-24, 2001. [s.n.], 2001. p. 151–162. Disponível em: .
[9]
BURAGOHAIN, C.; SHRIVASTAVA, N.; SURI, S. Space efficient streaming algorithms for the maximum error histogram. In: Proceedings of the 23rd International Conference on Data Engineering, ICDE 2007, The Marmara Hotel, Istanbul, Turkey, April 15-20, 2007. [s.n.], 2007. p. 1026–1035. Disponível em: .
Revista Brasileira de Computação Aplicada (ISSN 2176-6649), Passo Fundo, v. 8, n. 2, p. 129-143, jul. 2016 142
[10] CHENG, A. F. et al. Data compression using Chebyshev transform. [S.l.]: Google Patents, 2007. US Patent 7,249,153. [11] HUNG, N. Q. V.; JEUNG, H.; ABERER, K. An evaluation of model-based approaches to sensor data compression. IEEE Trans. Knowl. Data Eng., v. 25, n. 11, p. 2434–2447, 2013. Disponível em: . [12] FIGUEIREDO, E. et al. Machine learning algorithms for damage detection under operational and environmental variability. Structural Health Monitoring, v. 10, n. 6, p. 559–572, 2011. Disponível em: . [13] PARK, S. et al. Electro-mechanical impedance-based wireless structural health monitoring using pca-data compression and k-means clustering algorithms. Journal of Intelligent Material Systems and Structures, v. 19, n. 4, p. 509–520, 2008. Disponível em: . [14] TIBADUIZA, D. A.; MUJICA, L. E.; RODELLAR, J. Damage classification in structural health monitoring using principal component analysis and self-organizing maps. Structural Control and Health Monitoring, v. 20, n. 10, p. 1.303–1.316, 2013. ISSN 1545-2263. Disponível em: . [15] SALOMON, D. Data Compression: The Complete Reference, 3rd Edition. Berlin: Springer, 2004. ISBN 0-387-40697-2. [16] ZANG, C.; FRISWELL, M. I.; IMREGUN, M. Structural damage detection using independent component analysis. Structural Health Monitoring, v. 3, n. 1, p. 69–83, 2004. Disponível em: . [17] FAWCETT, T. An introduction to ROC analysis. Pattern Recognition Letters, v. 27, n. 8, p. 861–874, 2006. Disponível em: . [18] WORDEN, K.; MANSON, G.; FIELLER, N. Damage detection using outlier analysis. Journal of Sound and Vibration, v. 229, n. 3, p. 647 – 667, 2000. ISSN 0022-460X. Disponível em: . [19] ABDI, H.; WILLIAMS, L. J. Principal component analysis. Wiley Interdisciplinary Reviews: Computational Statistics, John Wiley & Sons, Inc., v. 2, n. 4, p. 433–459, 2010. ISSN 1939-0068. Disponível em: . [20] YAN, A.-M. et al. Structural damage diagnosis under varying environmental conditions—part II: local PCA for non-linear cases. Mechanical Systems and Signal Processing, v. 19, n. 4, p. 865 – 880, 2005. ISSN 0888-3270. Disponível em: . [21] RUOTOLO, R.; SURACE, C. Using svd to detect damage in structures with different operational conditions. Journal of Sound and Vibration, v. 226, n. 3, p. 425 – 439, 1999. ISSN 0022-460X. Disponível em: . [22] FIGUEIREDO, E. et al. Structural health monitoring algorithm comparisons using standard data sets. Los Alamos: Los Alamos National Laboratory, 2009. Disponível em: . Data Sets and Software. Disponível em: . Visitado em: 26 de Maio de 2016.
Revista Brasileira de Computação Aplicada (ISSN 2176-6649), Passo Fundo, v. 8, n. 2, p. 129-143, jul. 2016 143