instructors effectively introduce the new VR tools in their ... reading textbooks and listening to lectures, VR ... is especially effective when students use VR tools.
Using Virtual Reality Tools in Design and Technical Graphics Curricula: An Experience in Learning Shana Smith1, Kay Taylor2, Travis Green3, Neil Peterson4, Cynthia Garrety1 1 2
Iowa State University
State University of New York, SUNY Fredonia 3
Des Moines Area Community College 4
Iowa Central Community College
ABSTRACT – This paper presents findings from a
I. Introduction
project for introducing virtual reality (VR)
Three-dimensional visualization ability, to a
technology into design and technical graphics
great extent, determines students’ performance in
curricula. In particular, findings are presented
design and technical graphics courses. Prior
that show how the implementation of VR
research shows that 3-D visualization ability
technology affected and changed pedagogical
greatly influences students’ future career success
practices between instructors and students in
in science, engineering, and technology (McKim,
classrooms at three educational institutions.
1980; Norman, 1994; Pleck et al., 1990). Students
Classroom observations were obtained from a
without sufficient 3-D perception ability may
team of curriculum and instruction experts, who
become frustrated and drop out of CAD programs,
provided
VR
or may be advised to pursue studies in areas that
technology in the classrooms. Student surveys,
do not require CAD skills. However, if students
both before and after using VR tools, and focus
could improve and gain confidence in their 3-D
group
conducted.
visualization skills, they would enjoy CAD
Quantitative and qualitative evaluation data was
instruction more and become more engaged.
analyzed and used to plan for future use of VR
Fortunately, prior research also shows that
technology.
provide
visualization is a skill that can be learned,
insights into how to use VR technology in design
developed, and improved with proper instruction
and technical graphics education, which can help
and methods (Bishop, 1973; Gagon, 1985;
instructors effectively introduce the new VR tools
McKim, 1980). Thus, to help our students remain
in their classrooms.
in and succeed in CAD programs and to succeed
feedback
interviews,
concerning
were
Implementation
also
use
findings
of
2
in their future careers, it is essential to find
reading textbooks and listening to lectures, VR
effective methods for delivering graphics concepts
allows students to see images and move around in
and for enhancing student 3-D spatial visualization
a virtual environment. Prior studies report that VR
skills.
is especially effective when students use VR tools
One way to enhance students’ ability to
to create virtual objects, rather than to just look at
visualize 3-D objects is to make their experience
objects or worlds which have already been created
of the objects as realistic as possible while
(Byrne et al., 1994). The new learning paradigm
learning. Recently, virtual reality has brought
could create a dramatic benefit for all students,
learners closer to a natural learning environment.
particularly for visual learners.
VR immerses viewers in computer-generated stereoscopic
environments.
Using
Using new technology in education can both
special
improve learning and make learning more
equipment such as data gloves and joysticks, users
enjoyable. Some prior studies showed that VR
can interact directly, and more realistically, with
appears to improve student motivation (Byrne et
virtual models in a virtual environment.
al., 1994; Sulbaran & Baker, 2000). In one study,
In industry, VR has proven to be an effective
82% of learners rated a VR learning environment
tool for worker training and helping designers
more engaging than learning from reading books
evaluate product designs. For example, GE
or lectures with overheads containing graphics or
Corporation used VR to determine part removal
pictures (Sulbaran & Baker, 2000). At the same
paths for machine maintenance (Abshire &
time, new technologies demand critical evaluation
Barron, 1998). Motorola developed a VR system
to determine their proper and vital role in
for training workers to run a pager assembly line,
transforming educational styles. For example, due
and they discovered that participants trained in VR
to
environments perform better on the job than those
multimedia now provides greater flexibility in
trained for the same time in real environments
teaching and learning.
(Wittenberg, 1995).
advances
Although
in
prior
information
short-term
technology,
experimental
In academia, the potential of VR has
programs conclude strongly that VR can enhance
especially drawn the interest of mathematics and
learning, educators still must overcome several
science educators. Several prior experiments have
technological and educational challenges to bring
shown that VR can help students understand
VR into regular classroom use: •
abstract spatial data and scenes that cannot be physically
realized
(Bell
&
Fogler,
1997;
When, where, and how should we introduce VR into existing curricula?
Haufmann, Schmalstieg & Wagner, 2000; Winn &
•
How can VR be used as a communication
Bricken, 1992). VR can also improve users’
tool, rather than just a visual aid, in the
visualization skills (Osberg, 1997). In contrast to
classroom?
3
•
How should we teach students to use VR
Inventor does not have VR display capability,
tools?
Inventor CAD models were converted to file formats that VRCADViewer could recognize, for
Introducing new technology into classrooms
example, .3ds, .osg, .wrl, and .iv.
also brings in the requirement for course reformation. This paper describes a teaching and
Participating instructors were invited to attend
learning experience in which VR tools were
each other’s classes to provide peer-observations.
introduced into design and technical graphics
Several curriculum and instruction experts were
courses at three educational institutions. In
also invited to each class to provide feedback
particular, findings are presented that show how
concerning instructional delivery and pedagogical
the implementation of VR technology affected and
practices.
changed pedagogical practices between instructors
In the first test class, held at the four-year
and students in classrooms at the three educational
university, basic information concerning 3D
institutions.
provide
engineering graphics was introduced. Example 3D
insights into how to use VR technology in design
models, corresponding to printed images from the
and technical graphics education, which can help
course textbook, were used to present the
instructors effectively introduce the new VR tools
concepts. Rather than using traditional CAD
in their classrooms.
model viewing methods, the new VR tool was
Implementation
findings
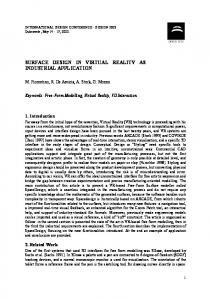
used to help students visualize 3D models from different views (Figure 1). After the students
II. Implementation
acquired 3-D spatial concepts, they were asked to
The project was a collaborative effort, which involved two community colleges and one four-
sketch projection views of the models.
year
Immediately
university.
A
VR
software
tool,
following
the
test
class,
the
VRCADViewer, was developed using open source
curriculum and instruction experts held a meeting
software
OpenSceneGraph
to discuss their experiences and to develop
(www.openscenegraph.org). VRCADViewer can
recommendations for improving instructional
create and separate left-eye and right-eye images
delivery and pedagogical practices. The team of
of a CAD model, so that the model can be viewed
experts recommended using virtual models for
stereoscopically.
participating
real-world mechanical parts for instruction, rather
instructors developed instructional VR models for
than less-meaningful models from the textbook.
topics they planned to cover in their classes. For
They also recommended allowing students to
this project Autodesk Inventor was used for CAD
create
model creation, because all three participating
recommendations were followed for a second test
institutions already owned the Autodesk Inventor
class.
from
Each
of
the
CAD software tool. However, since Autodesk
4
and
manipulate
models.
Both
(a)
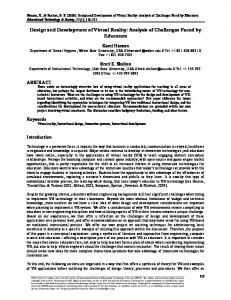
Figure 2. Second test class. Using conventional 2D viewing methods, most students struggle to grasp the true shape of the surface line. The VR tool gave a better spatial realization of the objects and what the surface line actually looked like in 3D space.
(b)
In the fourth test class, held at the second
Figure 1. First test class.
community college, the instructor covered using Visual Basic programs to drive a CAD software
In the second test class, the concept of pictorial views was covered. Students were invited
tool
to
create
generic
geometric
forms
to personally manipulate models and to explore
representing mechanical parts. First, students were
the models from different views (Figure 2). Real-
asked to develop a program that would produce a
world mechanical parts, with more complex
cylinder and a sphere with specific dimensions.
geometries and moving parts, were used. Students
They were then asked to verify their results
involved in the test classes made positive
against a VR model. Next, they were asked to
comments about using the VR equipment during
modify their programs to make the center of the
lectures.
sphere coincident with the center of the cylinder.
In the third test class, held at one of the
Again, students used a VR model to verify that the
community colleges, descriptive geometry was
output met their expectations. Finally, students
covered. The instructor explained how to find and
were asked to visualize shortening the cylinder by
draw a surface line that represents the intersection
a specific amount and to produce the change by
of two cones. The instructor first used a
editing their programs. After their programs
SMARTBoard™ to explain the concept using 2D
produced the change, they were again asked to
sketches (Figure 3(a)). He then used the VR tool
examine a virtual model and to compare their
to show the 3D relationship between the two cones
results with their expectations.
(Figure 3(b)).
5
(a)
Figure 4. Fourth test class. III. Classroom Impacts and Pedagogical Change The most obvious impact that using VR technology had in the test classes was increased student motivation. Students appeared to be
(b)
excited about using a new technology, which
Figure 3. Third test class
previously was not available in the classrooms. The purpose of the learning exercise in the
Within the first few minutes of using the VR tool,
fourth test class had two goals: (1) to enhance
students often made comments that they were
logical thinking and design processes through
either surprised about or felt affirmed in their
programming, (2) to use a 3D virtual model to
expectations by what they were seeing. A handful
verify and illustrate the results of logical thinking
of students made casual comments comparing
and design processes, and (3) to begin to develop a
what they were seeing to video games they used at
visual and conceptual ‘sense’ for the effects of
home. The correlation was interesting, because it
change in both the local and global state of a
indicated that students were attempting to adapt to
component’s form. All three goals rest upon the
a new instructional technique by relating their
precept that students, when offered a model with
classroom experience to a familiar personal
which to compare their own concepts, will
experience. They were attempting to create a zone
develop a sense of how change creates impact on a
of comfort by drawing on what they saw to a
design. After the first change exercise, students
similar technology that they had already used.
were led through a full series of model changes
Students’ engagement with their instructors
and given an opportunity to compare their
and other students increased, due to several
‘mental’ expectations against a virtual model
factors. The first factor was a significantly shorter
illustrating the change impact.
mental feedback cycle. Students could produce a model and see the result using the VR tool. As a result, they had a realistic virtual 3-D product that
6
IV. Evaluation Instruments
was similar to a real object that they could hold in their hands. Their minds were no longer forced to
To assess students’ VR experiences and
mentally convert 2-D images into mental 3-D
learning gains, several evaluation instruments,
scenes, before they could develop and accurate
such as a student survey, focus group interviews, a
concept of an object’s shape and dimensions.
VR literacy test, and a mental rotation test were
Instead, they had a virtual product right in front of
developed and conducted.
their eyes.
Student survey
A second factor which had an impact on
A survey was used to examine students’
classroom interaction was that students appeared
perceptions of the effectiveness of using VR in the
to accept the technology as an instructional tool
course curricula, as well as to investigate issues
rather than as a tool for critiquing their work.
related to physical comfort associated with VR.
Students who were normally reticent about sharing
Students were asked how many years of graphics
their CAD drawings with other students seemed
experience they had, including school and/or
more willing to share their models and images. On
work, and what their previous experiences were
the surface, it seems that one reason for the change
with graphics software programs. The survey
in classroom behavior was that, since the
items were developed based upon prior published
technology was new to the classroom, most
research findings. For example, the following
students felt they were on equal footing; they were
survey items:
all embarking on a journey together. As a side
(a) I considered dropping out of the program;
point,
(b) My instructor encouraged me not to major
students
may
also
have
felt
more
comfortable sharing virtual models because they
in CAD;
generally require less explanation than 2-D
were based on prior research by McKim (1980),
drawings.
Norman (1994), and Pleck et al. (1990), which
Virtual models also created a stronger
demonstrates that student 3-D visualization ability
connection between instructors and students, since
greatly influences students’ future career success
they were able to explore ‘what-if’ scenarios
in science, engineering, and technology.
together. The instructors and students, for the first
Research by Bishop (1973), Gagnon (1985),
time, were able to share a common ‘mindspace’
and McKim (1980) found that visualization is a
together as they proposed changes and saw the
skill that can be learned, developed, and improved
immediate impact of the changes. Receiving
with instruction. The survey items based on their
immediate virtual results allowed instructors to
findings include:
use
even
faulty
expectations
as
teachable
(a) The class improved the way that I learn;
moments.
(b) The
course
improved
communication skills.
7
my
graphics
Osberg (1997) found that a 3-D class
(b) VR helped me better remember how to do
culminating in a virtual experience can enhance
something again the next time I used it.
spatial processing skills, and Winn and Bricken
Survey items also were worded in the opposite
(1992) found that VR has the potential for making
vernacular to determine the consistency of
a significant improvement in the way students
responses, for example, (a) The VR program was
learn [mathematics]. The survey items based on
dull and uninteresting and (b) The VR was not
their findings include:
easy to understand.
(a) I
gained
confidence
in
my
Focus groups
3-D
visualization skills in this course;
Focus groups were conducted to probe for a
(b) My 3-D spatial visualization skills
deeper understanding about students’ experiences
improved as a result of this course.
with the VR technology in the classroom. Focus
Haufmann, Schmalsteig, and Wagner (2000)
groups were conducted with the participating
found that VR is a very good playground for
classes from the university and two community
experiments. In their study, all participants wanted
colleges after students completed the post-mental
to experience VR again, and students thought it
rotation test (MRT) and the survey. Focus group
was easier to view a 3-D world in VR than on a
protocol was implemented and topics were
flat screen. The survey items based on their
explored in more depth through a variety of
findings include:
questions such as:
(a) VR is a good playground for experiments;
(a) How was your experience in this class
(b) I want to experience VR again;
different using the VR tool than in classes
(c) It is easier to view a 3-D world in VR than
that did not use it?
on a flat computer screen.
(b) What do you believe the strengths are of
Sulbaran and Baker (2000) found that learners
using the VR tool?
thought learning with VR was more engaging than
Focus group responses from each class were
learning from reading books and listening to
recorded and then analyzed according to the
lectures using overheads containing graphics or
questions posed during the focus group. The
pictures and that in a follow-up survey, learners
responses were then analyzed and compared to
strongly agreed or agreed that their learning
determine thematic relationships, if any.
experiences benefit from the use of VR. The
Visual literacy tests and mental rotation tests
survey items based on their findings include:
In order to examine students’ conceptual
(a) Learning with VR is more engaging than
growth and changes in their knowledge base about
learning from reading books and listening
VR, pre- and post- visual literacy tests were
to lectures using overheads containing
developed. A mental rotation test was used to
graphics or pictures;
assess students’ growth in spatial visualization
8
over the course of the semester. The mental
and was exciting. Weaknesses reported by
rotation test was drawn from Vandenberg and
students included expense, size of equipment,
Kuse (1978).
needed better resolution, difficult to work with, lag time and inconsistency of the program, more V. Evaluation Results
time consuming, some people not being able to
Student survey
see the stereoscopic view, location not mobile,
Demographics A total of 8 females and 30 males
dizziness and sickness as a result of viewing the
from the three institutions participated in the
VR models.
student survey. Students ranged in age from 18-
Q: Please describe your previous experience
57. Nineteen students were freshman, 11 students
using VR and provide detailed examples.
were sophomores, 5 students were juniors, 1
Previous experiences using VR cited by
student was a senior, and 2 students identified
students included Disneyland, CAVE, and one
themselves as other.
student who was epileptic and could not wear the
Students’ graphics experience
3D eyewear or participate in the VR experience
Students’ years
of graphics experience ranged from 0 to 8 years.
because of the physical condition. Eight students
Open-ended questions
had never used VR before and it was their first
Students were asked to
respond to 3 open-ended questions.
Overall,
experience with the technology.
responses to the questions were positive. The
Student survey results and existing research
questions, with a summary statement, follow.
findings
Survey results from the three
Q: Describe the ways in which you found the
institutions support existing research findings. A
VR models effective for your learning and
Likert scale was used for the survey, with 1 =
provide examples
strongly agree, 2 = agree, 3 = undecided, 4 = disagree, and 5 = strongly disagree. Table 1 details
Students’ responses described their learning
the aggregate means for survey items.
experience with the VR models as fun, more realistic, engaging them in their learning, and
The results of the survey show that students agreed or strongly agreed that the course
providing them with visualization enhancements. Q: Describe two major strengths and two
improved their graphics communication skills;
major weaknesses of the VR models and
students agreed that they gained confidence in
give examples for each.
their 3-D visualization skills in the courses;
Students’ described the strengths of the VR
students agreed or strongly agreed that VR is a
models as realistic, good for visualization, easy to
good playground for experiments and that they
understand, retained attention, made learning fun,
wanted to experience VR again; students agreed
gave ability to rotate objects and parts, improved
or strongly agreed that learning with VR is more
depth perception, created better understanding,
engaging than learning from reading books and
9
Table 1. Aggregate means for common survey items.1
Survey Items The course improved my ability to design products. The course improved my problem-solving ability. The course improved my presentation skills. The course improved my graphics communication skills. I considered dropping out of the program. My instructor encouraged me not to major in CAD. I gained confidence in my 3-D visualization skills in this course. I enjoyed the 3-D instruction in this course. I was fully engaged in the instruction in this course. This method of delivering graphics concepts is the most effective. My experiencing of the 3-D objects was realistic. The class stimulated my interest in leading-edge technology. The class improved the way that I learn. VR is a good playground for experiments. I want to experience VR again. It is easier to view a 3-D world in VR than on a flat computer screen. Learning with VR is more engaging than learning from reading books and listening to lectures using overheads containing graphics or pictures. VR helped me better remember how to do something again the next time I used it. VR technology is a useful tool for design and technical graphics education. I can now use VR technology in product design. My 3-D spatial visualization skills improved as a result of this course. The instructional materials for this course were clear. The instructional materials for this course contributed to my learning. The VR is easy to use. The VR program is user-friendly. I believe that I could learn more in other subjects if VR programs like this one were available. The VR program was dull and uninteresting. The VR was not easy to understand I could not clearly understand the material presented in VR. I prefer to learn multi-view projections using 2-D pictures rather than VR 3-D simulation. Viewing the VR model makes me feel dizzy. I cannot see the stereoscopic view of the VR model. I feel physically uncomfortable when using VR. Using VR makes my eyes hurt.
1
Scale: 1=strongly agree, 2=agree, 3=-undecided, 4=disagree, 5=strongly disagree
10
Aggregate Mean (n=38) 1.83 2.03 2.47 1.90 4.50 4.43 2.00 1.73 2.03 2.23 1.93 2.00 2.33 1.73 1.67 2.13 1.83 2.50 1.90 2.77 2.20 2.17 2.10 2.33 2.53 2.20 4.03 3.77 3.77 3.53 3.77 3.93 4.03 4.00
listening to lectures using overheads containing
they did not have access to it for product design
graphics or pictures. Further, students from the
for their assignments or projects. They all were
three institutions disagreed with the item, “The
cognizant that their access to and experience with
VR program was dull and uninteresting,”
VR over the course of the semester was primarily
(mean=4.03).
as a visual aid by the instructor. Some students
Focus Groups
speculated on the usefulness of VR for product
Focus groups were conducted to probe for a
design and others interchanged the idea of VR
deeper understanding about students’ experiences
with 3D modeling software.
with the VR technology in the classroom. A total
Q: Do you feel that you are now a better
of five focus groups were conducted, which
candidate to join the workforce because of
involved students enrolled in classes at the three
your experiences using VR technology?
institutions. Consistent focus group protocol was
Limited experience with and exposure to VR
used for each focus group at the participating sites.
was again the prominent factor in students’
The questions posed to students during the focus
responses. Students’ frames of references were
group follow with a summary statement for each
primarily to the different software programs they
question.
learned during the semester, however, some
Q: How was your experience in this class
students saw the value of VR’s use to their future
different using the VR tool than in classes
in the workforce.
that did not use it?
Q: What do you believe the strengths are of
All students stated that the use of the VR tool
using the VR equipment/technology?
in their classes was a positive experience. All
Students identified visualization, the ability to
students reported that the use of VR in their
manipulate and rotate objects, the depth and
classrooms was primarily in the form of a visual
perspective created through the use of VR, and
aid by the instructor, but unfortunately, they did
advantages for product design as strengths of the
not have access to the technology or equipment on
VR
their desktop computers for their own use. Several
infrequency of use, no hands-on experience, and
students mentioned that the use of the VR
lack of exposure to VR as obstacles to providing a
equipment by their instructors enhanced their
completely informed response.
ability to visualize models and that it made the
Results for pre- and post-visual literacy tests
experience more realistic.
equipment/technology.
Students
cited
In order to examine students’ conceptual
Q: Are you now able to use VR tools in
growth and changes in their knowledge base about
product design?
VR, pre- and post-visual literacy tests were
Because the students did not have the VR
developed. The test used includes 50 items,
capability on their desktop computers in class,
weighted at 2 points each, for a total of 100 points.
11
Twenty-five students took the pre-visual
instructors were all open to providing more
literacy test. Students’ scores ranged from a low
opportunities for students to gain hands-on
of 18 out of 100 to a high of 66 out of 100, with a
experience with the VR tool, as recommended by
mean score of 39.00. Post-test scores ranged from
the curriculum and instruction experts. To provide
a low of 28 out of 100 to a high of 70 out of 100,
more hands-on opportunities, the instructors
with a mean score of 52.96. The mean increase
suggested developing an independent lab, separate
for the students was 14.23%.
from
Results for pre- and post-mental rotation tests
classroom facilities, where students could work
the
instructors’
computers
and
their
A mental rotation test was used to assess
with their design models and then bring them into
students’ growth in spatial visualization over the
a VR environment. To connect use of the VR tool
course of the semester. Twenty-nine students took
with authentic meaningful activities for the
the pre- and post-MRT tests. Pre-test MRT scores
students, it is important to invite representatives
ranged from a low of 2 to a high of 34. Post-test
from industry, who are currently using VR in for
MRT scores ranged from a low of 6 to a high of
product testing and development, to speak with the
39. The mean for the pre-MRT test was 17.69,
students and to demonstrate possibilities for use of
and the mean for the post-MRT test was 24.17.
similar VR tools in the business world.
VI. Discussion
VII. Future Directions
All instructors and students were enthusiastic
For the given study, typically, students were
about using the VR tool in their classrooms. The
usually in a passive role, however, they expressed
use of VR models was connected to overall
interest in more hands-on opportunities for
curricula taught in the classes. Thus, the use of VR
working with the software. The instructors need to
models seemed to have a purpose, and was not just
redesign their existing lectures and labs to provide
an add-on to the lessons. Students seemed more
more
engaged in collaborative groups formed to solve
students, opportunities that will give them more
problems during the lessons.
control over their own learning and that will create
Primary suggestions made by the curriculum and
instruction
opportunities
for
a cognitively active learning environment. The course contents need to include more problem-
opportunities for students to have more hands-on
based learning lessons using VR. Integrating VR
experiences with the VR tools, increasing student
in the classroom, beyond using VR as a visual aid
group activity, increasing opportunities for student
during lectures, needs to be studied. Applying VR
to manipulate the VR models, and increasing
in other courses will also be explored.
engagement
included
interactive
providing
student
experts
hands-on
during
class
sessions.
To shift students from a passive role to a more
Evaluation results confirmed the suggestions. The
active role, students need to explore current uses
12
Communications and Technology Journal, 33 (4), 263-275.
of VR in their particular areas of interest. Students also need to learn how to use VR to evaluate other students’ designs. Finally, further research is
Haufmann, H., Schmalstieg, D. & Wagner M. (2000). Construct3D: A Virtual Reality Application for Mathematics and Geometry Education, Education and Information Technologies, 5 (4), 263-276.
needed to determine how the VR tool affects students’ engagement in the subject matter and changes that can be made in both software design and in pedagogical methods to make the tool more
McKim, R. H. (1980). Experiences in visual thinking, Boston, MA:PWS Publishers.
useful and available to students, at a level comparable to other multimedia tools now used in
Norman, K. L. (1994). Spatial visualization – A gateway to computer-based technology, Journal of Special Educational Technology, XII (3), 195-206.
education. Acknowledgements
Osberg, K. M. (1997). Spatial Cognition in the Virtual Environment. Human Interface Technology Laboratory, University of Washington, Retrieved June 10, 2002, from http://www.hitl.washington.edu/publications/r-9718/.
Support for this work, Grant 0302832 from the National Science Foundation and Grant 0404 from the Iowa Science Foundation, is greatly appreciated. VIII. References
Pleck, M. H., Mcgrath, M. B., Bertoline, G. R., Browers, D. H. & Sadowski, M. A. (1990). Factors affecting the engineering design graphics curriculum: Past, present, future. Proceedings of the NSF Symposium on Modernization of the Engineering Design Graphics Curriculum, Austin, Texas, 43-52.
Abshire, K. J. & Barron, M. K. (1998). Virtual maintenance; Real-world applications within virtual environments, IEEE Proceedings Annual Reliability and Maintainability Symposium, 132137. Bell, J. T. & Fogler, H. S. (1997). Ten steps to developing virtual reality applications for engineering education, Proceedings of the 1997 ASEE Annual Conference, Retrieved February 15, 2002, from http://www.vrupl.evl.uic.edu/vrichel/.
Sulbaran, T. & Baker, N. C. (2000). Enhancing Engineering Education Through Distributed Virtual Reality, 30th ASEE/IEEE frontiers in Education Conference, October 18-21, Kansas City, MO, S1D-13 – S1D-18.
Bishop, A. J. (1973). The use of structural apparatus and spatial ability – A possible relationship, Research in Education, 9, 4-49.
Vandenberg, S. G. & Kuse, A. R. (1978). Mental rotations, a group test of three-dimensional spatial visualization, Perceptual and Motor Skills, 47, 599-604.
Byrne, C., Holland, C., Moffit, D., Hodas, S. & Furness, T. A. (1994). Virtual Reality and "At Risk" Students, Retrieved June 15, 2002, from http://www.hitl.washington.edu/publications/r-945/.
Winn, W. & Bricken, W. (1992, December). Designing Virtual Worlds for Use in Mathematics Education: The Example of Experiential Algebra, Educational Technology, 32 (12), 12-19. Wittenberg, G. (1995). Training with virtual reality, Assembly Automation, 15 (3), 12-14.
Gagnon, D. (1985). Videogames and spatial skills: An exploratory study, Educational
13


![[PDF] Emerging Tools and Applications of Virtual Reality in Education ...](https://m.moam.info/img/260x300/pdf-emerging-tools-and-applications-of-virtual-rea_647771c7097c474b228c150a.jpg)