V3PM: A Decision Support Tool for Value-based Process Project Portfolio Management by Martin Lehnert, Alexander Linhart, Jonas Manderscheid, Marius Svechla 1
in: Proceedings of the 24th European Conference on Information Systems (ECIS), Istanbul, Turkey, June 2016, p. 1-10
1
At the time of writing this paper, Marius Svechla was a student assistant at the Research Center Finance & Information Management and the Department of Information Systems Engineering & Financial Management, University of Augsburg
WI-544
University of Augsburg, D-86135 Augsburg Visitors: Universitätsstr. 12, 86159 Augsburg Phone: +49 821 598-4801 (Fax: -4899) University of Bayreuth, D-95440 Bayreuth Visitors: Wittelsbacherring 10, 95444 Bayreuth Phone: +49 921 55-4710 (Fax: -844710) www.fim-rc.de
V3PM: A DECISION SUPPORT TOOL FOR VALUE-BASED PROCESS PROJECT PORTFOLIO MANAGEMENT Prototype Lehnert, Martin, FIM Research Center, University of Augsburg, Universitaetsstrasse 12, 86159 Augsburg, Germany,
[email protected] Linhart, Alexander, FIM Research Center, University of Augsburg, Universitaetsstrasse 12, 86159 Augsburg, Germany,
[email protected] Manderscheid, Jonas, FIM Research Center, University of Augsburg, Universitaetsstrasse 12, 86159 Augsburg, Germany,
[email protected] Svechla, Marius, FIM Research Center, University of Augsburg, Universitaetsstrasse 12, 86159 Augsburg, Germany,
[email protected]
Abstract In the context of Business Process Management (BPM), organizations strive to develop their BPM capabilitiy and to improve their individual business processes in an integrated manner. Planning models assist in selecting and ordering implementable BPM- and process-level projects maximizing the firm value, catering for the projects’ effects on process performance and for interactions among projects. To facilitate process managers for calculating scenarios of non-trivial complexity, the Value Based Process Project Portfolio Management (V3PM) tool has been developed. The V3PM tool is a stand-alone program that effectively and efficiently selects one project portfolio for which the net present value takes the highest value. It is designed to fulfil a twofold objective: the scientific perspective in terms of an adequate evaluation for existing design science research artefacts as well as the user’s point of view in terms of a first step towards a full-featured version for decision support in daily business operations. In this paper, we describe the application’s architecture focusing on the data management, the roadmap engine and the graphical user interface. Deeper insights into the functionality for creating and analyzing persistent problem sets highlight the strengths of the V3PM tool as well as its usefulness and practical applicability for decision support. Keywords: Business Process Improvement, Process-Decision Making, Project Portfolio Management, Business Process Management
1 Introduction 1.1
Status Quo of Decision Support for Process Improvement
Process orientation is an accepted paradigm of organizational design (Kohlbacher and Reijers, 2013). Due to constant attention from industry and academia, the business process management (BPM) community has developed mature approaches, methods, and tools that, for instance, support process improvement (van der Aalst, 2013; Zellner, 2011). However, only few approaches give guidance on how to put process improvement into practice (Bandara et al., 2015; Shrestha et al., 2015; Ohlsson et al., 2014) mostly sharing a single process as unit of analysis and consequently neglecting interactions among multiple processes. At the same time, the BPM community has been and still is paying ever more attention to BPM itself and the development of organizations’ BPM capability (de Bruin and Rosemann, 2005; Poeppelbuss et al., 2015). Research mainly focuses on identifying and grouping the constituents
Twenty-Fourth European Conference on Information Systems (ECIS), İstanbul, Turkey, 2016
1
Lehnert et al. / The V3PM Tool
of BPM and developing related capability frameworks (de Bruin and Rosemann, 2007; Rosemann and vom Brocke, 2015; van Looy et al., 2012). Few guidance on how to develop an organization’s BPM capability from a theoretical, prescriptive perspective is available (Niehaves et al., 2014; Poeppelbuss et al., 2015). Consequently, there is a lack of approaches that assist organizations in selecting and ordering projects that improve multiple processes and organization’s BPM capability in an integrated manner to maximize the firm value, while catering for the projects’ effects on process performance and for interactions among projects. Against this background, we developed two planning models answering differing aspects with our prior research (Lehnert et al., 2014; Linhart et al., 2015). They help valuating so-called BPM roadmaps in line with the principles of project portfolio selection and value-based management. We define a BPM roadmap as a scheduled portfolio of projects an organization should implement. To identify the BPM roadmap that maximizes the company’s value, we calculate the BPM roadmaps’ net present value (NPV). The BPM roadmap with the highest NPV is the roadmap to be implemented. In Lehnert et al. (2014), we focus on improvement projects for process improvement and BPM capability development in an integrated manner. The planning model takes a multi-process, multi-project, and multi-period perspective while catering for the projects’ effects as well as for interactions among projects and processes. Due to the multi-process and multi-project focus, we analyze single processes only in terms of their performance indicators and exclude more detailed process characteristics. In Linhart et al. (2015), we examine how organizations should improve a distinct process via improvement projects with a particular focus on the characteristics of that process. We consider characteristics that capture how work is performed and organized. To restrict the set of admissible BPM roadmaps, this planning model introduces the specification of project-specific (e.g., earliest beginning), process-specific (e.g., critical boundaries for performance indicators), and period-specific constraints (e.g., available budget) that BPM roadmaps must not violate. Due to the single-process perspective, interactions among processes are excluded.
1.2
Need for new Prototype / Design Objectives
Multi-process, multi-project, and multi-period perspectives on process improvement lead to non-trivial complexity and call for a useful and easy-to-use decision support tool. Thus, we developed the Valuebased Process Project Portfolio Management (V3PM) tool enhancing the prototypes that resulted from our prior research on process improvement and project portfolio selection (Lehnert et al., 2014; Linhart et al., 2015). When developing the tool, we primarily focused on scientific rigour and practical applicability. Following design science research (DSR), our prior work resulted in planning models that comprise the identification of and motivation for the research problem, objectives of a solution, design, and development (cf. Peffers et al., 2007). However, to complete the DSR process, an adequate evaluation of the DSR artefacts that solve the observed problem (e.g., constructs, models, methods, and instantiations; see Hevner et al., 2004) is necessary (cf. March and Storey, 2008; Sonnenberg and vom Brocke, 2012). As result, the design objectives of the V3PM tool focus on the ex post evaluation activities according to the evaluation framework of Sonnenberg and vom Brocke (2012). The V3PM tool is used both for incorporating a proof of concept (EVAL3) and for preparing an application in naturalistic settings to validate its usefulness (EVAL4). Thus, we need an adequate user interface and have to overcome various shortcomings of the existing prototypes. Since no external requirements exist, we focus on internal quality and quality in use as specified in the evaluation criteria of DSR artefacts (Sonnenberg and vom Brocke, 2012) and the quality requirements of systems and software quality (ISO/IEC 25010). Further, we intended to merge the scientific insights of our distinct research streams in one single application. The V3PM tool at its current stage should only be a first step towards a full-featured decision support tool applicable in daily business operations (e.g. from production or service industry). The V3PM tool was designed as executable program that effectively and efficiently generates all admissible BPM roadmaps, applies the objective function to each admissible roadmap to calculate the NPV, and selects the roadmap which the highest NPV. The V3PM tool was designed to consider the multiprocess perspective as well as all improvement effects of Lehnert et al. (2014) in combination with multi-period projects and the integration of constraints as shown in Linhart et al. (2015). Further, an
Twenty-Fourth European Conference on Information Systems (ECIS), İstanbul,Turkey, 2016
2
Lehnert et al. / The V3PM Tool
almost unlimited number of projects and processes should be feasible. In view of the necessary performance, we decided for a new software architecture, e.g. persistent and fast data management, as well as for new algorithms, e.g. for a more efficient roadmap generation minimizing existing bottlenecks and providing modularity according to the maintainability. In order to improve usability and satisfaction, a graphical user interface (GUI) just as analysis and visualization functionalities were integrated. We introduced the concept of scenarios to allow the examination of different persistent problem sets based on the combinations of projects and processes. They were designed to simplify data in- and output and to prevent errors. A focussed provision of information as well as in-depth insights in terms of sensitivity analyses improve the decision support.
1.3
The Architecture
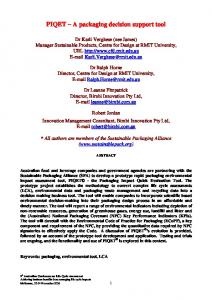
The V3PM tool is an executable program mainly relying on Java. Its implementation follows a typical 3-tier architecture dividing presentation, business logic and data storage into independent modules due to the modularity and maintainability requirements (Fowler, 2002). Figure 1 shows the different components: the data collection, the roadmap generation, the roadmap calculation, and the analysis functionalities. The data collection and the analysis functionalities belong to the presentation tier as frontend that consists of multiple GUI components. Therefore, we used the toolkit JavaFX and the related open source project ControlsFX as well as the third party library GraphStream that provide a lot of visualization features needed for the analysis functionalities, particularly for charts and dynamic graphs. The roadmap generation and calculation are part of the business logic. The business logic and the data storage tier represent the back-end of the application. They implement the insights of the decision model as well as database connections for reading and writing data to a persistent storage. The communication across the different layers is performed via defined interfaces. Despite the typical representation of a 3tier architecture, we first outline the business logic tier (section 2) as it is the implementation of our planning models and the core of the V3PM tool. We then introduce the presentation layer (section 3) to highlight the extension of the roadmap calculation in terms of analysis and visualization functionalities.
Figure 1.
The components of the business logic
2 The Business Logic and the Back-end Side The business logic tier contains multiple algorithms for the generation, calculation, and analysis of BPM roadmaps considering the projects’ effects on process performance and for interactions among projects. The data collection provides the input data in terms of distinct scenarios. Each scenario consists of multiple projects and processes. Each project has specific performance effects that influence one or more processes from the process set. Further a constraint set (e.g., for interactions among projects) and general settings (e.g., the risk-adjusted interest rate) are part of a scenario. For each scenario, the roadmap generator evaluates the potential process and project combinations. The NPV calculator applies the objective function to them resulting in the NPV and additional variables for further in-depth analyses, e.g. scenario analyses, provided by the analysis functionalities. The constraint checker ensures considering only admissible BPM roadmaps during the generation and calculation. The parts of the business logic that happen before the roadmap calculation demonstrate the most significant differences and improvements compared to the existing prototypes at the back-end side. In the following, we focus on the algorithms of the roadmap generator with particular regard to the performance features and present the prototype’s data management functionalities. The scenario component is part of the data management as well as the GUI components in the front-end section.
Twenty-Fourth European Conference on Information Systems (ECIS), İstanbul,Turkey, 2016
3
Lehnert et al. / The V3PM Tool
2.1
Constraint-based Roadmap Generation
The roadmap generation based on the user-defined project sets mainly generates lexicographical permutations (Knuth, 2011) in a broader sense. Difficulties arise from the multi-period perspective and the opportunity not to implement any project within distinct periods. Both are not captured by existing java libraries (e.g., org.paukov.combinatoricslib, com.google.common.collect.Collections2). Thus, we designed a special form of the algorithm. We use containers based on ArrayList to record all periods considered for the implementation of a project as well as combinations of these to form the entire roadmaps. Figure 2 illustrates the roadmap generation including restriction handling in general and exemplifies the roadmap generation considering three potential process improvement projects and a planning horizon of three periods without restrictions. The implementation of project 1 would take one period, for project 2 it would take two periods and for project 3 it would take three periods. The available capacity within the organization allows for two project implementations in parallel.
Figure 2.
Roadmap Generation and Restriction Handling
First, the algorithm generates the containers for each single project of the project set. A container includes all possible project schedules due to project duration and planning horizon. In our example, we get three containers. These are the basis for the following combinations. Each cycle forms further containers as Cartesian product of two containers generated beforehand. Finally, recombination leads to 𝑛 ∑𝑛𝑘=1 ( ) containers (with n = number of projects) and an even larger amount of roadmaps. A tracking 𝑘 mechanism hinders double combinations of containers. However, not all generated unique roadmaps are admissible due to given constraints, e.g. for organizational, content-related, or regulatory reasons (Linhart et al., 2015). This can be assured by incorporating a constraint check at multiple stages. Project-specific constraints, e.g. earliest beginning or latest completion, can be checked during the generation of the creation. Interactions among projects, e.g. predecessor-successor-relationship, have to be examined afterwards. Unfortunately, the stepwise design of roadmap generation hinders the allocation of some constraints to earlier stages and gives room for further improvements. Nonetheless, the container design allows for fast constraint checks as the distinct included projects are known. Additionally, there is a further check for process- and period-specific constraints, e.g. quality boundaries or budget limits, included in the NPV calculation (see Figure 3). Nonetheless, the generation and calculation algorithms have to cope nearly an infinite number of BPM roadmaps. A naturalistic setting including four processes, nine projects, and a planning horizon of five periods that we derived from expert interviews led to 2,7 million potential and, at least, approximately 250,000 admissible roadmaps. To facilitate the needed high throughput in terms of performance as in-
Twenty-Fourth European Conference on Information Systems (ECIS), İstanbul,Turkey, 2016
4
Lehnert et al. / The V3PM Tool
tended in the design objectives, we incorporated a concurrency concept based on the javafx.concurrent package. Following this, multiple threads are performed asynchronously or in parallel while updating the user interface, generating roadmaps and calculating the NPVs.
Figure 3.
2.2
Roadmap Calculation
The Data Management
The design decisions towards the data management are in line with the performance and usability requirements. We use the database management system (DBMS) SQLite that is often used as the on-disk file format for desktop applications such as financial analysis tools. The DBMS offers high performance, reliability, and security in terms of ISO/IEC 25010 including efficient data access and data integrity (Ramakrishnan and Gehrke, 2003). Due to the sophisticated techniques to store and retrieve the (intermediate) results efficiently, the essential part of computing time remains content-related depending on the planning model, e.g. roadmap generation or NPV calculation, and less affected by the technical environment. Further, based on the DBMS, we were able to introduce a relational data model that provides more usability and flexibility via reuse of data. Once processes and projects have been created, they can be combined in any way for new scenarios whereas constraints are specific for each scenario. Further, the scenario component allows to store different problem instances which can be re-opened, copied, and modified for determining the effect of slight changes on distinct scenarios at any point in time. As data does not have to be entered every time, we expect that the user experience increases.
3 Front-end and Functionality of the V3PM Tool While the concept of the back-end side aims at the product quality, the concept of the front-end side has a strong focus on quality in use (ISO/IEC 25010). A well-structured GUI (Figure 4) just as selected analysis functionalities assure quality by usability and satisfaction.
Figure 4.
3.1
GUI Navigation Model
The Graphical User Interface (GUI)
The GUI gives a very compact and clean design. The start screen (Figure 5) as the center of the application provides an overview of the projects, processes, and scenarios. From here, all functions of the
Twenty-Fourth European Conference on Information Systems (ECIS), İstanbul,Turkey, 2016
5
Lehnert et al. / The V3PM Tool
V3PM tool can be reached. As shown in Figure 4, the navigation model follows two approaches that differ optically as well as technically.
Figure 5.
Start Screen as Overview
Dialogs that open in a new window enable the gathering of further input data (Figure 6). The provided data entry fields change dynamically due to the selected project type. In case of scenarios, the input is a combination of projects and processes in addition to the information about the interactions and constraints to be considered as well as the general settings (e.g., risk-adjusted interest rate, number of periods in the planning horizon). Here, the GUI also provides usability features in terms of product quality. As it uses referential integrity for error protection, the mapping of projects and processes is only possible for those that have already been created. For the results of the NPV calculation, additional tabs show detailed scenario information. Whereas the dialogs are only visible for a certain time until the input is finished, the tabs remain open for analysis purposes until the user finishes.
Figure 6.
3.2
Definition of new processes or projects
Analysis functionality
Once calculated, the V3PM tool provides detailed information about a scenario. While the back-end design and the GUI mainly support the practical use of the planning model, the analysis section goes
Twenty-Fourth European Conference on Information Systems (ECIS), İstanbul,Turkey, 2016
6
Lehnert et al. / The V3PM Tool
beyond the model’s intention of determining the optimal BPM roadmap. Beside the visualization of the NPV calculation it enables to gain in-depth insights into the BPM roadmaps associated with a distinct scenario. According to the DSR evaluation criteria (Sonnenberg and vom Brocke, 2012) and with regard to well-informed decisions, this section extends our prior research providing comparisons between roadmaps and scenarios as well as sensitivity analyses to test the robustness of the calculated results. For each scenario analysis, the results of the respective optimal BPM roadmap are the starting point (Figure 7). An overview shows information about the scheduled project selection, the processes’ performance, the considered interactions and constraints as well as occurred violations while roadmap generation, just as the cash flow development. For better understanding, we choose different presentation forms and chart types. For example, the temporal development of the processes’ performance in terms of time, quality, operating outflows, and fixed outflows due to the implementation of projects is presented with line charts. The amount of restriction violations, in turn, is better reflected by a bar chart. Further, the overview includes a project-to-process relationship graph. It captures all interdependencies among processes and projects visually and can be examined interactively by the tool user. Concerning any other admissible roadmap, a list sorted by NPV in descending order allows access to the presented information. In addition, the scenario analysis is the entry for the comparison and sensitivity features.
Figure 7.
Scenario analysis section
The comparison section contains information about roadmaps themselves in terms of the selected projects and their order, about the performance parameters as well as the cash flow development. It represents the differences using selected graphic representations, as well. Comparisons are possible both between roadmaps and scenarios. For roadmaps, the user can compare any of the calculated admissible roadmaps. The scenario comparison considers the best roadmaps of the two selected scenarios and allows for variations in the process, project, and constraint sets. Therefore, it also provides information about the differences regarding the constraint violations. As the project selection just as the effects on time, quality, costs, and cash flows are visible, the comparison section helps to easily detect the impacts of various planning foundations (e.g., a change of a project’s position or varying budget targets) on the probable results in terms of intentional variations. The sensitivity analyses examine the consequences of random, unintentional variations in terms of estimation errors, as the planning model at hand is very complex. The model’s robustness should avoid a
Twenty-Fourth European Conference on Information Systems (ECIS), İstanbul,Turkey, 2016
7
Lehnert et al. / The V3PM Tool
situation where minor deviations would have major impact on the dominant BPM roadmap. Therefore, we integrated a robustness check to test how strongly the value contribution of the selected roadmap is affected by such variations. For the maximum 50,000 best BPM roadmaps, we vary all project-related input parameters ceteris paribus in a range of ±2% by steps of 1% and determine the percentage of cases in which the optimal BPM roadmap remains dominant compared to the other BPM roadmaps. Following the demonstration examples relying on discussions with our industry partners from the financial service industry (e.g., as described in Linhart et al., 2015), the robustness check confirmed that the calculated optimal BPM roadmap is robust in regard to estimation errors. Furthermore, the tool user may also refer to a project’s input parameter in all or any input parameter whether or not it depends to a process, a project, or the general setting to test the model’s robustness. He or she can define a finite interval as variation scope as well as the step width. Allowing for individual and flexible analyses, the user can specify relative or absolute adjustments and decide for positive, negative, or positive and negative interval boundaries in addition. For example, a step width of 5% and a positive boundary of 10% would result in two calculations, while in the first iteration the input value of the selected parameter is increased by 5% and in the second iteration by 10%. With this more detailed sensitivity analysis, the V3PM tool provides further insights to the major factors of influence from two perspectives. The user can investigate the role of a distinct project or the role of a project’s specific input parameter in relation to the NPV of an entire roadmap.
4 V3PM Evaluation & Discussion We introduced the V3PM tool to facilitate process managers for calculating scenarios of non-trivial complexity in a multi-project, multi-process and multi-period perspective on process improvement as well as on BPM capability development. We aimed to design a useful and easy-to-use decision support tool that effectively and efficiently calculates the NPV of quite a lot of BPM roadmaps derived from different scenarios. Besides the identification of the optimal BPM roadmap, we intended to use the tool and the results for analysis purposes. This could be realized by a 3-tier architecture with focus on a dynamic, information-rich GUI, appropriate back-end algorithms, and the use of a DBMS. First performance tests on regular work stations using artificial as well as real-world data already indicate the applicability of the tool in business environments. For example, the roadmap generation and NPV calculation of a case with four processes, nine projects and a planning horizon of five periods requires about half a minute. The robustness check takes about 3 minutes. Complexity drivers are the planning horizon and the amount of available projects. As planning horizons usually are rather small (i.e., between 2 and 8 according to our experiences) and only a limited selection of projects comply with organizational goals (Archer and Ghasemzadeh, 1999), both factors are uncritical. However, more information has to be gathered by real world application. For this, the GUI concept and the analysis functionalities were relevant and necessary steps as well as for the evaluation of our DSR artefact (EVAL3, EVAL4) in the sense of Sonnenberg and vom Brocke (2012). Besides the limitations grounded in the planning models (Lehnert et al., 2014; Linhart et al., 2015) as conceptual basis of the V3PM tool (e.g. projects that already started in an organization are excluded), there are still shortcomings towards the software quality (ISO/IEC 25010). We will consider further requirements of ISO/IEC 25010 (e.g. introducing a user concept for security reasons) when extending the functionalities to integrate additional aspect from our prior research. However, the V3PM tool was designed for evaluation purposes. Although we already discussed our results with organizations and could derive real world data as input, the V3PM tool is not yet operational in organizations. For instance, we have not yet tested the user interface with intended users. Thus, the V3PM tool needs further development to mature to a full-featured version for decision support in daily business operations. In addition, a comprehensive user documentation and a web-based, platform-independent tool are in preparation.
Twenty-Fourth European Conference on Information Systems (ECIS), İstanbul,Turkey, 2016
8
Lehnert et al. / The V3PM Tool
References Archer, N. and F. Ghasemzadeh (1999). “An integrated framework for project portfolio selection.” International Journal of Project Management 17 4, 207–216. Bandara, W., A. Guillemain and P. Coogans (2015). “Prioritizing Process Improvement: An Example from the Australian Financial Services Sector.” In: Handbook on Business Process Management 2. Ed. by J. vom Brocke and M. Rosemann. Berlin, Heidelberg: Springer, p. 289–307. de Bruin, T. and M. Rosemann (2005). “Towards a Business Process Management Maturity Model.” In: Proceedings of the Thirteenth European Conference on Information Systems (ECIS). Ed. by D. Bartmann, F. Rajola, J. Kallinikos, D. Avison, R. Winter, P. Ein-Dor, J. Becker, F. Bodendorf and C. Weinhardt, p. 1–12. de Bruin, T. and M. Rosemann (2007). “Using the Delphi technique to identify BPM capability areas.” In: Proceedings of the 18th Australasian Conference on Information Systems (ACIS), Paper 42. Fowler, M. (2002). Patterns of enterprise application architecture. Boston, Mass.: Addison-Wesley. Hevner, A. R., S. T. March, J. Park and S. Ram (2004). “Design Science in Information Systems Research.” 28 1, 75–105. Knuth, D. E. (2011). The art of computer programming: Combinatorial Algorithms, Part 1. 3. ed. Amsterdam: Addison-Wesley. Kohlbacher, M. and H. A. Reijers (2013). “The effects of process‐oriented organizational design on firm performance.” Business Process Management Journal 19 2, 245–262. Lehnert, M., A. Linhart and M. Röglinger (2014). “Chopping Down Trees vs. Sharpening the Axe – Balancing the Development of BPM Capabilities with Process Improvement.” In: Business Process Management. Ed. by S. Sadiq, P. Soffer and H. Völzer. Springer International Publishing, p. 151–167. Linhart, A., J. Manderscheid, M. Röglinger and H. Schlott (2015). “Process Improvement Roadmapping - How to Max Out Your Process.” In: Proceedings of the 36th International Conference on Information Systems. Ed. by T. Carte, A. Heinzl and C. Urquhart. Association for Information Systems. March, S. T. and V. C. Storey (2008). “Design science in the information systems discipline: An introduction to the special issue on design science research.” Management Information Systems Quarterly 32 4, 725–730. Niehaves, B., J. Poeppelbuss, R. Plattfaut and J. Becker (2014). “BPM capability development – a matter of contingencies.” Business Process Management Journal 20 1, 90–106. Ohlsson, J., S. Han, P. Johannesson, F. Carpenhall and L. Rusu (2014). “Prioritizing Business Processes Improvement Initiatives: The Seco Tools Case.” In: Advanced Information Systems Engineering. Ed. by Gerhard, M. Jarke, J. Mylopoulos, C. Quix, C. Rolland, Y. Manolopoulos, H. Mouratidis and J. Horkoff. Cham: Springer International Publishing, p. 256–270. Peffers, K., T. Tuunanen, M. A. Rothenberger and S. Chatterjee (2007). “A Design Science Research Methodology for Information Systems Research.” Journal of Management Information Systems 24 3, 45–77. Poeppelbuss, J., R. Plattfaut and B. Niehaves (2015). “How Do We Progress? An Exploration of Alternate Explanations for BPM Capability Development.” Communications of the Association for Information Systems 36 1. Ramakrishnan, R. and J. Gehrke (2003). Database management systems. 3rd Edition. Boston, Mass.: McGraw-Hill.
Twenty-Fourth European Conference on Information Systems (ECIS), İstanbul,Turkey, 2016
9
Lehnert et al. / The V3PM Tool
Rosemann, M. and J. vom Brocke (2015). “The Six Core Elements of Business Process Management.” In: Handbook on Business Process Management 1. Ed. by J. vom Brocke and M. Rosemann. Berlin, Heidelberg: Springer, p. 105–122. Shrestha, A., A. Cater-Steel, M. Toleman and W.-G. Tan (2015). “A Method to Select IT Service Management Processes for Improvement.” Journal of Information Technology Theory and Application 15 3. ISO/IEC 25010, 2011-03: Software engineering - Software product Quality Requirements and Evaluation (SQuaRE) - System and software quality models. Sonnenberg, C. and J. vom Brocke (2012). “Evaluation Patterns for Design Science Research Artefacts.” In: Practical Aspects of Design Science. Ed. by M. Helfert and B. Donnellan. Berlin, Heidelberg: Springer, p. 71–83. van der Aalst, W. M. (2013). “Business Process Management: A Comprehensive Survey.” ISRN Software Engineering Volume 2013. van Looy, A., M. D. Backer and G. Poels (2012). “A conceptual framework and classification of capability areas for business process maturity.” Enterprise Information Systems 8 2, 188–224. Zellner, G. (2011). “A structured evaluation of business process improvement approaches.” Business Process Management Journal 17 2, 203–237.
Twenty-Fourth European Conference on Information Systems (ECIS), İstanbul,Turkey, 2016
10