Revised manuscript Click here to download Manuscript: Lofstrom et al revised 27-09-2007.doc
1 2 3 4 5 6 7 8 9 10 11 12 13 14 15 16 17 18 19 20 21 22 23 24 25 26 27 28 29 30 31 32 33 34 35 36 37 38 39 40 41 42 43 44 45 46 47 48 49 50 51 52 53 54 55 56 57 58 59 60 61 62 63 64 65
Validation of a Diagnostic PCR Method for Routine Analysis of Salmonella spp. in Animal Feed Samples
Running head: Validation of PCR for Salmonella in feed
This article is published in: Food Analytical Methods, 2008, 1(1), 23-27 The original publication is available at www.springerlink.com
Charlotta Löfströma,b, Charlotta Engdahl Axelssonb and Peter Rådströma*
a
Applied Microbiology, Lund Institute of Technology, Lund University, P.O. Box 124,
SE-221 00 Lund, bLantmännen AnalyCen AB, P.O. Box 905, SE-531 19 Lidköping, Sweden
* Corresponding author. Mailing address: Applied Microbiology, Center for Chemistry and Chemical Engineering, Lund Institute of Technology, Lund University, P.O. Box 124, SE-221 00 Lund,
Sweden.
Phone:
+46
46
222
3412,
[email protected]
1
Fax:
+46
46
222
4203,
E-mail:
1 2 3 4 5 6 7 8 9 10 11 12 13 14 15 16 17 18 19 20 21 22 23 24 25 26 27 28 29 30 31 32 33 34 35 36 37 38 39 40 41 42 43 44 45 46 47 48 49 50 51 52 53 54 55 56 57 58 59 60 61 62 63 64 65
Abstract As a part of a validation study, a comparative study of a PCR method and the standard culturebased method NMKL-71, for detection of Salmonella, was performed according to the validation protocol from the Nordic validation organ for validation of alternative microbiological methods (NordVal) on 250 artificially or naturally contaminated animal feed samples. The PCR method is based on culture enrichment in buffered peptone water followed by PCR using the DNA polymerase Tth and an internal amplification control. No significant difference was found between the two methods. The relative accuracy, relative sensitivity and relative specificity were found to be 96.0%, 97.3% and 98.8%, respectively. PCR inhibition was observed for rape seed samples. For the acidified feed samples, more Salmonella-positive samples were found with the PCR method compared to the NMKL method. This study focuses on the growing demand for validated diagnostic PCR methods for routine analysis of animal feed and food samples to assure safety in the food production chain.
Keywords: animal feed, NordVal, Salmonella, validation, PCR, polymerase chain reaction
2
1 2 3 4 5 6 7 8 9 10 11 12 13 14 15 16 17 18 19 20 21 22 23 24 25 26 27 28 29 30 31 32 33 34 35 36 37 38 39 40 41 42 43 44 45 46 47 48 49 50 51 52 53 54 55 56 57 58 59 60 61 62 63 64 65
1
Introduction
2
Food borne diseases such as salmonellosis are recognized as one of the most serious public health
3
concerns today.1 The problem of salmonellosis related to the food industry is cyclic and animal feed
4
may serve as a reservoir for Salmonella contributing to the spread of the bacteria along the food
5
chain.2 The conventional culture method used today for detection of Salmonella in feed is laborious
6
and takes 3-7 days to complete.3 Hence, there is a growing demand for rapid methods for the
7
detection of Salmonella in feed samples. PCR is considered to be one of the most promising
8
techniques to meet this demand and several PCR-based detection methods for Salmonella in food
9
and feed have been developed.4-8
10
Although the PCR-based methods meet the demands of diagnostic laboratories on detection
11
methods regarding sensitivity, specificity and ease of use, the introduction of the technique for
12
diagnostic use has so far been slow. The technological novelty of the technique, the high investment
13
cost and the lack of officially approved, validated and standardized methods have been mentioned
14
as reasons for this delay.8, 9 Validation is an important step in the process of standardizing a method,
15
because it provides evidence that the new method gives results at least as good and in agreement
16
with the currently used reference method, as well as proving confirmation of the reproducibility and
17
specificity when used by other laboratories.8,
18
authorities and end users of a method, and to speed up the implementation of new rapid PCR-based
19
detection systems in diagnostic laboratories.
9
These data are needed to gain acceptance among
20
The aim of this study was to perform a comparative study of a diagnostic PCR procedure6 and
21
the currently used NMKL reference method3 for the detection of Salmonella in animal feed
22
samples. The PCR method, based on a simple PCR-compatible enrichment procedure, has been
23
evaluated and found to specifically detect low numbers of viable Salmonella spp. in feed samples
24
without any sample pre-treatment such as DNA extraction or cell lysis prior to PCR. The
25
probability of detecting 1 CFU/25 g feed in the presence of natural background flora was found to
3
1 2 3 4 5 6 7 8 9 10 11 12 13 14 15 16 17 18 19 20 21 22 23 24 25 26 27 28 29 30 31 32 33 34 35 36 37 38 39 40 41 42 43 44 45 46 47 48 49 50 51 52 53 54 55 56 57 58 59 60 61 62 63 64 65
26
be 0.81.6 It is therefore of great value to perform a validation study for this method in order to gain
27
acceptance for use on a routine basis. In the first part of this study a comparative study of the PCR
28
and NMKL methods for 250 artificially inoculated or naturally contaminated feed samples of both
29
animal and vegetable origin were performed according to the protocol of NordVal.10,
30
Furthermore, a small interlaboratory study was performed to assess the reproducibility of the PCR
31
method.
11
32 33
Materials and methods
34
Feed samples. For the comparative study samples of each of the two main categories of feed, i.e. of
35
animal and vegetable origin, as well as other feed related samples, were used (Table 1). For feed of
36
animal origin, 30 samples were not inoculated (not containing salmonella as determined previously
37
by the NMKL method3), 14 were inoculated with 1-10 CFU Salmonella/25 g feed, 12 with 10-100
38
CFU/25 g, and 17 were naturally contaminated (unknown salmonella status before analysis). For
39
feed of vegetable origin, 26 samples were not inoculated, 18 were inoculated with 1-10 CFU
40
Salmonella/25 g feed, 16 with 10-100 CFU/25 g and 94 were naturally contaminated. Twenty-three
41
other feed related samples (naturally contaminated) were included in the study (Table 1). For the
42
artificially contaminated samples, half of the samples at each level were inoculated with S.
43
Livingstone and the other half with S. Senftenberg. The inoculation level of S. Senftenberg was 8
44
CFU at the 1-10 CFU level, and 75 CFU at the 10-100 level. The corresponding values for S.
45
Livingstone were 9 CFU at the 1-10 CFU level and 92 CFU at the 10-100 CFU level.
46 47
Salmonella strains. Salmonella enterica ssp. enterica serovar Senftenberg S57 (S. Senftenberg, an
48
animal feed isolate from AnalyCen Nordic AB, Kristianstad, Sweden) and S. Livingstone CCUG
49
39481 (obtained from the Culture Collection, University of Göteborg, Gothenburg, Sweden) were
50
obtained by growth in tryptone soy broth (TSB, Merck, Darmstadt, Germany) at 37°C overnight.
4
1 2 3 4 5 6 7 8 9 10 11 12 13 14 15 16 17 18 19 20 21 22 23 24 25 26 27 28 29 30 31 32 33 34 35 36 37 38 39 40 41 42 43 44 45 46 47 48 49 50 51 52 53 54 55 56 57 58 59 60 61 62 63 64 65
51
The concentration of cells was determined by viable counts on tryptone glucose extract (TGE,
52
Merck) agar plates. The cell suspensions were diluted in saline (0.9% (w/v) NaCl) to concentrations
53
corresponding to 1-10 CFU/ml and 10-100 CFU/ml.
54 55
Sample preparation. Twenty-five grams of each feed was homogenized in 225 ml buffered peptone
56
water (BPW, Lab 46, LabM, Bury, UK) in a sterile plastic bag. The feed homogenates (Table 1)
57
were inoculated with Salmonella and enriched at 37°C for 18 h. A small aliquot (0.1 ml) of the
58
samples from this pre-enrichment was analysed further using the NMKL method3, including
59
selective enrichment in Rappaport-Vassiliades soy broth (RVS, Oxoid, CM866, Basingstoke, UK)
60
overnight at 42°C, plating on selective agar xylose lysine decarboxylase (XLD, Neogen, Acumedia,
61
7166, Lansing, Michigan, USA) and brilliant green agar (BGA, Oxoid, CM329), followed by
62
biochemical and serological identification (see Fig. 1). Samples were withdrawn after the pre-
63
enrichment step for PCR analysis and stored at –20°C. Before PCR, samples were thawed and
64
diluted 1:10 in saline and 5 l of the diluted sample was added to the PCR tube.
65 66
PCR conditions. PCR, amplifying a part of the invA gene was run as previously described6 using a
67
mixture consisting of: 0.2 μM of each primer12 (Scandinavian Gene Synthesis AB, Köping,
68
Sweden), 200 μM of each dNTP (Roche Molecular Biochemicals, Mannheim, Germany), 1 PCR
69
buffer (Roche), 0.75 U of Tth DNA polymerase (Roche) and 3 × 10⁴ copies of an internal control
70
DNA fragment.8 The sample volume used was 5 l and the final volume 25 l. A GeneAmp 9700
71
PCR System thermocycler (Applied Biosystems, Foster City, CA) was used. The temperature
72
program started with a denaturation step of 5 min at 94°C, followed by 36 cycles at 94°C for 30 s,
73
60°C for 30 s and 72°C for 40 s, and then 1 cycle at 72°C for 7 min. Finally, the samples were
74
cooled to 4°C. Samples were analyzed with gel electrophoresis using 1% agarose gels stained with
5
1 2 3 4 5 6 7 8 9 10 11 12 13 14 15 16 17 18 19 20 21 22 23 24 25 26 27 28 29 30 31 32 33 34 35 36 37 38 39 40 41 42 43 44 45 46 47 48 49 50 51 52 53 54 55 56 57 58 59 60 61 62 63 64 65
75
ethidium bromide, and bands were visualized with the GelDoc 1000 system (Bio-Rad, Hercules,
76
CA) using the Molecular Analyst software (Bio-Rad).
77 78
Data analysis and statistics. After confirmation of the results obtained by PCR, the relative
79
accuracy (AC), relative sensitivity (SE) and relative specificity (SP) were calculated according to
80
the NordVal validation protocol.10 AC is defined as the degree of correspondence between the
81
response obtained by the alternative method and the reference method on identical samples, as
82
follows: (PA + NA + FP) × 100 / (PA + NA + TP + FN + FP), where PA refers to positive
83
agreement, NA to negative agreement, FP to false positives, TP to true positives, and FN to false
84
negatives. SE is defined as the ability of the alternative method to detect the target microorganism
85
compared to the reference method, as follows: (PA + TP) × 100 / (PA + FN). SP is defined as the
86
ability of the alternative method not to detect the target microorganism when it is not detected by the
87
reference method, as follows: (NA × 100) / (NA + FP). In this study, FP was defined as a negative
88
result for NMKL and a positive result for the PCR method not confirmed by growth; TP was
89
defined as a negative result for NMKL and a positive result for the PCR method confirmed by
90
growth, and FN positive result for NMKL, and a negative result for PCR.
91
To verify that there was no significant difference in the results obtained by the two methods the
92
McNemar test was performed according to Annex F in ISO 16140:2003.13, 14 Cohen’s kappa (κ) was
93
calculated as described by NMKL to quantify the degree of agreement between the two methods15
94
(κ > 0.80 means very good agreement between methods).
95 96
Results and discussion
97
The comparative trial was conducted in accordance with the guidelines provided by NordVal10, 11
98
and included the matrix animal feed of both animal and vegetable origin (Table 1). In a comparative
99
trial, parameters such as the relative accuracy, detection level, sensitivity and specificity are
6
1 2 3 4 5 6 7 8 9 10 11 12 13 14 15 16 17 18 19 20 21 22 23 24 25 26 27 28 29 30 31 32 33 34 35 36 37 38 39 40 41 42 43 44 45 46 47 48 49 50 51 52 53 54 55 56 57 58 59 60 61 62 63 64 65
100
evaluated. The relative selectivity in terms of inclusivity and exclusivity of the PCR method have
101
been determined previously.6 Salmonella strains (n = 101) representing 33 serotypes were correctly
102
identified as Salmonella by both the NMKL and the PCR methods. Strains (n = 43) representing 27
103
bacterial species other than Salmonella were negative according to both methods. Furthermore, a
104
recent study of PCR using the same primer pair showed a 99.6% inclusivity and 100% exclusivity
105
for 364 strains.8 Several other studies have also confirmed the selectivity of the primers.12, 16
106
In this study, no significant differences (using the McNemar test) were found between the two
107
methods for a total of 250 artificially or naturally contaminated samples including animal feed of
108
both vegetable and animal origin. Furthermore, a very good agreement between the two methods
109
was obtained using Cohens kappa (Table 1). The relative accuracy, sensitivity and specificity were
110
evaluated for the PCR method in comparison to the standard culture based method currently in use
111
for detection of Salmonella3 according to the NordVal protocol (Table 1). The relative sensitivity
112
for the matrices animal feed of animal and vegetable origin, as well as when all 249 samples were
113
analysed together were above 95% which is the limit considered acceptable according to NordVal.10
114
No recommendations concerning the levels for the relative accuracy and relative specificity are
115
given in the standard.10 To further assess the reproducibility of the PCR method, when performed
116
by different persons in different laboratories, 40 randomly selected artificially contaminated
117
samples were analysed with PCR at two different laboratories. No significant differences were
118
found between the results obtained at the two laboratories (data not shown).
119
When analysing the data in more detail two major trends were noted: (i) the inability to detect
120
Salmonella in acidified feed samples by the NMKL method, and (ii) difficulties in detecting
121
Salmonella in rape seed samples by PCR. The inability of the NMKL method to detect Salmonella
122
in acidified feed samples has been observed previously.6 One possible reason for this may be that
123
the cells were stressed after acidification and did not recover sufficiently to be able to survive and
124
multiply in the selective RVS broth. Furthermore, it has been shown that Salmonella must reach
7
1 2 3 4 5 6 7 8 9 10 11 12 13 14 15 16 17 18 19 20 21 22 23 24 25 26 27 28 29 30 31 32 33 34 35 36 37 38 39 40 41 42 43 44 45 46 47 48 49 50 51 52 53 54 55 56 57 58 59 60 61 62 63 64 65
125
levels of 104 CFU/ml in RVS broth to enable successful transfer and further growth on the selective
126
agar plates employed in the NMKL method17. A total of six false negative results were found in the
127
comparative study. Out of these six, two were rapeseed or rapeseed meal (Table 1). Furthermore,
128
one rapeseed sample totally inhibited the PCR even at 1:100 dilution with no amplification of either
129
the specific product or the internal control. Rapeseed has previously been noted to be PCR-
130
inhibitory6 with reduced amplification efficiency using the same PCR method. In contrast,
131
Salomonsson et al. (2005) did not have problems with PCR inhibition caused by rape seed samples
132
when detecting salmonella after pre-enrichment in BPW.5 However, a larger volume was used for
133
the PCR (50 µl instead of 25 µl in this study) which diluted the inhibitors. Furthermore, the use of
134
another DNA polymerase (rTth instead of Tth) can also explain the differences. The use of alternate
135
DNA polymerases is a convenient way to overcome PCR inhibition and has successfully been
136
applied for different biological matrices.5,
137
(compound feed containing fishmeal and coccidiostatics) was not detected by the PCR method,
138
although the internal control was amplified. As a control, this sample was re-analysed after the
139
validation study was completed using four new 25 g samples inoculated with 4 CFU of Salmonella.
140
All four samples were positive with the PCR method. The other two false negative results for the
141
feed of animal origin were obtained for samples not inoculated with Salmonella (meat meal and fish
142
meal). The samples also proved negative with NMKL when three new 25 g portions were analysed,
143
which indicates that the sample included in the validation study was false positive with the NMKL
144
method, possibly due to cross contamination.
6, 18
Additionally, Salmonella in one spiked sample
145
Special routines are needed to avoid carry-over contamination during the entire PCR
146
procedure. Particular attention should be paid to the handling of samples to avoid transfer of
147
amplified PCR product to the samples and reaction mixture, as well as to avoid the possibility of
148
contamination of negative wells by adjacent positive wells during gel electrophoresis. One non-
149
spiked sample was false positive with the PCR method. The amplified PCR product showed a faint
8
1 2 3 4 5 6 7 8 9 10 11 12 13 14 15 16 17 18 19 20 21 22 23 24 25 26 27 28 29 30 31 32 33 34 35 36 37 38 39 40 41 42 43 44 45 46 47 48 49 50 51 52 53 54 55 56 57 58 59 60 61 62 63 64 65
150
band in the gel, which could indicate contamination or the presence of low amounts of Salmonella
151
in the sample. Reasons for this result might be carry-over contamination during preparation of the
152
samples or contamination from adjacent wells during gel electrophoresis. The sample was
153
reanalysed using both the NMKL and PCR methods with negative results. However, there is a
154
possibility that the sample might have been contaminated with Salmonella at a low level, which was
155
not detectable. The issue of weak bands should therefore be considered in the final protocol for the
156
alternative method. To circumvent these problems and further speed up the analysis, real-time PCR
157
or PCR-ELISA might be used instead of electrophoresis to detect the amplicon. Several recent
158
studies have successfully detected the same amplicon using PCR followed by ELISA19 and real-
159
time PCR using SYBRGreen19, 20 or TaqMan probes19-21 for detection.
160
In conclusion, the PCR method validated in this study enabled the detection of low numbers
161
of Salmonella in less than 24 h, compared to at least 3 days using the NMKL method (Fig. 1). For
162
the problematic sample type rapeseed further studies are needed to achieve better pre-PCR
163
processing to overcome the inhibitory effect. For acidified soy samples more positives were found
164
with the PCR method than with the NMKL method, indicating difficulties in the recovery of
165
sublethally damaged Salmonella cells by selective enrichment. To obtain NordVal approval the
166
study needs to be supplemented with an additional interlaboratory study. However, the specificity,
167
simplicity and speed of the PCR method makes it suitable for routine analysis of large numbers of
168
samples and the implementation of the method in industry will help improve safety in the food
169
production chain.
170 171
Acknowledgements
172
The authors wish to thank Dr. Halfdan Grage for help with the statistical analysis and Desirée
173
Andersson for technical assistance. This work was financially supported by the Swedish Agency for
9
1 2 3 4 5 6 7 8 9 10 11 12 13 14 15 16 17 18 19 20 21 22 23 24 25 26 27 28 29 30 31 32 33 34 35 36 37 38 39 40 41 42 43 44 45 46 47 48 49 50 51 52 53 54 55 56 57 58 59 60 61 62 63 64 65
174
Innovation Systems (VINNOVA), and the Foundation of the Swedish Farmers' Supply and
175
Crop Marketing Cooperation (SL-stiftelsen).
176
10
1 2 3 4 5 6 7 8 9 10 11 12 13 14 15 16 17 18 19 20 21 22 23 24 25 26 27 28 29 30 31 32 33 34 35 36 37 38 39 40 41 42 43 44 45 46 47 48 49 50 51 52 53 54 55 56 57 58 59 60 61 62 63 64 65
177
References
178 179
1. C. Tirado and K. Schmidt, J Infect 43, 80 (2001).
180
2. R.H. Davies and M.H. Hinton, In: Salmonella in Domestic Animals, edited by C. Wray and A.
181 182 183
Wray (Cabi Publishing, Wallingford, UK, 2000), p. 285. 3. Anonymous, Method no 71, 5th ed (Nordic Committee on Food Analysis (NMKL), Åbo, Finland 1999).
184
4. J. Hoorfar, P. Ahrens and P. Rådström, J Clin Microbiol 38, 3429 (2000).
185
5. A.C. Salomonsson, A. Aspán, S. Johansson, A. Heino and P. Häggblom, J Rapid Methods Auto
186 187 188 189 190
Microbiol 13, 96 (2005). 6. C. Löfström, R. Knutsson, C. Engdahl Axelsson and P. Rådström, Appl Environ Microbiol 70, 69 (2004). 7. B. Malorny, E. Paccassoni, P. Fach, C. Bunge, A. Martin and R. Helmuth, Appl Environ Microbiol 70, 7046 (2004).
191
8. B. Malorny, J. Hoorfar, C. Bunge and R. Helmuth, Appl Environ Microbiol 69, 290 (2003).
192
9. B. Malorny, P.T. Tassios, P. Rådström, N. Cook, M. Wagner and J. Hoorfar, Int J Food
193
Microbiol 83, 39 (2003).
194
10. Anonymous, NV-DOC.D-20021022 (NordVal, Søborg, Denmark 2002).
195
11. S. Qvist, Food Control 18, 113 (2007).
196
12. K. Rahn, S.A. De Grandis, R.C. Clarke et al., Mol Cell Probes 6, 271 (1992).
197
13. Agresti A, An introduction to categorical data analysis (John Wiley, New York, NJ 1996)
198
14. Anonymous, ISO 16140 (International Organisation for Standardization, Geneva, Switzerland
199 200 201
2003). 15. Anonymous, NMKL procedure no. 20 (Nordic Method Commitee on Food Analysis (NMKL), Oslo, Norway 2007).
11
1 2 3 4 5 6 7 8 9 10 11 12 13 14 15 16 17 18 19 20 21 22 23 24 25 26 27 28 29 30 31 32 33 34 35 36 37 38 39 40 41 42 43 44 45 46 47 48 49 50 51 52 53 54 55 56 57 58 59 60 61 62 63 64 65
202
16. S. Chen, A. Yee, M. Griffiths et al., Int J Food Microbiol 35, 239 (1997).
203
17. H.J. Beckers, J. vd Heide, U. Fenigsen-Narucka and R. Peters, J Appl Bacteriol 62, 97 (1987).
204
18. W. Abu Al-Soud and P. Rådström, Appl Environ Microbiol 64, 3748 (1998).
205
19. S. Perelle, F. Dilasser, B. Malorny, J. Grout, J. Hoorfar and P. Fach, Mol Cell Probes 18, 409
206 207 208 209
(2004). 20. P.F. Wolffs, K. Glencross, R. Thibaudeau and M.W. Griffiths, Appl Environ Microbiol 72, 3896 (2006). 21. I. Hein, G. Flekna, M. Krassnig and M. Wagner, J Microbiol Methods 66, 538 (2006).
210
12
1 2 3 4 5 211 6 7 8 9 10 11 12 13 14 15 16 17 18 19 20 21 22 23 24 25 26 27 28 29 30 31 32 33 34 35 36 37 38 39 40 41 42 43 44 45 46 47 48 49
Table 1 Comparison of the results in the comparative trial obtained by PCR and the reference culture methoda. Category
Animal origin
Sample type
PA
NA
FN
TP
FP Totalb AC
SE
SP
(%)
(%)
(%)
κ
Fishmeal
8
12
1
0
0
21
95.2 88.9 100.0
Meat meal and bone meal
8
21
1
2
0
32
90.6 111.1 100.0
Compound feed (pet food pellets)
4
6
0
0
0
10
100.0 100.0 100.0
Compound feed (containing fish meal and coccidiostatics)
5
4
1
0
0
10
90.0 83.3 100.0
Animal total
25
43
3
2
0
73
93.2 96.4 100.0 0.85
Vegetable origin Ingredients, not heat treated (cereals, pulses and rape seed)
7
18
1
1
0
27
92.6 100.0 100.0
Ingredients, acidified (soybean meal, rape seed meal)
7
48
0
1
1
57
98.2 114.3 98.0
Compound feed (pellets)
8
9
0
0
0
17
100.0 100.0 100.0
Ingredients, heat treated (soybean meal, rapeseed meal, palm
14
36
1
0
1
52
98.1 93.3 97.3
36
111
2
2
2
153
97.4 100.0 98.2 0.90
Environmental
0
3
0
0
0
3
100.0
Feed concentrate
7
12
1
0
0
20
95.0 87.5 100.0
7
15
1
0
0
23
95.7 87.5 100.0 0.90
kernel expeller) Vegetable total Other
Other total 13
-c
100.0
1 2 3 4 5 6 7 212 8 9 10 213 11 12 214 13 14 215 15 16 17 216 18 19 217 20 21 22 23 24 25 26 27 28 29 30 31 32 33 34 35 36 37 38 39 40 41 42 43 44 45 46 47 48 49
Total a
68
169
6
4
2
249
96.0 97.3 98.8 0.88
PA: Positive Agreement, NA: Negative Agreement, TP: True Positive, FN: False Negative,
FP: False Positive, AC: Relative Accuracy, SE: Relative Sensitivity, SP: Relative Specificity, N = PA +NA + FN + TP + FP b
The PCR for one rape seed sample was totally inhibited (no specific product or internal control band produced) even at 1:100 dilution.
This result is considered inconclusive and was not included in the analysis. The total number of samples included in the statistical analysis was therefore 249. c
-, calculation of SE was not possible because PA + FN = 0
14
1 2 3 4 5 6 7 8 9 10 11 12 13 14 15 16 17 18 19 20 21 22 23 24 25 26 27 28 29 30 31 32 33 34 35 36 37 38 39 40 41 42 43 44 45 46 47 48 49 50 51 52 53 54 55 56 57 58 59 60 61 62 63 64 65
218
FIGURE LEGEND
219 220
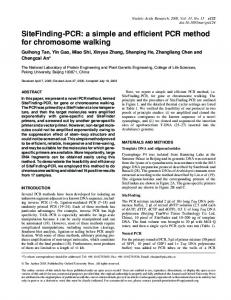
Fig. 1. Overview of the validation study set-up.
15
Figure 1 Click here to download Figure: Lofstrom et al Fig 1.ppt
Day 0
25 g feed + 225 ml BPW Enrichment
Day 1
Enrichment (RVS)
Day 2
Selective plating (XLD, BGA)
Day 3
Biochemical and serological identification
42ºC, 24 h
37ºC, 18 h
Dilution in saline
37ºC, 24 h
PCR
(invA)