Kolling Institute of Medical Research, Sydney Medical School, The University of Sydney .... using custom software routines conforming to the Society of Automotive .... travelled extensively during night hours with 48% of kilometres driven at ...
Validation of an in-vehicle monitoring device for measuring driving exposure and deceleration events Meredith, L.1,2,3 Brown, J.2 Clarke, E.3,4 Coxon, K. 1 Boufous, S.1 Ivers, R.1 Keay, L.1 1
The George Institute for Global Health, The University of Sydney
2
Neuroscience Research Australia
3
Faculty of Engineering, University of Sydney
4
Kolling Institute of Medical Research, Sydney Medical School, The University of Sydney Abstract
Background: In-vehicle monitoring is being used increasingly in research into driver behaviour. Advances in Global Positioning Systems (GPS), data management and telecommunications have made this a viable tool to objectively measure driving exposure and also speed patterns. Aim: The purpose of this study was to validate an in-vehicle monitoring device in the laboratory where speed and deceleration can be controlled and in field experiments. Methods: The device consists of a C4D Data Recorder with External GPS Receiver. The hardware includes an internal 3D accelerometer, tachograph, real-time clock, internal battery (1300mA) and 128MB of flash memory. The in-vehicle data logger transmits GPS location via the mobile telecommunications network. The device was evaluated in a laboratory and field tested to investigate the context for deceleration events. We developed algorithms to process summary data for driving routes and deceleration incidents. Results and Discussion: Protocols were established for use of the device in the field and programs developed to extract events. The application of this technology is an innovative approach in driver behaviour and vehicle safety research. Keywords In-Vehicle Monitoring, Impact Crash Sled, Near-Miss Introduction Shortcomings in the quality and type of data available from traditional epidemiological crash databases have led to a variety of alternative methods for assessing driver safety. Naturalistic driving, or in-vehicle monitoring, is being used increasingly in research into driver behaviour and safety. This type of driving assessment has been proven to increase the validity of results due to data capture in real-time and the actual driving context (Dingus, Neale et al. 2006). In vehicle monitoring will be used to measure the primary outcomes of driving exposure and safety in a randomized, controlled study evaluating a safe driving program for older drivers being conducted in North West Sydney. By linking an in-vehicle monitoring system with global position satellite (GPS) capabilities, driving exposure can be measured. Safety may also be evaluated using the monitoring system by measuring the number of incidents a person may be involved in, by monitoring instances of rapid vehicle deceleration.
A crash is defined as any contact with an object, either moving or fixed, at any speed, in which kinetic energy is measurably transferred or dissipated. This can include contact with other vehicles, roadside barriers, objects on or off the roadway, pedestrians, cyclists, or animals. A near-miss has been defined as any circumstance which requires a rapid, evasive manoeuvre by the subject vehicle to avoid a crash. A rapid, evasive manoeuvre is defined as steering, braking, accelerating, or any combination of control inputs that approaches the limits of the vehicle’s capabilities. Such manoeuvres will generally be associated with a rapid change in deceleration and have been used as outcomes of interest in driving research (Hanowski 2000; Smith, Najm et al. 2002; Dingus, Klauer et al. 2006; Dingus, Neale et al. 2006; Keay, Munoz et al. 2012). However, using rapid decelerations as a metric for near-miss events can be problematic especially when the threshold for identifying near-misses is unknown. This study used laboratory and field experiments to validate the in-vehicle monitoring system’s accuracy over time as well as verifying algorithms used to define crash and rapid deceleration events. This paper reports the findings of these experiments in the context of their future application in a large-scale, naturalistic driving study. Methods In-Vehicle Monitoring Device The equipment consists of a C4D Data Recorder with connected External GPS Receiver. The GPS is incorporated into the monitoring system and is used to determine the location of the vehicle at any position on the earth through navigational satellites (Porter and Whitton 2002). The hardware includes an internal 3D accelerometer (capacity 2000 milli-g; resolution 18 milli-g), tachograph, real-time clock, internal battery (1300mA) and 128MB of flash memory. The device, otherwise known of as the ‘black box’, is small and portable and easy to install into the participants vehicles. The black box is shown in Figure 1.
Figure 1: In-vehicle monitoring device (11cm x 8.5cm x 3cm)
The devices were hardwired to the vehicle in a concealed and unobtrusive location, under the driver or passenger seat or on another suitable location to ensure fixed orientation to align the axis of the accelerometer with the direction of travel. Positive values recorded by the accelerometer therefore indicated deceleration of the vehicle. The in-vehicle data logger transmited the deceleration 32 times per second and GPS location second-by-second to a central server via the mobile telecommunications network as shown in Figure 2. The secondby-second GPS location was then pre-processed by integration with a custom database of the road network to map driving routes in relation to speed zones (SmartCar Technology Pty Ltd).
Figure 2: Data transmission via the telecommunications network
Experiments Two laboratory (Lab 1 and Lab 2) experiments and one field experiment were conducted. Lab 1: The first laboratory experiment aimed to validate the device calibration and determine whether the accelerometer experiences any substantial drift with time. This was achieved by investigating the behaviour of the accelerometer when the device remained stationary. In this experiment, one black box was powered, placed on a bench and left to run for two days while data were being transmitted. A second black box was placed inside a car and left to run for approximately ten minutes so that the difference between the two locations could be examined. The data were examined by plotting deceleration data against time. From this, drift, signal noise and device calibration could be estimated.
Lab 2: The second laboratory experiment was a low-speed impact crash test. This study was undertaken at Neuroscience Research Australia (NeuRA) using a low-speed impact crash test sled with the capability of reaching speeds of up to 30km/h. The principal objectives of this study were to investigate the device’s accuracy and sensitivity to deceleration events. The specific aims were to: 1. Model different types of acute decelerations events which may be experienced by the participants and investigate drift and change in calibration after a series of impacts. 2. Review the data output in terms of magnitude of deceleration measured and duration of events from the black box device in relation to the testing matrix and measured deceleration. Two accelerometers and a black box with power supply were directly mounted onto the impact crash sled (Figure 2). The impact sled was then subjected to a number of different deceleration events covering a range of impact velocities and decelerations by manipulating the distance, weight and pressure in the air spring. A test matrix depicting the impact velocities and decelerations used is shown in Table 1. Data from the accelerometers were captured using an Applied Measurement data acquisition system at 10kHz, and processed using MATLAB 7.9.0 (The Mathworks, Natick, MA, USA), using custom software routines conforming to the Society of Automotive Engineers (SAE) requirements specified in SAE J211 (SAE 2007). Data were processed to obtain and plot peak deceleration and change in velocity (Table 1).
Table 1: Test matrix for laboratory experiment 2
Test
A1 peak deceleration (g)
A2 peak deceleration (g)
Change v (m/s)
1
9.79
9.63
6.08
2
9.71
9.63
6.07
3
7.77
7.90
4.60
4
7.867
7.87
4.96
5
14.72
14.61
8.14
6
14.89
14.86
8.16
7
10.08
10.02
6.04
8
10.00
9.98
6.07
9
8.29
8.41
4.92
10
8.39
8.08
4.91
11
17.85
17.73
8.85
12
17.98
17.78
8.85
13
19.01
18.84
8.84
14
18.99
19.13
8.84
A1=accelerometer 1 fixed to the sled, A2= the second fixed accelerometer, change v= sled change in velocity during the impact
Data from the black box were captured using the internal C4D Data Recorder and External receiver, and processed using custom MATLAB algorithms.
Figure 3: Low-speed impact crash test sled
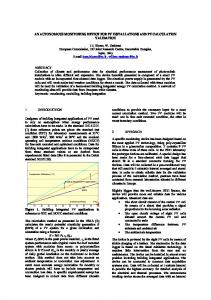
Field study: In the field study data were collected in routine driving during the pilot phase of the larger study. The aim of this field study was to test the custom Matlab program during regular driving to field test the threshold for identification of rapid deceleration events. A black box was installed in the vehicles of three older driver participants and data were continuously captured (whenever the engine was running) via the internal C4D Data Recorder and External GPS Receiver over a one week period of driving. The study participants had signed a record of informed consent and the study protocol was approved by the University of Sydney Human Research Ethics Committee. Deceleration data were processed using three versions of the custom designed Matlab program. Each version of the program contained modified algorithms with adjusted rapid deceleration event thresholds set at 550 milli-g, 600 milli-g and 650 milli-g. These thresholds were chosen based on thresholds used in literature (Dingus, Klauer et al. 2006, Keay, Munoz et al. 2012), but increased to allow for system noise as determined in Lab study 1 (Lab 1).The number of events identified for each threshold was then computed. These events were plotted on the maps of the driving routes for each participant’s weekly driving. Lateral deceleration data were not investigated.
Results Lab 1: The results from the stationary black box demonstrated no drift in the data captured over the 2 day continuous period. However, an offset and fluctuation, or noise, was observed in the signal. The offset indicated that the data were not at zero when the device was resting and should have been at zero. Figure 4 illustrates a sample of the data obtained over the two day testing period and shows that the offset was approximately 54 milli-g from zero with fluctuations of ±40 milli-g.
Figure 4: Sample of the data recorded by a stationary device over 2 days
The data from the stationary black box were also compared to a second device fitted in a stationary car with the engine running for 10 minutes. Figure 5 shows a sample of the accelerometer data which were captured during the 10 minute running time of the device fitted in the stationary vehicle. In this device the offset was approximately -90 milli-g. The fluctuations generally remained within the ±40 milli-g range; however, there were some greater fluctuations observed +60 milli-g and -72 milli-g.
Figure 5: Sample of the data recorded by a device in a stationary car for 10 minutes
Lab 2: The data collected from the black box during the entire sled testing period is shown in Figure 6. No drift was experienced during the testing. The black box accurately recorded each impact event, however the device did not measure values above 2250 milli-g. Investigation with the device’s manufacturer revealed the range of the internal accelerometer had been set to a maximum of 2000 milli-g, with a small buffer. As the deceleration of the impact events were 8000 milli-g (Table 1) and above, the peak deceleration could not be measured. The lower peaks seen in Figure 6 are due to the movement of the sled prior to the impact.
Figure 6: X-deceleration against time for the entire testing period of the sled test
Field Study: Data were obtained from black boxes installed in the vehicles of three participants over a week long period. A summary of these data and the number of rapid deceleration events identified with each variation of Matlab algorithm is shown in Table 2. The weekly extent of driving varied between participants from 22 to 103 kilometres and the maximum distance travelled from home varied between 4-16 kilometres. Only participant 2 travelled extensively during night hours with 48% of kilometres driven at night and while they did not travel far from home (6 kilometres) they drove over 100 km. Table 2: Summary of results obtained from the field study
Age (years) Gender Total trips Longest trip distance (km) Longest trip duration (min) Furthest radius from home (km) Total distance driven day (km) Total distance driven night (km) Number of events ≥550milli-g Number of events ≥ 600milli-g Number of events ≥ 650milli-g km= kilometres, min=minutes
Participant 1 81 Male 21 18.19 25.16 15.5 62.04 0.04 10 2 2
Participant 2 84 Male 31 10.27 33.10 5.97 53.49 49.82 5 1 1
Participant 3 83 Female 9 6.53 13.02 3.76 21.7 0 1 0 0
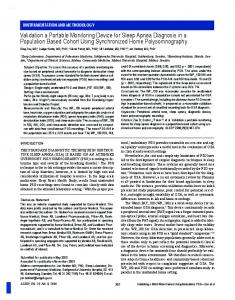
The majority of the deceleration events identified for the three participants were no more than 700 milli-g except one event which recorded a peak deceleration of 1641 milli-g. This event
is marked within the travel route of participant 2 (Figure 7, Panel A) and the context in an enlarged view of the street location (Figure 7, Panel B). Telephone interview with the participant confirmed that he braked suddenly in response to the car in front stopping suddenly. The other deceleration events were lower and mostly at approach to intersections.
Figure 7: Black box data for participant 2: Panel A: Total driving during 1 week, green lines indicate travel at or below speed limit and red lines, travel above the speed limit. Deceleration events are marked on the route. Panel B shows the location for a high range deceleration event.
Discussion Care is required in constructing algorithms to measure deceleration using the black boxes due to data offsets and fluctuations. Accuracy of the deceleration data collected from the black boxes is critical to using this in-vehicle monitoring system to identify rapid deceleration events. Offsets, such as those observed here, would invalidate results and lead to the identification of many false events and/or allow some important events to be missed. In the first laboratory experiment, an offset was found. This offset varied depending on the particular device. To address this, modifications to the protocol for the use of the in-vehicle monitoring devices in the older drivers study have been made. Each device will be tested prior to instalment into the participants’ cars by leaving the device powered in a stationary location for 5 minutes. From these data, a correction factor for the offset for each device can be determined and subtracted so that the data will be balanced to zero offset. Furthermore, fluctuations will be accounted for by adjusting the threshold to a higher value to ensure the noise does not inadvertently trigger a false positive. The threshold chosen is important for the naturalistic driving study in order to minimise the number of false positive events. Our pilot data suggests that using thresholds of 550 milli-g in the forward direction, up to 10 rapid deceleration events per participant might be identified over a one-week period. This value is close to that used in the 100 car study (Dingus, Klauer et al. 2006) which used a cut off of 450 milli-g. Another naturalistic driving study evaluated deceleration events over 350 milli-g (Keay, Munoz et al. 2012). The subset of events which are over 1000 milli-g may represent more significant events such as coming to a rapid stop or small bumps, as found in our laboratory experiments. Further study of each deceleration event identified in the presented field study by contact with the driver will further confirm the appropriate threshold value. By comparing the timing of the event with location data and
information obtained through survey of the participants more detail about exactly what occurred during each event will be gathered. Based on the results here we can expect at least one event each week from the participants. A lateral threshold was not included in this investigation as it was deemed to involve complex mechanisms and events may not easily be determined from a simple threshold level. Further investigations are needed to determine whether a suitable threshold for lateral decelerations can be used or whether multiple criteria need to be set to determine whether a rapid deceleration event occurs in the lateral direction, such as swerving to avoid a collision. Data from the crash testing also confirmed that low speed crashes could be successfully measured by this device as sharp peaks with short duration. It is a limitation that crash tests could not be conducted at a deceleration less than 8000 milli-g; however that was not possible with the sled test used. Therefore our laboratory tests could not confirm the accuracy of peak deceleration readings. However, the primary aim of the device, in the context in which it is to be used, is to measure the ‘presence of an event’ rather than to measure the severity of an event. The results from these studies provide confidence that with further confirmation from the field data, the devices will provide useful outcome data. From the limited data collected from the three participants of the pilot study, it is clear that the devices will also provide a valid measure of any change in driving characteristics such as kilometres driven, distance driven, routes used, and night driving. This is an important outcome in the evaluation of the safe driving intervention being trialled in the larger naturalistic driving study. These data will greatly inform the debate about older driver safety and has clear advantages over relying on self-report.(McGwin, Owsley et al. 1998) With careful attention to algorithms used, the black boxes will provide invaluable exposure data for this unique sub-population of drivers, and this driving data will also provide a valid outcome measure in the planned randomized, controlled study evaluating a safe driving program for older drivers. Conclusion In-vehicle monitoring is becoming a widely-used tool for measuring naturalistic driving behaviour. This paper has demonstrated the validity of using an in-vehicle monitoring system for measuring outcomes, including crash or rapid deceleration events and driving exposure. This preliminary work has demonstrated the validity of the system as a tool to measure changes in driving exposure and speed patterns. It has also demonstrated that care is needed in using this technology to measure outcomes based on deceleration events. In particular this work has demonstrated that several factors need to be accounted for when using these devices, such as the accuracy of calibration, the signal noise, and the validity of the events being recorded. Future studies using in-vehicle monitoring devices should ensure that these factors have been tested prior to use for accurate and valid results. With all these factors considered, in-vehicle monitoring using this system should prove to be a useful tool for measuring driver safety and exposure. Acknowledgements The authors would like to thank NeuroScience Research Australia for use of the laboratory and SmartCar Technologies for managing data transfer and processing of trip exposure data. Lauren Meredith was funded by a Summer Research Scholarship from Sydney Medical School, The University of Sydney. We would also like to thank the study participants.
References Dingus, T. A., S. G. Klauer, et al. (2006). The 100-Car Naturalistic Driving Study, Phase II - Results of the 100-Car Feild Experiment. Blacksburg, Virginia Tech Transport Institute. Dingus, T. A., V. L. Neale, et al. (2006). "The development of a naturalistic data collection system to perform critical incident analysis: an investigation of safety and fatigue issues in long-haul trucking." Accid Anal Prev 38(6): 1127-1136. Hanowski, R. J. (2000). The Impact of Local/Short Haul Operations on Driver Fatigue, Virginia Polytechnic Institute and State University. Keay, L., B. Munoz, et al. (2012). "Older drivers and rapid deceleration events: Salisbury Eye Evaluation Driving Study." Accid Anal Prev. McGwin, G., Jr., C. Owsley, et al. (1998). "Identifying crash involvement among older drivers: agreement between self-report and state records." Accid Anal Prev 30(6): 781-791. Porter, M. M. and M. J. Whitton (2002). "Assessment of driving with the global positioning system and video technology in young, middle-aged, and older drivers." J Gerontol A Biol Sci Med Sci 57(9): M578-582. SAE (2007). SAE J211 Instrumantation for Impact Tests. Smith, D. L., W. G. Najm, et al. (2002). "Feasibility of driver judgement as basis for a crash avoidance database." Transportation Research Record 1784: 9-16.