PROCEEDINGS of the Fifth International Driving Symposium on Human Factors in Driver Assessment, Training and Vehicle Design
VALIDATION OF THE STATIC LOAD TEST FOR EVENT DETECTION DURING HANDS-FREE CONVERSATION Richard A. Young1, Linda S. Angell1, John M. Sullivan2, Sean Seaman3, Li Hsieh3 1 Wayne State University School of Medicine Detroit, MI, USA 2 University of Michigan Transportation Research Institute Ann Arbor, MI, USA 3 Wayne State University Detroit, MI, USA E-mail:
[email protected] Summary: Objective. To see if visual event reaction times (RTs) during handsfree conversation conditions in the Enhanced Static Load Test (ESLT) can predict RTs in similar conditions in on-road driving. Methods. Brake reaction times to random center and side light events were measured while watching a driving video, attempting to keep a marker in the center of the lane with a steering wheel, answering the phone by pressing a button, and carrying on neutral or angry handsfree conversations in covert (silent) or overt mode on a hands-free phone device. Open-road tests were conducted in traffic for subjects with similar side and front light events, with foot reaction times measured while engaged in the same secondary tasks and conditions. Results. Mean RTs for the task segments in the lab were predictive of the mean RTs for the corresponding task segments in the on-road test (r = 0.90, df = 16, p < 0.000001). Conclusion. This study validates the Enhanced Static Load Test as predictive of visual event RTs during open-road driving for the range of experimental conditions and tasks considered. INTRODUCTION Numerous approaches have tried to validate driver performance in simulators by using on-road tests (e.g., Blana, 1996; Harms et al., 1996; McGinty et al., 2001; Engström et al., 2005; Yan et al., 2008). Lee et al. (2003) used principal component analysis to find separate performance indices in a simulator and on-road test of 129 older drivers. The simulator and road indices that were combined across variables produced correlations across individual drivers from simulator to road with r = 0.72 (p < 0.05) after adjusting for age and gender. Lee et al.’s (2003) approach of combining variables to achieve high correlations across individuals from lab to road is useful for clinical applications such as determining a particular driver’s fitness to drive. A different approach is required in our applied research, which grew out of a need to predict on-road driver performance for tasks, rather than individuals, to help improve driver interfaces. We therefore require a test methodology that achieves high correlation across tasks from lab to road for single key variables, such as eyes-off-road time, or in this paper, event detection. We typically collapse data across individuals to create a performance metric for each task, for a given variable of interest. We then attempt to predict the on-road metric for each task from the lab metric for each task. In short, we are here interested in predicting on-road tasks, not individuals, from lab data.
268
PROCEEDINGS of the Fifth International Driving Symposium on Human Factors in Driver Assessment, Training and Vehicle Design
As our metric for validation, we use predictive validity, defined in two ways: (1) the simulator gives rise to a high correlation between the task metrics for lab vs. road; (2) the simulator gives rise to the same conclusions about the experimental conditions as the road test. Note that a simulator with high face validity (e.g. high visual and dynamic fidelity) does not necessarily ensure high predictive validity (Harms et al., 1996; Curry et al., 2005). Likewise, a lab test with low face validity can have high predictive validity – the Sternberg lab test is apparently unrelated to event detection, but is a good predictor of event detection on the road (Angell et al., 2006). We investigate here the predictive validity of a low-cost, low-fidelity simulator for event detection on the road. Our main metric is mean foot reaction time (RT) to visual events for a set of experimental conditions and tasks related to conversations with a hands-free mobile device. Static Load Test (SLT) The first two authors and colleagues previously developed a simple low-fidelity simulator termed the Static Load Test (SLT) (Angell et al., 2002; Young et al., 2005). It enhanced the Peripheral Detection Task (PDT) (e.g. Martens & van Winsum, 2000; Harms & Patten, 2003; Jahn et al., 2005) which places a light in a drivers’ peripheral vision while they perform secondary tasks. RTs and misses to the light are used as indicators of driver workload. The SLT enhances the PDT by adding a central light far enough away from the peripheral light so that a subject cannot simply stare at one light (or fully direct mental attention to it) without increasing misses to the other light. The SLT also has passive watching of a driving video without steering. Angell et al. (2002) found in a within-subjects design that the SLT had strong correlations (r > 0.94, p < 0.01) between lab and road across 10 visual-manual tasks for the variables of task time, number of glances, eyes-off-road time, subjective workload and subjective situation awareness. On-road RTs to a visual event for those same tasks and individuals were predicted at r = 0.72 (p < 0.05), but miss rates were not correlated (r = 0.5, n.s.). Young et al. (2005) used a between-subjects design with different institutions and different event detection software for the lab and road tests, but with the same vehicles and tasks. They found no statistically significant correlations for event detection variables across the large number of tasks tested, using mean lab scores to predict 80th percentile road scores. Yet conventional driver workload variables had high lab-to-road correlations for the identical tasks (r > 0.9), suggesting something unusual about event detection variables that warranted further investigation. Young and Angell (2003) did a principal component analysis of a large set of driver performance variable means, for a wide range of visual-manual tasks, using event lights on the hood and side mirror while driving on a closed road. They showed that across tasks, event detection on the road is positively correlated with driver workload variables on the first dimension, but negatively on the second. It is clear from this result that at least two dimensions are needed to account for the contribution of event detection variables to driving performance on the road. Numerous studies demonstrate that RTs typically increase with conversation by about 200 msec in the lab, and on the road (for review see Horrey and Wickens, 2006). However, previous studies were often separately done on lab, road, or test track with no direct validation of the correspondence (or lack of it) between the domains. We therefore undertook a thorough investigation of the predictive validity for on-road event detection of an enhanced lab test.
269
PROCEEDINGS of the Fifth International Driving Symposium on Human Factors in Driver Assessment, Training and Vehicle Design
METHOD The Enhanced Static Load Test (ESLT) is a stationary lab test of human subjects intended to predict effects on-road driving performance from interacting with in-vehicle systems. It extends the Static Load Test (SLT) described in the previous section by adding a steering wheel by which the subject is required to keep a screen marker in the center of the lane on the driving video (a tracking task, Fig. 1A), adding more visual attentional demand. In addition, the lights presented at central and peripheral locations can now be either red or green. Participants are asked to respond only to the red lights, and to ignore the green lights (a Go/NoGo task). For each trial of the event detection task, a small red or green light event occurs randomly in time, either at the bottom center or left side of a computer monitor showing a high-quality video of a driving scene. When the light is red, the Fig. 1A. Extended Static Load Test in lab B. On-road test subject is asked to press a pedal with the right foot, simulating a brake response, as soon as an event is detected. Each light terminates after 2.5 sec, or when the pedal is pressed, whichever comes first. The inter-event range is 2 to 5 sec with a mean of 3.5 sec. Events are presented at unpredictable times in the inter-event range to reduce anticipation. The RT and misses to the event lights are recorded. Subjects can direct their eyes and visual attention to any spatial location in the driving scene at will. When a light occurs, it is visible in the central or peripheral field of view for any eye rotation, assuming the eyes are open. In addition, each light is presented to both eyes to ensure it would not be in the blind spot for at least one eye. A light persists long enough (2.5 sec) that it can still be seen either before or after an eye blink. Pressing the brake pedal extinguishes the light. A RT more than 2.5 sec long to the red light is recorded as a miss. Simultaneously, a hands-free cellular device is answered by pressing a button after hearing a ring tone, and conversation is carried on with recorded utterances heard through speakers, with verbal responses through the microphone (Fig. 1A). Hits, misses, and brake RTs to the lights on the driving video are recorded by a computer. The ESLT uses custom software for producing behavioral stimuli (lights, sounds), and recording RTs to the lights by pressing the foot pedal. Fig. 1B shows the vehicle implementation. All event presentation times, response software, and conversation conditions are identical to the lab test. LED lights are placed on the front of the vehicle in the center of the driver’s line of sight, and on top of the left outside mirror. The driver responds to the lights with the left foot, pressing a switch to the left of the brake pedal (using the brake to respond to the lights might have interfered with driving). Training was done while stationary before the experimental run. All road subjects were previously run in the lab, to ensure familiarity with the protocols. The road test was on an open highway with traffic (Route 23 near UMTRI in Ann Arbor), which has a speed limit of 65 MPH. There was an experimenter in the front seat with a secondary brake pedal as a precaution but no incidents occurred.
270
PROCEEDINGS of the Fifth International Driving Symposium on Human Factors in Driver Assessment, Training and Vehicle Design
Subjects Subjects participated on a voluntary basis, provided written informed consent, and were compensated. Human subject protocols were approved by the respective human subject committees at our universities. Subjects had to be unfamiliar with the system under investigation, interested to use the system, capable of learning and completing the test procedure, and have no physical limitations that would affect task performance. The sample (obtained through ads) was evenly split between genders, from ages 21 to 65 inclusive. Each subject practiced trial tasks until successful (with feedback or instruction prior to formal testing). In the lab tests, 23 subjects participated for covert conditions, and 17 other subjects for overt conditions. In the road test, all 16 subjects were run in all conditions, and all these subjects were previously in a lab test. Experimental Conditions The experimental conditions were the same for the lab and on road, with event detection and driving (or simulated driving) for all conditions. Conversation conditions occurred with a handsfree cellular device with three main conditions: (1) no conversation (baseline); (2) neutral conversation; and (3) angry conversation. Subjects were called several times while engaged in the driving or simulator task. After hearing a ring tone, they answered a call by pressing a button with their right hand. The subject was asked various simple autobiographical questions in an angry or neutral tone. Covert (speaking to oneself) speech responses were intermixed in a balanced manner with Overt (speaking aloud) speech responses for the neutral and angry conditions. In the lab, there was a fixation baseline with a crosshair on a blank screen between the main experimental conditions. Performance Metrics, Task Segments, and Statistical Methods The main objective was to determine the lab-to-road predictive validity of the ESLT for event detection. The major event detection metric was the foot RT to a red light event. (There were few misses under any condition.) The behavioral data were split post-hoc into 18 task segments for correlation analysis. For ease of labeling the points in a graph, the task segments can be viewed as arising from a 2 x 4 x 2 experimental design: variable one with two levels - Covert and Overt; variable two with four levels - Neutral conversation, Angry conversation, Button press, and No speech (RTs in gaps between conversations within a conversation session, determined post-hoc); and variable three with two levels - Left or Center light position. The remaining two task segments came from the baseline condition, by dividing it into Left and Center light responses. The foot RTs were averaged for each subject for each task segment, to create a subject mean for each segment, paired for lab and road. (Missed lights were excluded from the RT means, but there were so few missed lights that their exclusion did not influence the results.) We employed simple linear regression and correlation methods, as per our earlier studies validating lab-road correspondence (Angell et al., 2002, 2006; Young et al., 2005). A Pearson correlation coefficient was formed across the paired task means for lab and road. The statistical significance of the correlation coefficient was tested by a t-test with 16 df. ANOVAs were also conducted in separate analyses for lab and road, covert and overt, to see if similar conclusions about the road data would be reached if only the lab data had been available.
271
PROCEEDINGS of the Fifth International Driving Symposium on Human Factors in Driver Assessment, Training and Vehicle Design
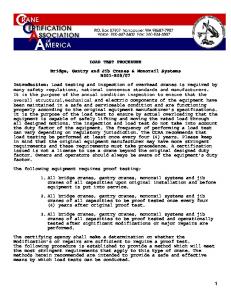
RESULTS Fig. 2 shows a strong correlation between the lab and road RT task segment pairs (r = 0.90, t = 9.03, df = 16, p < 0.000001). Discarding the four longer RT button tasks (9, 10, 17, 18) still gave rise to a statistically significant correlation (r = 0.71, t = 4.93, df = 12, p < 0.001).
Road vs. Lab Reaction Time by Task Segment 900
Road RT (msec)
850
17
Road RT = 0.966(Lab RT) - 10.8 r = 0.90, df =16, p < 0.000001
18
800 750
15
11
700
13
650
1
600 600
650
12 16 7 8
3
14
5
10
46
2
700
750
800
850
9
1 Baseline, Red, Center 2 Baseline, Red, Left 3 Covert, Angry, Center 4 Covert, Angry, Left 5 Covert, No speech, Center 6 Covert, No speech, Left 7 Covert, Neutral, Center 8 Covert, Neutral, Left 9 Covert, Button, Center 10 Covert, Button, Left 11 Overt, Angry, Center 12 Overt, Angry, Left 13 Overt, No speech, Center 14 Overt, No speech, Left 15 Overt, Neutral, Center 16 Overt, Neutral, Left 17 Overt, Button, Center 18 Overt, Button, Left
900
950
Lab RT (msec) Figure 2. Mean brake RT across subjects for each task segment, comparing lab (x-axis) vs. road (y-axis). The 18 task segments are labeled in the inset table
We conducted two-way within-subject ANOVAs on lab RTs for Overt and Covert speech conditions. Results show a main effect of conversation (Baseline vs. Neutral vs. Angry) for both Overt (F(2,101) = 35.40, p < .001) and Covert (F(2,126) = 12.0, p < .001) speech. Separate ANOVAs on the road data found the same main effect: Overt (F(2,75) = 37.9, p < .001) and Covert (F(2,75) = 16.5, p < .001). Also, mean RTs during the Button press task were larger than any conversation mean RT, for both lab and road, as is obvious by visual inspection of Fig. 2 (points 9,10,17,18). In sum, if only the lab data had been available, the same main effects would have been found as if the study had been run on the road. The only exception was a slight effect of light position (Left vs. Center) in the lab, that was not statistically significant on the road. In short, hands-free cellular device conversations caused small (about 100 msec) but statistically significant RT increases for visual event detection compared to a baseline with no conversation, with even larger RT increases for a single button press. These results were the same in the lab as on the road. There were few errors (failure to respond to the red light, or an incorrect response to the green light) in the lab or on the road, and these will be separately reported.
272
PROCEEDINGS of the Fifth International Driving Symposium on Human Factors in Driver Assessment, Training and Vehicle Design
DISCUSSION This study found a correlation of 0.9 for event detection RTs using the Enhanced Static Load Test for conversation-related task segments compared to data from a road test with the same task segments. This correlation is higher than found in prior studies of event detection RT (Angell et al., 2002, 2006; Young et al. 2005) – though prior studies examined broader sets of tasks with more variation in task type. Nonetheless, for the first time, the ESLT brings lab-to-road correlations of RTs to the strong levels found for major driver workload variables such as eyesoff-road time (Angell et al., 2002, 2006; Young et al., 2005). Thus, the ESLT offers promise as a laboratory surrogate for event detection measures as well as driver workload variables. The slight increases in foot RT for conversation vs. baseline are consistent with studies previously conducted in lab or on road alone using similar event detection methods (e.g., Schreiner et al., 2004; Bowyer et al., 2007, 2008, 2009; Hsieh et al., 2009). Our similar pattern of RT effects for covert and overt speech is consistent with lab studies during MEG brain imaging (Bowyer et al., 2008). The relatively larger increases in RT for the visual-manual button press task to answer the cellular device indicates the importance of separating the visual-manual aspects of calls (e.g., dialing, answering) from the conversation aspects, as per Klauer et al. (2006). The finding that visual-motor tasks give rise to longer RTs than voice tasks also supports the conclusions of Angell et al. (2006) who used a wider variety of visual-manual and auditoryvocal tasks. The finding that the miss rate for events during conversation tasks was low confirms Angell et al. (2006) and Schreiner et al. (2004), and is important in its own right. Real-World Implications A recent real-world epidemiological study (Young and Schreiner, 2009) compared personal conversation crash rates to no-conversation crash rates using a hands-free wireless device “embedded” or built into the vehicle. This study found no increase in airbag-deployment crash rates for personal conversations using the device, compared to driving without conversing on the device, consistent with the low crash risk found by Young (2001) for calls to an OnStar advisor. Why is the increase in RT during hands-free conversation in experimental studies not associated with an increase in real-world crash rates when using a hands-free embedded device? Young and Schreiner (2009) hypothesize that the low crash risk in their real-world study “can be explained if drivers making personal wireless calls using the OnStar embedded hands-free calling device are taking responsibility to: (1) make prudent and safe choices about engaging in calls during adverse road, environmental, or traffic conditions, (2) reduce or postpone elective driving maneuvers or secondary tasks that might increase crash risk when in a call, and (3) adapt conversations while in a call to accommodate road and traffic conditions.” Drivers might also be compensating for the predicted small RT increases from hands-free conversations using this device by simply taking extra care to keep their eyes on the road, hands-on-the-wheel, and mindon-the-drive. Real-world in-vehicle naturalistic observational studies such as that of Klauer et al. (2006) will likely be necessary to determine exactly how it is that drivers may be compensating for these predicted RT increases, to keep their crash risk at normal levels.
273
PROCEEDINGS of the Fifth International Driving Symposium on Human Factors in Driver Assessment, Training and Vehicle Design
CONCLUSION This study validates the Enhanced Static Load Test as predictive of visual event RTs during open-road driving for the range of experimental conditions and tasks considered. ACKNOWLEDGMENTS Supported by Michigan Life Sciences Corridor Research Grant to Wayne State University, “Real-time Functional Neuroimaging of Driver Performance”. REFERENCES Angell, L. S., Young, R. A., Hankey, J. M., & Dingus, T. A. (2002). An evaluation of alternative methods for assessing driver workload in the early development of in-vehicle information systems. Soc. of Auto. Engineers Govt./Industry Proc., #2002-01-1981, Washington, DC. Angell, L. S., Auflick, L. L., Austria, P. A., Kochhar, D. S., & Tijerina, L. (2006). Driver workload metrics project: Task 2 final report, U.S. DOT DTFH61-01-X-00014. Blana, E. (1996). Driving simulator validation studies: A literature review. (Working Paper No. 480). Leeds: Institute of Transport Studies, University of Leeds. Bowyer, S. M., Moran, J. E., Hsieh, L., Manoharan, A., Young, R. A., Malladi, K., Yu, Y-J., Chiang, Y-R., Hersberger, R., Genik II, R. J., & Tepley, N. (2007). MEG localization of cortex involved in attention processes during a driving task with conversation. Cheyne, D., Ross, B., Stroik, G., Weinberg, H. (Eds.), New Frontiers in Biomagnetism, 1300, 401–404. Bowyer, S.M., Moran, J.E., Seaman, S., Young, R.A., Sullivan, J., Farjam, R., Tepley, N., Hsieh, L. (2008). Language processes during overt and covert speech in a simulated driving task. In: Proc. of the 16th Intl. Conf. on Biomagnetism, Sapporo, Japan, Aug. 25-29, 232-243. Bowyer, S. M., Hsieh, L., Moran, J. E., Young, R. A., Manoharan, A., Liao, C. J., Malladi, K., Yu, Y-J., Chiang, Y-R., & Tepley, N. (2009). Conversation effects on neural mechanisms underlying reaction time to visual events while viewing a driving scene using MEG. Brain Research, 1251, 151-161. Curry, R. C., Greenberg, J. A., & Kiefer, R. J. (2005). NADS versus CAMP closed-course comparison examining “last second” braking and steering maneuvers under various kinematic conditions. Final Report to Crash Avoidance Metrics Partnership (CAMP), Contract DTFH61-01-X-00014, Washington, DC, August, DOT HS 809 925. Engström, J., Johansson, E., & Östlund, J. (2005). Effects of visual and cognitive load in real and simulated motorway driving. Trans. Res. Part F: Traffic Psych. and Behaviour, 8(2), 97-120. Harms, L., Alm, H., & Tornos, J. (1996). The influence of situation cues on simulated driving behaviour: A summary of three validation studies. Symp. on the Design and Validation of Driving Simulators. ICCTP '96. Valencia. Harms, L.& Patten, C. (2003). Peripheral detection as a measure of driver distraction. A study of memory-based versus system-based navigation in a built-up area. Transportation Research Part F, 6, 23-36.
274
PROCEEDINGS of the Fifth International Driving Symposium on Human Factors in Driver Assessment, Training and Vehicle Design
Horrey, W. J. & Wickens, C. D. (2006). Examining the impact of cell phone conversations on driving using meta-analytic techniques. Human Factors, 48(1), Spring, 196-205. Hsieh, L., Young, R. A., Bowyer, S. M., Moran, J. E., Genik II, R. J., Green, C. C., Chiang, YR., Yu, Y-J, Liao, C-C., & Seaman, S. (2009). Conversation effects on neural mechanisms underlying reaction time to visual events while viewing a driving scene: fMRI analysis and Asynchrony Model. Brain Research, 1251, 162–175. Jahn, G., Oehme, A., Krems, J. F., & Gelau, C. (2005). Peripheral detection as a workload measure in driving: Effects of traffic complexity and route guidance system use in a driving study. Transportation Research Part F: Traffic Psychology and Behaviour, 8(3), 255-275. Klauer, S. G., Dingus, T. A., Neale, V. L., Sudweeks, J., & Ramsey, D. (2006). The impact of driver inattention on near-crash/crash risk: An analysis using the 100-car naturalistic driving study data. Virginia Tech Transportation Institute, Blacksburg, VA. Sponsored by National Highway Traffic Safety Administration, Washington, DC, DOT HS 810 594. Lee, H. C., Cameron, D., & Lee, A H. (2003). Assessing the driving performance of older adult drivers: On-road versus simulated driving, Accident Analysis & Prevention, 35(5), 797-803. Martens, M. H., & van Winsum, W. (2000). Measuring distraction: The Peripheral Detection Task. TNO Human Factors, Soesterberg, The Netherlands. McGinty, V. B., Shih, R. A., Garrett, E. S., Calhoun, V. D., & Pearlson, G. D. (2001). Assessment of intoxicated driving with a simulator: A validation study with on-road driving. Proceedings of the Human Centered Trans Sim Conference. Iowa City, IA, 11. Schreiner, C. S., Blanco, M., & Hankey, J. M. (2004). Investigating the effect of performing voice recognition tasks on the detection of forward and peripheral events. HFES 2004: Proc. of the Human Factors & Ergo. Soc. 48th Annual Mtg, Sept., New Orleans, LA, 2354-2358. Yan, X., Abdel-Aty, M., Radwan, E., Wang, X., Chilakapati, P. (2008). Validating a driving simulator using surrogate safety measures. Accident Analysis & Prevention, 40(1), 274-288. Young, R. A. (2001). Association between embedded cellular phone calls and vehicle crashes involving airbag deployment. Proceedings of Driving Assessment 2001: The First International Driving Symposium on Human Factors in Driver Assessment, Training and Vehicle Design. Aspen, Colorado, 390–400. Young, R. A. & Angell, L. S. (2003). The dimensions of driver performance during secondary manual tasks. Proceedings of Driving Assessment 2003: 2nd International Driving Symposium on Human Factors in Driver Assessment, Training and Vehicle Design, Park City, Utah. Young, R. A., Aryal, B. J., Muresan, M., Ding, X., Oja, S., & Simpson, S. N. (2005). Road-tolab: Validation of the static load test for predicting on-road driving performance while using advanced in-vehicle information and communication devices. Proceedings of the Third International Driving Symposium on Human Factors in Driver Assessment, Training and Vehicle Design, Rockport, Maine. Young, R. A. & Schreiner, C. S. (2009). Real-world personal conversations using a hands-free embedded wireless device while driving: Effect on airbag-deployment crash rates. Risk Analysis, 29(2), 187-204.
275