considered to estimate shielding in diagnostic radiology. One of them is the transmission of photons through ... used lead and concrete as shielding material in.
2007 IEEE Nuclear Science Symposium Conference Record
N15-435
Validation on GEANT4 use applied to estimate transmission curves to diagnostic energies to concrete and lead Gabriela Hoff, Sandro F Firmino Pontifícia Universidade Católica do Rio Grande do Sul, Grupo de Experimentação e Simulação Computacional em Física Médica, Porto Alegre, RS, Brazil. Abstract - On these days, different parameters considered to estimate shielding in diagnostic radiology. One of them is the transmission of photons through different materials, since know named transmission. The transmission curve as function of different material thickness is a base to estimate shielding thickness. Commonly are used lead and concrete as shielding material in diagnostic radiology area. Data actually used on these calculations were published by Archer, Simpkin and Legare. The simulated data show estimated error lower than 9.5 % when compared to published data Archer and Simpkin to 120 kVp spectrum to shielding thickness between 0.5 and 2.0 mm. Simulated data to thicker shielding presented higher errors due the low photons fluency. Considering 90 kVp spectrum and concrete shielding the simulated data show errors lower then 20 % comparing to Legare. To thicker shielding the photon fluency makes the errors increase. The simulated data validate the GEANT4 and its low energy library on transmission estimative played to diagnostic radiology. We suggest new work on this theme and considering other materials used to build diagnostic radiological shielding in Brazil.
Methodology We built the realistic computational universe considering: one source point irradiating in a solid angle of 5.2°; a polienergitic spectra from "Catalogue of Diagnostic X-Ray Spectra and [3] Other Data" ; an aluminum add filtration 3.0 mm thicker; sensitive volume-source distance of 1.1 m; a wall 1.0 m distance to source 1.60 m higher and 1.60 m larger with different thickness according the shielding composition. The concrete composition was [4] selected according NIST specifications . On 8 these simulations were generated 10 histories. Were simulated the KERMA free in air collected by a sensitive volume is the ratio between with the shielding wall (Ki) and without the shielding wall (Ko). The Equation 1 results in the transmission data.
T=
0
60keV 70keV 80keV 90keV 100keV
-1
10
110keV 120keV 130keV 140keV 150keV TRANSMISSION
TRANSMISSION
10
-2
10
-3
10
60 keV 70 keV 80 keV 90 keV 100 keV
0
10
-1
10
-2
10
-3
10
-4
10
-5
-4
10
(1)
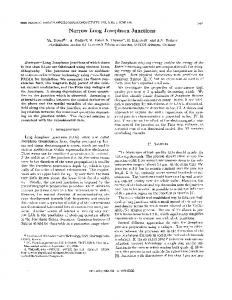
Results and analysis The simulated data on this work was the basis to built graphics (see Figure 1) that can be used to determine transmission data applied to diagnostic area. When compared to published [1] data than 9.5 % to the spectrum of 120 kVp to shielding thickness between 0.5 and 2.0 mm. Simulated data to thicker shielding presented higher errors because the low photons fluency. Considering a spectrum of 90 kVp and concrete shielding the simulated data show errors lower than 20 % comparing [1] to Legare . To thicker shielding the photon fluency makes the errors increase
Introduction On these days, different parameters considered to estimate shielding in diagnostic radiology. One of them is the transmission of photons through different materials, since know named transmission. The transmission curves as function of different material thickness in a base to estimate shielding thickness. Commonly are used lead and concrete as shielding material in diagnostic radiology area. Data actually used on these calculations were [1] [2] published by Archer and Simpkin to lead [1] [2] and Legare Simpkin to concrete. 10
Ki Ko
110 120 130 140 150
-5
10
0.00
0.25
0.50
0.75 1.00 1.25 THICKNESS [mm]
1.50
1.75
0 .0
2.00
2 .5
5.0
7 .5
1 0 .0
1 2 .5
15.0
T H IC K N E S S [ c m ]
Figure 1: Graphics showing the transmission estimated curves as function of shielding material thickness from 60 kVp up to 150 kVp, in steps of 10 kVp (a) to lead and (b) to concrete.
1-4244-0923-3/07/$25.00 ©2007 IEEE.
907
keV keV keV keV keV
908
-9.4% -9.3%
-3.4%
-4.0%
-2.4%
-2.6%
60
70
80
90
-2.7% -2.1%
5.0 -8.0%
0.0% 0.0%
-0.8%
-1.6%
-1.3%
-1.8%
-1.3%
2.5
-2.4%
-2.6%
-1.6%
-0.8%
-1.6%
-1.3%
-1.8%
-1.3%
0.0%
0.0%
110
120
130
140
150
Energy [keV]
60
70
80
90
100
110
120
130
140
150
0.0%
0.0%
-6.5%
-5.4%
-5.0%
-6.4%
-5.3%
-5.7%
-7.2%
-10.2%
7.5
-6.5%
-5.4%
-5.0%
-6.4%
-5.3%
-5.7%
-7.2%
-10.2%
-12.8%
-20.0%
0.75
-14.2%
-13.2%
-8.5%
-10.8%
-9.3%
-9.7%
-16.7%
-21.0%
-32.9%
NA
1.25
0.0%
0.0%
-7.0%
-9.0%
-7.2%
-7.8%
-6.6%
-7.6%
-10.4%
-18.9%
10.0
0.0%
0.0%
-14.2%
-13.2%
-8.5%
-10.8%
-9.3%
-9.7%
-16.7%
-21.0%
12.5
Thickness [cm]
-7.0%
-9.0%
-7.2%
-7.8%
-6.6%
-7.6%
-10.4%
-18.9%
20.6%
43.6%
1.00
Thickness [mm]
0.0%
0.0%
-15.8%
-15.2%
-12.0%
-18.4%
-11.4%
-12.5%
-20.6%
NA
15.0
-15.8%
-15.2%
-12.0%
-18.4%
-11.4%
-12.5%
-20.6%
-24.3%
-40.4%
NA
1.50
* The NA represent data does not used by does not present statistic significance.
-2.1%
-2.7%
-3.9%
-3.0%
-2.3%
-3.2%
-4.6%
-3.9%
-3.0%
-2.3%
-1.6%
100
-3.2%
-4.6%
-8.0%
0.50
0.25
Energy [keV]
0.0% 0.0%
0.0%
-23.6%
-23.2%
-22.9%
-21.5%
-21.8%
-24.0%
NA
NA
20.0
-23.6%
-23.2%
-22.9%
-21.5%
-21.8%
-24.0%
-30.5%
-43.2%
NA
NA
2.00
0.0%
-18.8%
-18.8%
-16.4%
-22.3%
-16.3%
-17.6%
-25.9%
NA
17.5
-18.8%
-18.8%
-16.4%
-22.3%
-16.3%
-17.6%
-25.9%
-30.2%
0.0%
NA
1.75
T =-0.09283-0.18517 X+0.00281 X²
T =-0.08221-0.20614 X+0.00281 X²
T =-0.06214-0.23776 X+0.00375 X²
T =-0.05587-0.25228 X+0.00366 X²
T =-0.06464-0.28704 X+0.00475 X²
T =-0.08232-0.3287 X+0.00632 X²
T =-0.13911-0.3569 X+0.00745 X²
T =-0.16354-0.39959 X+0.00953 X²
T =-0.15959-0.46125 X+0.01038 X²
T =-0.18327-0.60786 X+0.01636 X²
Tendency Curves
T =-0.03061-2.66683 X+1.0844 X²-0.243 X³
T =-0.03946-2.82289 X+1.25363 X²-0.29123 X³
T =-0.05173-2.87675 X+1.27044 X²-0.28641 X³
T =-0.05238-3.08229 X+1.50628 X²-0.35549 X³
T =-0.06105-3.2527 X+1.61969 X²-0.37184 X³
T =-0.06748-3.64325 X+2.08754 X²-0.52952 X³
T =-0.11646-3.40525 X+1.27867 X²-0.24182 X³
T =-0.08742-4.48158 X+2.32978 X²-0.60188 X³
T =-0.16346-4.6743 X+1.18926 X²
T =-0.10364-6.49884 X+1.93879 X²
Tendency Curves
0.9897
0.9932
0.9959
0.9943
0.9928
0.9954
0.9922
0.9904
0.9930
0.9884
R²
0.9987
0.9977
0.9967
0.9965
0.9957
0.9960
0.9907
0.9965
0.9913
0.9915
R²
Table2: Deviation in percentage on data generated in this work to concrete material compared to Simpkin data and tendency curves with the respective R2 result, to all studied energies.
LEAD
CONCRETE
Each simulated point were compared to [2] Simpkin published data. The Table 1 shows the deviation data in percentage to lead and concrete, respectively, considering Simpkin data the standard to compare. This table presents the generated tendency curves and the R2 statistic results to our data. As was expected the error on simulated data increase when the shielding thickness increases, because the photon fluency decrease in this situation. Conclusions and suggestions The results presented in this work validate the use of GEANT4 to simulate transmission curves applied to diagnostic area. The simulated data show estimated error according other published data. That way we suggest new works on this theme considering other materials used to build diagnostic radiological shielding. References [1] NATIONAL COUNCIL ON RADIATION PROTECTION AND MEASUREMENTS (NCRP) "Structural Shielding Design for Medical X-Ray Imaging Facilities", Report nº147, 2005. [2] Simpkin D.J. "Transmission data for shielding diagnostic X-ray facilities", Health Physics, vol 68, n. 5. p. 704 - 709. May, 1995. [3] CRANLEY, Kieran et al. Catalogue of Diagnostic Xray Spectra and Other Data. Report No 78. The Institute of Physics and Engineering in Medicine, 1997. [4] National Institute of Standards and Technology - NIST X-Ray Mass Attenuation Coefficients, http://physics.nist.gov/Phys RefData/XrayMassCoef/tab2.html, march, 2005. Last up data: July, 2004.
909