Variability in Compression Strength and Deflection of Corrugated Containers as a Function of Positioning, Operators, and Climatic Conditions J. SINGH l .*, P. BAINBRIDGE2 , S. P. SINGH3 and E. OLSEN4 lAssociate Professor, Industrial Technology, Cal Poly State University, San Luis Obispo, CA. 2 Research Assistant, Industrial Technology, Cal Poly State University, San Luis Obispo, CA. 3Professor, School of Packaging, Michigan State University, East Lansing, MI 4Assistant Professor, Industrial Technology, Cal Poly State University, San Luis Obispo, CA. ABSTRACT: ASTM D642 is a commonly used standard for measuring the ability of containers to resist external compressive loads applied to its faces, to diagonally opposite edges, or to corners. The procedure recommends testing by centering the specimen on the lower platen of the testing machine in the desired orientation, so as not to incur ec centric loading. It is also recommended by the standard that the load be applied with a continuous motion of the movable platen of the test ing machine at a speed of 0.5 ± 0,1 in. (12.7 ± .25 cm)/min until failure or a specified load, has been reached. It is recommended that the tests be conducted at "standard environmental" conditions of 23°C and 50% relative humidity. However, the vast majority of compression testers are not placed in rooms where humidity is controlled and multi ple operators may perform the tests thereby increasing the possibility of variation of reported data. No recent studies involving the effect of variation in the container location or the test speed on the compres sion strength values, however, are available. This study tested over 400 C-flute RSC style boxes for 15 locations of the containers and ten platen speeds. Repeatability for selecttest conditions was also tested. The results reported in this paper show a significant reduction in the compression values by as much as 10.7% and an increase in defec tion by as much as 19.2% for the boxes with the variation in location. Changes in platen velocity and operators significantly affect compres sion and deflection testing.
*Author to whom correspondence should be addressed. Email:
[email protected]
Journal of Applied Packaging Research, Vol. 2, No.2-December 2007 1557·7244/07/02 089-14 © 2008 DEStech Publications, Inc.
89
90
J. SINGH, P. BAINBRIDGE, S. SINGH and E. OLSEN
1.0 INTRODUCTION HE role of testing in the development and evaluation of packaging
T systems has become an important function in today's corporate manufacturing and development practices. The use oflab testing to eval uate the functionality of a product and package is often preferred to real life testing because it can be better controlled and evaluated. Real-life testing, often more representative, is difficult to repeat since the inten sity varies with each shipment, and also becomes expensive and time consuming. Various standards organizations use technical committees to develop methodologies that are repeatable and provide a representa tive simulation of the hazards that will affect a package and the product with a high degree of precision. The American Standards for Testing and Materials International (ASTM) Committee D-l 0 is one of the largest sources of packaging test methods both in the United States and overseas. The standards are devel oped by various technical committees that enjoy a strong participation by industry, federal/state departments, trade organizations and acade mia. This D-l 0 committee has been extremely successful in developing a comprehensive set of standards and practices covering both the broad and narrow segments of various aspects of packaging. ASTM D642, Standard Test Method for Determining Compressive Resistance of Shipping Containers, Components, and Unit Loads, is a primary test method used to test shipping containers for their ability to resist external compressive loads [1]. This test method is related to Tech nical Association of the Pulp and Paper Industry (TAPPI) T804, which is similar for fixed platen equipment but does not recognize swivel platen machines [2]. ASTM D648 also fulfills the requirements ofInter national Organization for Standardization (ISO) Test Method 12048 [3]. The ability of a shipping container to resist compressive forces experi enced during storage and distribution in the supply chain is often evalu ated using a compression tester. Test procedures such as ASTM D642, are typically used to perform laboratory based testing because they im plement standardization, may it be within a facility or between different testing labs. This in tum decreases the repeatability and reduces reproducibility errors. This study was initiated due to a lack of reference studies that rein force the test procedure described in ASTM D642. Specifically the fol lowing steps in the test procedure were targeted for this study:
Variability in Compression Strength and Deflection
91
1. The procedure for compression testing as per ASTM D642 requires centering of the shipping unit on the lower platen of the compression tester in the desired orientation so as not to incur eccentric loading. Although the procedure cautions with regards to obtaining erratic data due to off-centering of the package on the platen, it does not pro vide references to any studies related to the topic, and the effect of off-centering on measured loads. 2. The procedure also requires the shipping units be tested at the platen speed of 0.5 ±O.l in. (12.7 ±0.25 cm) per minute. whether testing the sample to failure or a specific load. Again, no referenced studies rein force this. 3. Lastly tests conducted by multiple operators in labs that are generally only controlled for temperature but not for humidity have also not been studied. The goal of this study was: 1. To study the effect of variation in platen velocity and corrugated box placement on the bottom platen of the compression tester on the mea sured compression strength and deflection. 2. To study the effect of variation of humidity levels in labs that only have temperature controlled environments using the same boxes but different operators during different parts of the year.
2.0 MATERIALS AND METHODS A Lansmont Model 152-30 compression test unit was used for this study. This machine was calibrated at the initiation of the study. The servo-hydraulic compression test system used had a 60 inch (1.52 m) square platen, an 84 inch (2.13 m) opening and a maximum force rating of 30,000 pounds (13,608 kg). Approximately 400,20" x 16" x 10" (50.8 x 40.6 x 25.4 cm) Regular Slotted Container (RSC) style corrugated shippers were constructed us ing ArtiosCAD software and Kongsberg sample cutting table. The cor rugated board used was 200 pound (90.72 kg) C-flute in construction. The manufacturer's edge on all boxes was sealed with polymer based glue and all flaps were taped using a two inch wide pressure sensitive tape. All shippers were conditioned for 24 hours at 23 ± 1°C (73.4 ± 2°P) and 50 ± 2 % relative humidity as per ASTM D4332-0l [4].
92
J. SINGH, P. BAINBRIDGE, S. SINGH and E. OLSEN
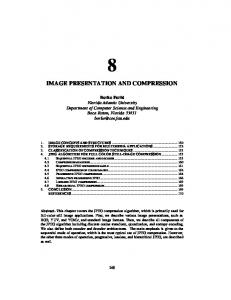
Figure 1. Experimental Setup.
After being formed the compression tests were conducted in a temper ature controlled lab. The temperature and humidity conditions associ ated with the measured values were documented for each box tested.
2.1 Test Method The corrugated shippers were centered on the diagonal between diag onally opposite corners and moved outwards from the center of the bot tom platen in increments of four inches. The platen speed was varied be tween 0.1 in (0.25 em) per minute and 1.0 in (2.54 em) per minute with speed increments of 0.1 in (0.254 em) per inch. Figure 1 shows the ex perimental setup. The test method included of the following steps: 1. Using a plumb line and bob, the boxes were centered at the desired lo cation. The center of the bottom platen was the starting point for all tests and the boxes were moved outwards on one of the diagonal lines between two diagonally opposite corners in increments offour inches (10.2 em) till 28 inches (71.12 em) from the center of the platen. 2. Using increments of 0.1 in (0.25 em) per minute, the platen speed was varied between 0.1 in (0.25 em) per minute and 1.0 in (2.54 em) per minute. 3. Compression testing was conducted till failure and the maximum compression strength and deflection measured. 4. Replicates for all variables (box location and test speed) are shown in Table 1.
Table 1. Average Compression and Deflection Chart. Distance from Center of Platen (em)
Compression Avg (N)
2867
0.0
5.1
10.2
15.2
20.3
25.4
30.5
35.6
40.6
45.7
50.8
55.9
61.0
66.0
71.1
2968
3010
2830
2845
2930
2894
2900
2948
2903
2783
2946
2839
2691
2833
2651
Deflection Avg (em)
1.07
0.99
0.99
0.95
1.02
1.00
1.08
1.08
1.14
1.09
1.06
1.19
1.17
1.15
1.08
1.18
Sample size
191
24
8
15
10
15
10
15
10
15
9
15
9
15
7
14
0.25
'E Gi ;:,
0.51
2732 1.02 15
0.76
2827 1.08 22
I:
---E
~
I:
Gl
III
ii: 0
~ lJ
2556 1.10 12
1.02
2848 1.05 23
1.27
2864 1.04 33
0
~
Df
iii· 0
~ S·
() 0
*
*
1
1
1
1
1
1
1
1
1
1
1
*
1
3
""0
~
en en
1
1
1
1
1
1
1
1
1
1
1
1
1
1
1
o' :::s C/) ~
~ SI:ll :::s
to
2
1
2
1
2
1
2
1
2
1
2
1
2
2
*
Q.
D (1) 2
1
2
1
2
1
2
1
2
1
2
1
2
1
2
::::!! (1)
()
g.
:::s 12
1
2
1
2
1
2
1
2
1
2
1
2
1
2
"Data point removed as outlier. See section on check of regression assumptions. Temperature range from 17.2°C to 20.3°C with a mean of 19.9. Humidity from 31.2 to 47.8% RH with a mean of 40.4. (continued)
to W
(£) ~
Table 1 (continued). Average Compression and Deflection Chart. Distance from Center of Platen (cm)
0.0
5.1
10.2
15.2
20.3
25.4
30.5
35.6
40.6
45.7
50.8
55.9
61.0
66.0
71.1 ~
Compression Avg (N)
2867
2968
3010
2830
2845
2930
2894
2900
2948
2903
2783
2946
2839
2691
2833
2651
Deflection Avg (cm)
1.07
0.99
0.99
0.95
1.02
1.00
1.08
1.08
1.14
1.09
1.06
1.19
1.17
1.15
1.08
1.18
Sample size
191
24
8
15
10
15
10
15
10
15
9
15
9
15
7
14
:u
III ::D 0 (j)
2
1
2
1
2
1
2
1
2
1
2
1
2
1
2
2968 1.06 23
2
1
2
1
2
1
2
1
2
1
2
1
2
1
2
2.03
3048 1.17 14
1
1
1
1
1
1
1
1
1
1
1
1
1
*
1
2.29
2909 1.09 15
i
:::J
l:
'E E
1.78
~
.. l: Gl
..!1!
a.. 0
> :t:: u
~
2913 1.09 23
1.52
0
~ 2.54
2933 1.14 11
en Z (j) :::c Z
m
en en Z (j) :::c III ::::J
a.
1
1
1
1
1
1
1
1
1
1
1
1
1
1
1
m 0 r
en
m 1
*
1
1
1
*Data point removed as outlier. See section on check of regression assumptions. Temperature range from 17.2°C to 20.3°C with a mean of 19.9. Humidity from 31.2 to 47.8% RH with a mean of 40.4.
i
i
i
i
*
i
*
i
1
*
Z
Variability in Compression Strength and Deflection
95
3.0 DATA AND RESULTS This study examined the effect of platen speed, location of the box, and humidity variations on the compression strength and deflection val ues resulting from testing the box as representative in a majority of the package testing labs. This section provides the summarized data and sta tistical analysis of the same. Deflection is the difference between the box heights atthe beginning of the test to that at the end. It is a measure of how much a box is com pressed at the end of a test. Compression strength values of packages commonly include the deflection at failure or at the end of a specific load application. The table below shows the average results for compression strength and deflection for a given velocity and location. The data in Table 1 shows the relationship between the location of the box, the platen speed, and the two dependent variables of interest: com pression strength and the deflection. It accounts for the variability of op erators and climatic conditions that occurred during the tests. It shows that as the box gets further and further away from the center ofthe platen, the box defection increases and compressive strength decreases. The data also shows that the velocity of the platen does not greatly affect ei ther deflection or compression strength values. During the four month period of the study, the temperature range varied from 17.2 to 20.3 DC with a mean of 19.9 D C and the relative humidity ranged from 31.2 to 47.8% with a mean of 40.4%. 3.1 Statistical Analysis Three analyses pertaining to the study were performed using multivariate statistics. The first involved verifying the repeatability of the tests. The second examined whether the mean velocity of the platen and the distance from the center of the platens significantly affected the compression strength and deflection results. The third analysis exam ines whether the variability or repeatability of the test is affected by ve locity and distance. In all analyses, temperature and humidity were ei ther included in the analysis with no significant effect or treated as random control variables. 3.1.1 Verification of Test Repeatability To verify that the test results were repeatable, a gage repeatability
96
J. SINGH, P. BAINBRIDGE, S. SINGH and E. OLSEN
ANOVA was run for compression strength and deflection on a subset of the data (n = 80) for which two repeated measures were made for each of five platen velocities (45.7 to 106.7 em/minute) over a range ofeight dis tances (0 to 71cm). The measures made underrepeated conditions ofve locity and distance were not significantly different for either compres sion (P = 0.24) or deflection (P = 0.06) indicating that the test is repeatable. The average difference in repeated measures for compres sion was 99.1 N with a standard deviation of 315.6 and for deflection was 0.072 cm with a standard deviation of 0.26. Temperature and hu midity were not explicitly controlled in this analysis, however the non-significant result indicates that repeatability is not affected by tem perature and humidity over the range tested.
3.1.2 Test ofPlaten Velocity and Distance Main Effects The main objective ofthis research was to evaluate if the platen veloc ity and distance from the center have a significant effect on compression and deflection test results. To analyze the effects of velocity and dis tance a regression model was created with compression and deflection as the dependent variables. The data consisted of 200 individual tests. Table 1 provides a summary of the data. Temperature and humidity en tered the model first as control variables. The dependent variables of in terest were velocity, distance, and their interaction. 3.1.2.1 Check ofRegression Assumptions Regression assumptions and influential observations were evaluated [5]. Initial regressions were run for compression and deflection, fol lowed by tests for violation of regression assumptions regarding nor mality, constant variance, and unusual observations and outliers. Nine data points were removed after being identified as unusual based on hav ing high Cook's Distance values relative to the other 191 data points based on examination of box plots. Cook's Distance measures a combi nation of high leverage and high residual values. Constant variance was verified by examining plots of residuals versus predicted fits. Normal plots of residuals were relatively straight. This observation, along with the large final sample size of 191 data points, makes problems associated with non-normality unlikely. 3.1.2.2 Compression Results The results of regression analysis are provided in Table 2. Only the
Table 2. Regression Analysis for Compression. Model SummaryC Change Statistics Model 1
2
R
R Square
Adjusted R Square
0.241 8 0.424 b
0.058 0.180
0.048 0.158
Std. Error of the Estimate
R Square Change
F Change
df1
df2
Sig. F Change
275.7212 259.3147
0.058 0.122
5.783 9.181
2 3
188 185
0.004 0.000
8Predictors: (Constant), temperature humidity bpredictors: (Constant), temperature humidity, distance, velocity, vxd cDependent Variable: Compression
~
iii·
Q:
~
S·
i
til(I) (I)
g' C/)
q-
ANOVAC Model Regression Residual Total
2
Regression Residual Total
Sum of Squares
df
Mean Square
F
Sig.
879292.5 14292171 15171463
2 188 190
439646.234 76022.185
5.783
0.0048
2731304 12440159 15171463
5 185 190
i
III ::J
0..
li?
:::.!:
546260.886 67244.101
8.124
O.OOOb
Cll
n
g'
8Predictors: (Constant), temperature humidity bpredictors: (Constant), temperature humidity, distance, velocity, vxd cDependent Variable: Compression (continued)