Variance Reduction and Signal-to-Noise Ratio: Reducing. Uncertainty in Spectral Ratios by Olga-Joan Ktenidou,* Francisco J. Chávez-GarcÃa, and Kyriazis D.
Bulletin of the Seismological Society of America, Vol. 101, No. 2, pp. 619–634, April 2011, doi: 10.1785/0120100036
Variance Reduction and Signal-to-Noise Ratio: Reducing Uncertainty in Spectral Ratios by Olga-Joan Ktenidou,* Francisco J. Chávez-García, and Kyriazis D. Pitilakis
Abstract
This paper uses an unusually large dataset to study scatter in site-effect estimation, focusing on how the events that increase uncertainty can be removed from the dataset. Four hundred seventy-three weak motion earthquake records from the surface and bedrock of a 178-m-deep borehole in Aegion, Gulf of Corinth, Greece, are used to evaluate spectral ratios. A simple statistical tool, variance reduction (VR), is first used to identify two groups of events that lie closest and farthest from the average, which is considered here as the initial best estimate of the site response. The scatter in the original dataset is found to be due to the group of events with smallest VR. These events can be removed from the dataset in order to compute a more reliable site response. However, VR is not normally used to choose records for siteeffect studies, and it cannot be applied to the usual small datasets available. The signal-to-noise ratio (SNR) is normally used to this end, for which reason we investigate whether SNR can be used to achieve similar results as VR. Signal-to-noise ratio is estimated using different definitions. Data selection based on SNR is then compared to that using VR in order to define an SNR-based criterion that discriminates against events that, according to VR, increase scatter. We find that defining the SNR of a surface record as the mean value over a frequency range around the resonant peak (here, 0.5–1.5 Hz) and using a cutoff value of 5 may be used in this case to exclude most events for which VR is small. This process is also applied to the downhole station, where we obtain similar results for a cutoff value of 3.
Introduction produce estimates of local amplification based on a dozen or less recorded events. Small datasets may make it problematic to even define an average transfer function. In this paper we use an exceptionally large dataset consisting of 473 small earthquakes recorded by the vertical array CORSSA (Corinth Soft Soil Array) installed near the city of Aegion, in the Gulf of Corinth, Greece. This large dataset allows us to investigate the scatter of spectral ratios. We examine whether certain events in our dataset contribute more than their share to the scatter about the average value and how these can be found and removed using two methods, the signal-to-noise ratio (SNR) and variance reduction. Variance reduction (VR) is a simple statistical tool that evaluates goodness-of-fit between observations and predictions of a model. It has often been used in the determination of fault plane solutions. In this paper, thanks to the large number of events, we can use VR to estimate the agreement between an individual spectral ratio and the average spectral ratio for the complete dataset, considered as the initial best estimate. We can use VR to classify individual events in terms of how near or how far their ratios lie from the average. Those events lying farthest from the average can then be rejected.
Site effects are often estimated using spectral ratios of earthquake data. The most usual are spectral ratios relative to a reference site, which are often called standard spectral ratios (SSR; e.g., Borcherdt, 1970; Chávez-García et al., 1990) and horizontal-to-vertical spectral ratios (HVSR), where horizontal component spectra are divided by the vertical component spectra recorded at the same site (e.g., Lermo and Chávez-García, 1993). If many records are available, higher quality data are often chosen based on signal-tonoise ratios. However, even when data quantity is satisfactory and data quality is acceptable, the scatter in the estimates of site amplification may be great. The reasons have been discussed previously (e.g., Jarpe et al., 1988; Chávez-García et al., 1990). If it were possible to detect the events that contribute most to our scatter and remove them from the dataset, then we would be able to decrease the uncertainty in siteeffect prediction. The scatter of site-effect estimates is not often studied. Indeed, standard site-effect studies often use spectral ratios to *Now at Institut de Radioprotection et de Sûreté Nucléaire (IRSN) DEI/SARG/BERSSIN, BP 17, 92262 Fontenay-aux-Roses, Cedex, France.
619
620
O.-J. Ktenidou, F. J. Chávez-García, and K. D. Pitilakis
Variance reduction, however, cannot be used to screen small datasets. In these cases, data quality is usually assessed using SNR. When we select events based on SNR, we choose whether to include the spectral ratio of a particular event in the computation of the average based on whether a criterion regarding the ratio between signal and noise is met. Varying SNR criteria are used here, and we search for the SNR criterion that best reproduces the record selection obtained using VR. Thus, we are able to propose an SNR selection criterion that best matches the selection made through VR and that may be used to choose events in the smaller datasets usually available to estimate site effects.
As defined in equation (1), VR assumes values within the range ��∞; 1�. It equals 1 when there is a perfect match between expected and observed values, while as values become smaller they indicate poorer fit. Equation (1) resembles the chi-square fit test, but the normalization of the residuals is made with respect to the data amplitude rather than to the standard deviation. Evidently, if we do not know the local amplification, it is not possible to evaluate VR. We do not have a model that we can trust completely to predict site amplification at Aegion. However, the sheer size of our dataset makes for a very robust observed average amplification. It is this average transfer function that will allow us to compute VR.
Signal-to-Noise Ratio and Variance Reduction Signal-to-noise ratio is often used in site response studies to choose higher quality data from the available dataset. According to Borcherdt (1970), SSR in the frequency band where SNR is high should isolate local site effects. Signal-tonoise ratio is usually defined in this context as the ratio of the Fourier spectrum of the signal time window by the spectrum of the pre-event noise. The length of these windows can vary greatly. Both acceleration and velocity data yield similar SNR (Jarpe et al., 1988). Ratios for the two horizontal components are usually computed independently, producing comparable (Borcherdt and Gibbs, 1976; Kato et al., 1995; Lachet et al., 1996) or dissimilar results (Wong et al., 1977). Signal-tonoise ratio depends on frequency and decreases rapidly beneath 0.4–1 Hz for small earthquakes (Malagnini et al., 1996; Steidl et al., 1996). When computing spectral ratios, SNR is usually evaluated in the frequency domain, its spectral amplitude values are compared with a chosen cutoff threshold, and data whose SNR fall below this value are removed. The lowest SNR cutoff value used is 2 (e.g., Borcherdt and Gibbs, 1976; Rogers et al., 1984; Darragh and Shakal, 1991; Satoh et al., 2001; Lozano et al., 2009). Most studies use the value of 3 (e.g., Field and Jacob, 1995; Theodulidis et al., 1996; Lachet et al., 1996; Bonilla et al., 1997, 2002; Di Giacomo et al., 2005; Sawazaki et al., 2009). Riepl et al. (1998) report that their results are no different for thresholds of 3 or 5. Jarpe et al. (1988), Cramer (1995), and Thompson et al. (2009) use a cutoff value of 5, while Steidl et al. (1996) and Malagnini et al. (1996) use a value of 10. Contrary to SNR, variance reduction (VR) is not usually applied in site-effect studies, but rather in source studies (e.g., Chi et al., 2001; Skarlatoudis et al., 2003; Scherbaum et al., 2004). Variance reduction may also be used to discriminate between higher and lower quality data. Variance reduction is defined in different ways according to different authors. In this paper, we define VR as X�discrepancy�2 ; (1) VR � 1 � observation where the term discrepancy means the difference between an observation and an expected value based on a model.
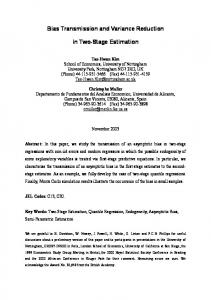
Data and Spectral Ratios Our dataset comes from the Corinth Soft Soil Array (CORSSA; see the Data and Resources section), which is installed near the city of Aegion, in the southern part of the Gulf of Corinth, Greece, one of the most active seismic areas in Europe (Fig. 1). Aegion is crossed by a fault with an escarpment of roughly 80 m that, as shown in the cross-section, divides it in two levels. CORSSA vertical array is installed in the northern, lower part of the city, very near the coast. The soil profile at that point is known through various previous surveys (Pitilakis et al., 2004) to consist of soft, loose materials underlain by a stiff conglomerate (V S > 800 m=s) at 155 m depth. The actual seismic bedrock is the limestone formation (V S > 1500 m=s), which lies at some 700 m, according to the cross-section of Figure 1 (Apostolidis et al., 2006). The array consists of four broadband 3D accelerometers at depths of 14, 31, 57, and 178 m, and one at the surface. The deepest accelerometer is located in the conglomerate formation; although this material is not as stiff as the limestone, it has been shown (Ktenidou, 2010) that the station can be used as reference (the average HVSR value at depth for events used in the present study is near unity in the 0.1–10 Hz range). The dataset used consists of 473 earthquakes recorded over a period of 6 years since the array began to operate in 2002. Figure 2 shows the epicentral distribution. This dataset has been used previously to evaluate site effects (Ktenidou, 2010), showing the large importance of the geometry of the sediments relative to the Aigion fault. For this reason, the horizontal components studied here are rotated to the radial and transverse components with respect to the fault escarpment. All data are weak motion, and only records from the surface and deepest stations are analyzed here. The data were processed as follows. Time-histories were synchronized, baseline-corrected, and 10% cosine-tapered at the edges. They were band-pass-filtered between 0.2 and 15 Hz using a zero-phase Butterworth filter with four poles. Then they were rotated to the radial and transverse directions relative to the Aigion fault. Fourier spectra were calculated and smoothed four times with a Hanning window and spectral ratios were computed. The spectral ratios were interpolated
Variance Reduction and Signal-to-Noise Ratio: Reducing Uncertainty in Spectral Ratios
621
Figure 1.
Left diagram: location of the city of Aegion, Gulf of Corinth, Greece (adapted from Athanasopoulos et al., 1999). The Corinth Soft Soil Array and the Aegion fault escarpment dividing the city in two levels are marked along with cross-section A–A’. Top right diagram: cross-section A–A’, perpendicular to the slope and to the basin formed by the sediments beneath the Gulf (after Apostolidis et al., 2006). The bottom right table gives the V S for each layer in the cross-section (after Apostolidis et al., 2006). The color version of this figure is available only in the electronic edition.
41°
40°
39°
Latitude N
to a common frequency step for averaging purposes. The average and standard deviation were calculated using the decimal logarithms of the spectral ratio values, assuming that the data follow a normal distribution at all frequencies (this common assumption is investigated in the following section). We also computed the 95% confidence limits of the average value based on a two-tailed t-student distribution. Spectral ratios were computed using complete records (with durations between 41 and 180 s) rather than just an S window. Theodulidis et al. (1996) argue that entire time-histories recorded are better to compute spectral ratios because it is not straightforward to separate wave types due to scattering effects in the signal following P-wave arrival. In the case of our dataset, Ktenidou (2010) found that the results using the complete records and using smaller body-wave windows are similar. We computed HVSR for all surface records and SSR between all surface and 178-m-depth record pairs. The result is shown in Figure 3, where the 95% confidence intervals of the average values are plotted for the three components and standard deviation is shown separately. Both SSR and HVSR show the fundamental frequency of the site to be 0.9 Hz. This has also been estimated through noise measurements and 1D
38°
37°
36°
M