we describe our second generation tools for processing 3D scanned data. In particular, our tools ... agement of very large or very complex sets of range maps.
4th International Symposium on Virtual Reality, Archaeology and Intelligent Cultural Heritage VAST (2003) D. Arnold, A. Chalmers, F. Niccolucci (Editors)
VCLab’s Tools for 3D range data processing M. Callieri, P. Cignoni, F. Ganovelli, C. Montani, P. Pingi, R. Scopigno Istituto di Scienza e Tecnologie dell’Informazione (ISTI) – Consiglio Nazionale delle Ricerche, Pisa, Italy Email: {m.callieri|p.cignoni|f.ganovelli|c.montani|p.pingi|r.scopigno}@isti.cnr.it
Abstract Post-processing of 3D scanned data is still the bottleneck for a wider diffusion of this technology. In this paper we describe our second generation tools for processing 3D scanned data. In particular, our tools support: range maps alignment, range maps merge (or fusion), mesh simplification and color attribute management. This software package has been implemented by scratch and encompasses both up-to-date solutions and some original methods (merging, simplification, color management and, in part, alignment). The paper presents the architecture of the tools, the features supported and algorithms used; finally, an evaluation of its use in the framework of a complex acquisition in the Cultural Heritage domain (3D scanning of a bronze statue) is reported. Categories and Subject Descriptors (according to ACM CCS): I.3 [Computer Graphics]: I.3.3 Picture/Image Generation - Digitizing and scanning
1. Introduction 3D scanning technology evolved considerably in the last few years, both in terms of hardware devices and of algorithms for processing the raw data produced by scanning devices [1]. Many different scanning devices exist, including both academic prototypes and commercial systems. A common classification divides the available optical techniques in: passive systems (e.g. the ones based on the reconstruction from silhouette approach, which returns a nearly complete model of the object but suffers of scarce accuracy); and active systems, which sample the surface by actively projecting a laser or structured light pattern on the object, and measure the geometry of the hit points either by triangulation or time of flight [3]. Most of these active systems produce in output a range map, i.e. a 2D grid of points sampled on the visible surface of the object. A subset of the latter produce geometry + color range maps (i.e. range maps with sampled XYZ and RGB values for each point). The scanning of complex objects is therefore performed by taking a [usually large] set of partially overlapping range scans. The classical pipeline which characterizes a 3D scanning session is rather complex, involving many different operations (introduced in the following section). The available software tools (commercial [13, 23, 12] or academic [15, 16]) are often incomplete and, in some cases, c The Eurographics Association 2003.
they implement rather old and inefficient solutions† . In particular, commercial software often gives unsatisfactory tools for the management of the range maps alignment (especially when the number of range maps is large), for the simplification of the possibly huge meshes produced and limited (or lacking) support for range maps which also hold attribute data (e.g. color). The development of a proprietary set of tools has been justified by the following reasons: • the need of a proprietary and extensible framework which could allow us to research, design and experiment new original solutions; • the need of highly scalable tools able to manage big set of range maps representing highly detailed objects; it is common to acquire hundreds of range maps in real scanning projects, and commercial systems often have hard times in managing in an accurate manner such complex dataset. In this paper we describe our 3D scanning software suite,
† According to the authors experience, the only commercial software which could be considered sufficiently up to date to face the management of large set of range maps is the Inus Technology’ RapidForm system; the pitfalls of this solution are limited to the color data management, the high price of the system and the management of very large or very complex sets of range maps.
Callieri et al / VCLab’s Tools for 3D range data processing
which gives support to all the processing phases of a complex 3D scanning project. Here we present here the second generation of our tools (progressing on the line started 4 years ago [19]). The main technological advances of our tools are: increased automatization of the alignment phase (more than 80% of the work is performed in an automatic manner by the MeshAlign tool); scalability of the system, which allowed us to manage up to 500 range maps in the same project on a standard PC platform (scalability is obtained by endorsing multiresolution and out-of-core techniques in the different post-processing phases); management of the color data and reconstruction of texture maps fit on the output 3D representation. These tools have been tested and assessed in a number of complex scanning projects, and have been given in use to some selected academic partners. On the other hand, our tools do not offer some features managed by other commercial systems, such as the conversion of triangle-based output in freeform NURBS surfaces or tools for the inspection/validation of the results obtained wrt. CAD models.
•
•
•
2. Our 3D scanning tools Scanning an object or an architectural complex entails executing a set of rather complex tasks, which are generally called 3D scanning pipeline: • acquisition planning, to decide the set of range maps (their number, view specification of each of them) to be taken to obtain a complete sampling of the object’s surface; • scanning the artefact from different viewpoints, producing a set of range maps; • range maps alignment, since by definition range map geometry is relative to the current sensor location and has to be transformed into a a common coordinate space where all the range maps lie well aligned; after alignment, the sections of the range maps which correspond to the same surface zone will be geometrically overlapping; • range maps merge (or fusion), to build a single, non redundant mesh out of the many, partially overlapping range maps; • mesh editing, to improve (if possible) the quality of the reconstructed mesh; • mesh simplification, to accurately reduce the huge complexity of the model obtained, producing different highquality Level Of Details (LOD) representations; • and finally, map to the surface mesh the surface attribute data (e.g. color or BRDF sampling). A comprehensive tutorial of the techniques proposed in literature for the above processing has been presented in [1]. We have designed a suite of software tools that manages all of the above phases (excluding the acquisition planning phase, onto which we are now working): • MeshAlign v.2: the module allows the registration of multiple range maps; it adopts a classical approach based on
•
a pairwise local and global alignment [17], implemented with a number of innovations to reduce the user contribution, to improve efficiency and easy of use, and finally to support the management of a large number of range maps (we processed up to six hundreds range maps). MeshMerge: the module allows the reconstruction of a single 3D mesh out of a set of registered range maps. Two different approaches were implemented: a classical volumetric reconstruction approaches based on distance field [8] and a new approach [20] characterized by a lower space complexity, higher efficiency and improved accuracy with respect to the previous, but more sensible to the alignment residual error. MeshEdit: the module allows to perform simple editing actions on the mesh (e.g. to fill small holes, to remove non-manifold components of dangling edges/faces, to apply smoothing filters, etc). MeshSimplify: the module supports the simplification of the [huge] meshes produced by 3D scanning devices, by removing mesh vertices in a controlled manner. The simplification follows the edge collapse approach [11] and has been implemented in an out-of-core fashion in order to allow the management of meshes that could be larger than the core memory of the computer employed [6]. Stitcher & Weaver: the module supports the management of a set of images (either produced by the scanner, or taken with a digital camera) their placement on a 3d model Stitcher and the fusion of the photos to build up a unique texture map wrapped around the 3D model [4].
The above modules are described in the following sections. The whole system has been defined as a suite of independent software modules to reduce the overall complexity, both in terms of graphical user interface (GUI) complexity and efficiency (each module requires appropriate data structures, and therefore having all the modules in a single application would imply the use of more general and expensive data structure. The only modules that require a complex GUI are MeshAlign (alignment is the task that requires an intense interaction with the 3D models) and Stitcher (precise placement of a set of un-calibrated digital photos is a complex task); the design of the GUI of the second version of the MeshAlign tool has been completely redesigned with respect to the previous version [19]. Designing the tools as a set of stand-alone modules, beside the improvement in space occupancy and GUI usability, makes the software design of the whole suite much easier allowing us to build a more robust software system in a smaller time. 3. MeshAlign v.2 This module allows the user to align all the acquired range maps which, by definition, represent the distance of the surface sampled points from the sensor location. Many different locations of the scanner are needed to get a complete c The Eurographics Association 2003.
Callieri et al / VCLab’s Tools for 3D range data processing
Figure 1: The graphic user interface of the MeshAlign v.2 tool.
coverage of the object surface. This means that all these range maps have a different coordinate system and we have to move them in a common reference system. This process, called alignment, is usually solved in a partially manual and partially automatic manner. Automatic approaches have been proposed [14, 21] but are not sufficiently robust to work in any condition. Our tool follows the standard semi-automatic range maps alignment approach: • Initial Pairwise Placement: the first registration step is to locate all the range maps in a single common coordinate system and to provide a first rough registration. This process is done on range pairs: each pair of adjacent and overlapping scans is aligned (one towards another). • Fine Pairwise Registration: after the first step, the scans are finely aligned, usually using an iterative process (ICP) [2] which minimizes the alignment error between each pair of range maps. • Global Registration: the pairwise registration produces good results but, since the error minimization takes place sequentially on mesh pairs, the error tends to accumulate and it may result in significant artifacts after a number of pairwise steps. A solution is to perform a global minimization process which distributes the residual error among all pairs in order to spread the error evenly among all range map pairs [17]. The alignment task is the most time-consuming phase of c The Eurographics Association 2003.
the entire 3D scanning pipeline, due to the substantial user contribution required by current systems. The initial placement is heavily user-assisted in most of the commercial and academic systems (and it requires the interactive selection and manipulation of the range maps). Moreover, this actions has to be repeated for all the possible overlapping range map pairs. This pairwise process can be considered as a graph problem: given the nodes (i.e. the range maps), we have to select a subset of arcs such that every node is linked to some others if they have to be aligned together. If the set of range maps is composed by hundreds of elements (the scanning of a 2 meters tall statue generally requires from 200 up to 500 range maps, depending on the shape complexity of the statue), then the user has a very complex task to perform: for each range map, find which are the partially-overlapping ones; given this set of overlapping range maps, determine which one to consider in pair-wise alignment (either all of them or a subset); process all those pair-wise initial alignments. The main objectives for the design of a new and radically changed version of our alignment tool are: • a significant architectural evolution was needed to support the management of really large set of range maps (from 100 up to 1000); • the standard approach (user-assisted selection and initialization of all the overlapping pairs and the creation of the correspondent alignment arc) becomes impractical on large set of range maps; the only practical solution is to
Callieri et al / VCLab’s Tools for 3D range data processing
Figure 2: MeshAlign supports the two alternative approaches for the initial manual placement:: aligning via interactive manipulation (top) or by the selection of 3 corresponding point pairs (bottom).
provide instruments for the automatic setup of most of the required alignment arcs. Moreover, the efficiency of the rendering phase and of the alignment kernel has to be improved; • a more easy organization of the data has to be provided (possibly, following a hierarchical approach: it is impossible to manage a large set of elements as a simple list of items); • finally, we need easy to use tools to visually monitor the intermediate status of the alignment process and the accuracy reached. MeshAlign v.2 still follows the approach proposed by K. Pulli [17], which is based on a variation of the Iterated Closest Point algorithm [2, 5]. One of the main improvements of our new system is the hierarchical management of the project. In a classical alignment approach, the user should put in place the range maps one by one, manually specifying the alignment arcs between any possible pair of overlapping range maps. We adopted a different approach, based on a jigsaw puzzle metaphor which can greatly reduce the processing time. The idea is to work in a hierarchical way, constructing small groups of well aligned range maps and using them as a single piece to build larger groups. Working with this approach the user has just to place any single range map (or any group of already processed range maps) in the correct position with respect to the others, without worrying about directly specify all the alignment arcs between the various range map. Once we placed this new element, MeshAlign v.2 is able to detect the adjacencies between the various range maps in a completely automatic manner, setting up the data structures needed for the alignment automatically. Therefore, to give an example, if we have a small group of 5 range maps already aligned and we want to align them with a group of 30 already processed, the only action
demanded to the user is to “align" these two groups considering them as a simple pair of elements (this action requires a few seconds). Once the two groups are placed in an approximate initial alignment, the system automatically iterates on the single range maps which compose the groups; then, in a completely unattended manner, creates and initialize all needed arcs connecting pairs of overlapping range maps. This approach allows the reduction of the user-assisted work by more that 80%. We designed a keen data organization and a spatial index to ensure efficiency of the approach described above, making possible to detect automatically the range map overlaps once known an approximate alignment between two separate groups. Taking into account that the set of range maps that we have to manage can be really large, we implemented those structures in a most scalable way (in terms of both space and time efficiency). Range maps are complex piece of geometry (up to 1000*1000 samples). In order to maintain interactive response of all the mesh manipulation and rendering actions, a multiresolution engine has been provided in MeshAlign v.2. This engine automatically simplifies the range maps (simplification is run only the first time a range map is included in a project and the results are encoded and stored in a multiresolution structure). The user is free to select the proper level of detail (LOD) at any time, in a very simple manner (with a simple slider, see Figure 1). Choosing the right tradeoff between precision and user interaction speed is therefore very simple. Using a low-resolution model (obtained with an accurate simplifier) improves also the convergence of the first iterations of the ICP alignment; obviously, MeshAlign switches automatically to the high resolution data representation in order to get the maximum precision. MeshAlign provides the standard rendering modes (wire frame, wire frame, flat and smooth shaded). The system assigns colors to the different rage maps, to make them more clearly distinguishable in rendering. The user interface allows also managing the hierarchical project organization in a visual way. The sub-window in the bottom-left (with a layout similar to a hierarchical filebrowser) displays: the groups defined by the user during the alignment (first level items); for each group, all the range maps assigned (second level items); for each range map we have some info on the range map (size, bounding box) and the list of alignment arcs created by the system; and finally, numeric data are visualized for each arc, e.g. reporting the residual error associated to this arc after the alignment (a valuable information to feedback to the user to steer and improve the alignment).
4. MeshMerge The MeshMerge tool is used to produce a complete model by merging partial data files (range maps). The merging step can be implemented with an automatic process controlled by c The Eurographics Association 2003.
Callieri et al / VCLab’s Tools for 3D range data processing
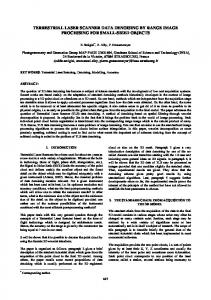
Figure 3: The range image fusion algorithm is run separately for each sub-portion of the space containing all the range images and then the resulting meshes are joined together.
setting just a few reconstruction parameters (the resolution, the smoothing factor or whether the automatic hole-filling feature has to be enabled). Many reconstruction methods have been proposed during the last few years [1]. A common taxonomy divides the existing approaches among volumetric and non-volumetric methods. Volumetric approaches immerse the range map in a discrete voxel space and reduce the reconstruction problem to a piece-wise task (i.e. for each voxel cell, reconstruct the surface portion passing through that cell). Most of these approaches require the reconstruction of a discrete distance field. The volumetric methods have some interesting characteristics: use of all range data, including redundant observations useful to reduce sensor noise; they are efficient in time/space and robust; finally, these methods can be extended to support controlled hole-filling functionalities [9]. An essential requirement is the scalability: a merging tool should be able to work with big or even huge dataset without requiring a dedicated hi-performance workstation. This means that we should take into account that memory is a finite resource, and design the data structures and the reconstruction process accordingly. The base algorithm used in the MeshMerge tool is the Marching Intersection (MI) algorithm [18], derived from the well known Marching Cubes (MC) method. This algorithm c The Eurographics Association 2003.
has been designed to obtain good performance but with a much smaller memory occupancy with respect to a standard implementation of a volumetric method based on "marching cube". The time and memory gains of MI depends on the choice of keeping in memory only the intersections of the range maps with the grid, instead of keeping a 3D distance field as in the standard volumetric methods. We have also implemented a volumetric solution based on discrete distance field and a standard Marching Cubes fitting kernel [8]. The positive advantage of this second approach is that it is less sensible to residual alignment inaccuracies than MI. If the set of range maps in input have a non-accurate alignment, MI can produce more topological noise than MC. A flexible tool should be able to manage set of range maps taken with very small inter-sample distance (0.25 mm is a standard value), and representing objects that can have an extent of a few meters. Therefore, the use of a volumetric method can require the setup and initialization of a very large voxel grid (a 2 meter tall statue scanned at 0.25 mm requires a 8,000*2,400*2,400 voxel grid if we want to reconstruct it at the same resolution used in scanning; the space complexity of this voxel set is 360GB). Such a large data structure cannot be represented on current low cost PC as it is; the construction and processing of this voxel set has to be implemented by working independently on partitions, to reduce the memory footprint to a manageable size. Our MeshMerge tool provides a split-merging feature, which allows to process huge dataset by working on sub-sections of the data (out-of-core), loading each time only the range maps involved in the generation of that single section of the voxel set (see Figure 3). The various parts of the final model are joined after the split merging process with a small time overhead; the boundary of the sub-blocks are guaranteed to be identical so the joining of resulting sub-meshes is trivial. Figure 3 shows the effects of the fusion of a small set of range images; the space containing all the range images is subdivided and the fusion algorithm is run separately for each sub-block, then the two resulting mesh are joined together. 5. MeshEdit This module supports some semiautomatic mesh-editing tasks, often necessary to clean-up and/or improve the scanning results: • Selective Smoothing. Reconstructed meshes can present, for many different reasons, small portions of the surface affected by some kind of noise that can be cleaned with a controlled local smoothing. • Hole Filling. Small holes (bounded by a few edges) can be easily and safely filled in a post-processing editing. Larger ones are better managed by the hole-filling feature introduced in the MeshMerge tool; • Small components removal. The presence of noise in the scanning data can produce a lot of small spurious unconnected components, which should be removed from the mesh to improve its quality;
Callieri et al / VCLab’s Tools for 3D range data processing
Figure 4: The graphic user interface of the simplification system.
• Topology Enforcing. Producing an output mesh with a clean topology is a must for many applications. Non twomanifold situations can be produced during mesh simplification or mesh editing, or can be due to geometric robustness and limited arithmetic accuracy of the geometric processing codes. Many of these problems can be automatically removed. • Mesh Conversion. The reconstructed mesh, once cleaned and edited as needed can be exported in a variety of common 3D formats like vrml, 3ds, ply, stl, etc..
6. MeshSimplify Simplification is mandatory when one has to manage the meshes produced with 3D scanning devices. The sampling resolution of current scanning instruments is up to 10 sampled 3D points per squared millimeter; producing surface meshes composed by 20M-100M faces is therefore common. Meshes of this size usually have to be reduced to a more easily manageable size to be used in real applications. Mesh simplification and LOD management are a rather mature technology [10, 7] that in many cases can efficiently manage complex data. Conversely, existing solutions (commercial and academic) fail on meshes characterized by a huge size: RAM size is often a severe bottleneck because, currently, high-quality simplification systems requires that the whole mesh is loaded in memory before the processing, requiring therefore a really huge quantity of memory.
Our MeshSimplify tool is characterized by the adoption of an highly innovative out-of-core data structure [6] that allows the simplification and the interactive visualization/inspection of really huge meshes. The simplification technique used is an incremental edgecollapse algorithm based on Quadric Error Metrics [11] that ensures highly accurate results. The innovative data structure used for out-of-core mesh management [6] is based on an octree decomposition of the mesh. It is characterized by a unique indexing of the vertexes of the mesh and maintains explicit representation of the mesh topology. The representation scheme designed is fairly general; we plan a future extension to use it for the implementation of all the algorithms supported by the MeshEdit module. Figure 4 shows a snapshot of the user interface of the MeshSimplify module. Our simplification code has been used in a number of projects, and it was selected by the Stanford group as the official Digital Michelangelo’s mesh simplifier. 7. Stitcher and Weaver - Color attribute management Many objects, especially in the Cultural Heritage domain, cannot be represented by a digital model that encodes just the shape characteristics. We also need to sample and encode the reflectance properties of the surface, and usually this data are represented by a texture map which gives a more realistic appearance to the model. Usually the color properties of a 3d model can be obtained c The Eurographics Association 2003.
Callieri et al / VCLab’s Tools for 3D range data processing
either during the 3d scanning phase by using, when available, the CCD camera of the 3D scanner, or in a second step by taking high resolution photos with a digital camera. In the latter case the obtained photo are un-calibrated and must be mapped to the surface of the 3D object. Similarly to the case of range map alignment, this process cannot be done in a fully automated way, but requires that the user finds some corresponding features between the photo and the 3D model. This interactive task is carried out by the Stitcher module by adopting a semi-automatic approach (the initial user-driven selection of a few corresponding point pairs is automatically refined by the system by fitting the silhouettes and features points of the 3D mesh and the image). The output is a set of calibrated RGB images that must be merged together and mapped to the 3D mesh. Our Weaver tool starts from a set of RGB images with known camera parameters (which can be either returned by the 3D scanner or be calculated subsequently with the Stitcher module) and a 3D mesh (either the full resolution reconstruction or a simplified model). It processes in unattended mode the input set and produces a new texture map from the input images [4]. The process is subdivided in four phases: Visibility calculation. The first step is to find for each face of the 3D mesh the subset of cameras (and images) from which the face is visible, and the relative angle of incidence of the view direction. Patch generation. Visibility data are used to subdivide the 3D mesh in sections (patches), such that a single image could be attached to each patch getting a good projection and color mapping. Sub-Texture packing. Once generated these patches, the corresponding texture regions are arranged in a new patchwork texture. Improving color matching and continuity. The patchwork texture is averaged in two steps, to minimize color difference and discontinuities. To improve texture quality we compute a color-difference map that express how each texel has to change in order to became “compatible" with its neighbors, once all of them are mapped onto the model. This is a global map that allow to reach a complete matching of the color without losing information, since the process mostly affects the luminance component and only on a very limited extent the chrominance. An example of texture-enhanced surface mesh is presented in Figure 5.
8. Results and Assessment Our 3D scanning tools have been used in many different complex acquisition projects. Among them, we present here some results obtained while scanning the Minerva of Arezzo, a bronze statue (155 cm.) of the Archaeologic Museum (Florence, Italy) now under restoration. Four different models of the Minerva have been scanned in c The Eurographics Association 2003.
Figure 5: The textured head of the Minerva (simplified mesh, 250K faces, with a texture map obtained by integrating 8 high resolution photos).
2000-2002. Table 1 presents data on: scanning system and software used, processing time and output data complexity. The Minerva experience is a very good example to assess the evolution of our post-processing tools. The first acquisition was performed on Oct. 2000 with the first generation of our tools. The following two acquisitions were done using progressively improved versions, while the fourth scan was performed using an alpha version of the second generation tools. The speedup obtained with the new generation tools has been impressive, as readers can appreciate from the data presented in Table 1. Moreover, this speedup has been obtained by only improving the software (thus without any increase in the scanning system cost, size, weight and complexity). Figure 6 shows simplified models of the statue. Moreover, our tools have also been distributed to selected users‡ , to have a third-part feedback on usability and accuracy. Among these experimentations, we cite here the Parthenon project of the Institute for Creative Technologies (CA, US), leaded by Paul Debevec, and the Stanford’s Digital Michelangelo project. The Parthenon Project is a grand scale production project
‡ In the framework of the EU IST “ViHAP3D" project, we are giving our tools in evaluation to selected users. Please contact R. Scopigno if interested in experimenting a demo version.
Callieri et al / VCLab’s Tools for 3D range data processing Minerva - 3D models reconstruction Model 1(Oct.2000)
Model 2 (Apr.2001)
Model 3 (March.2002)
Model 4 (Oct.2002)
Scanning Scanner used: structured light scanner (CNR)
laser scanner (INOA)
Minolta Vivid 900
Minolta Vivid 900
Scan set & time: 146 range maps, 5 days
172 range maps, 4 days
297 range maps, 1 day
306 range maps, 1 day
Post processing - SW used and times MeshAlign v.1 MeshMerge v.1 Mesh Simplify v.1
MeshAlign v.1 MeshMerge v.1 Mesh Simplify v.1
MeshAlign v.1.5 MeshMerge v.1 Mesh Simplify v.2
MeshAlign v.2 MeshMerge v.2 Mesh Simplify v.2
Time: 6 weeks
3 weeks
1.5 weeks
4 days
65.6M faces (0.3mm)
68.5M faces (0.3mm)
Resulting mesh size (full resolution) and voxel size: 26M faces (0.57mm) 30M faces (0.5mm)
Table 1: The table reports some data on four different acquisitions of the Minerva, done at different stages of the restoration.
underway at the ICT, intended to bring together scanned geometry, global illumination, image-based lighting, detailed human body and facial animation, and new image compositing techniques [22]. A sub-task of this project is to reconstruct a digital replica of all sculptured friezes of the Parthenon, to be used to produce graphics and multimedia presentations (see first results on http://www.ict.usc.edu/graphics/parthenongallery/). The feedback given us was enthusiastic, both concerning the speed and the easy of use of the tools and the accuracy of the results. In the framework of the Digital Michelangelo project, our simplification tool has been selected by the Stanford colleagues as the official Digital Michelangelo simplifier. All the simplified models available from the Stanford’s repository web have been created with our high-quality out-of-core simplifier.
References [1]
F. Bernardini and H. E. Rushmeier. 3D Model Acquisition. In Eurographics 2000, State of the Art Reports Proceedings, pages 41–62. Eurographics Association, August 24–25 2000. 1, 2, 5
[2]
P. J. Besl and N. D. McKay. A method for registration of 3-D shapes. IEEE Transactions on Pattern Analysis and machine Intelligence, 14(2):239–258, February 1992. 3, 4
[3]
F. Blais. A review of 20 years of range sensor development. In Videometrics VII, Proceedings of SPIEIS&T Electronic Imaging, SPIE Vol. 5013, pages 62– 76, 2003. 1
[4]
M. Callieri, P. Cignoni, and R. Scopigno. Reconstructing textured meshes from multiple range rgb maps. In 7th Int.l Fall Workshop on Vision, Modeling, and Visualization 2002, pages 419–426, Erlangen (D), Nov. 20 - 22 2002. IOS Press. 2, 7
9. Conclusions
[5]
This paper has presented the features of our tools for postprocessing 3D scanning results. The work is still ongoing (funded by a European project); we plan to further revise and improve our tools to be able in the near future to build a real-time system where post-processing could be directly done during the scanning phase.
Y. Chen and G. Medioni. Object modelling by registration of multiple range images. International Journal of Image and Vision Computing, 10(3):145–155, April 1992. 4
[6]
P. Cignoni, C. Montani, C. Rocchini, and R. Scopigno. External memory management and simplification of huge meshes. IEEE Transactions on Visualization and Computer Graphics, 9(4):525–537, 2003. 2, 6
[7]
P. Cignoni, C. Montani, and R. Scopigno. A comparison of mesh simplification algorithms. Computers And Graphics, 22(1):37–54, 1998. 6
Acknowledgements We acknowledge the financial support of the projects EU IST-2001-32641 “ViHAP3D" and MIUR FIRB “MACROGeo".
c The Eurographics Association 2003.
Callieri et al / VCLab’s Tools for 3D range data processing
Figure 6: Some images from the fourth digital model of the Minerva.
[8]
B. Curless and M. Levoy. A volumetric method for building complex models from range images. In Comp. Graph. Proc., Annual Conf. Series (SIGGRAPH 96), pages 303–312. ACM Press, 1996. 2, 5
[9]
J. Davis, S. Marshner, M. Garr, and M. Levoy. Filling holes in complex surfaces using volumetric diffusion. In First Int. Symp. on 3D Data Processing, Visualization and Transmission (3DPVT’02), pages 428– 438. IEEE Comp. Soc., 2002. 5
[10] M. Garland. Multiresolution modeling: Survey & future opportunities. In EUROGRAPHICS’99, State of the Art Report (STAR). Eurographics Association, Aire-la-Ville (CH), 1999. 6
PolyWorksT M inspection solutions. More info on: http://www.innovmetric.com/, 2003. 1
[13] InnovMetrics. and modeling
[14] G. M. Cortelazzo L. Lucchese. A noise-robust frequency domain technique for estimating planar rototranslations. IEEE Trans. on Signal Processing, 48(6):1769–1786, 2000. 3 [15] Stanford Computer Graphics Laboratory. Scanalyze: a system for aligning and merging range data. More info on: http://wwwgraphics.stanford.edu/software/, 2003. 1
[11] M. Garland and P.S. Heckbert. Surface simplification using quadric error metrics. In SIGGRAPH 97 Conference Proceedings, Annual Conference Series, pages 209–216. Addison Wesley, August 1997. 2, 6
[16] Stanford Computer Graphics Laboratory. Vrippack volumetric range image processing package. More info on: http://wwwgraphics.stanford.edu/software/, 2003. 1
[12] Raindrop Geomagic. GeomagicT M studio: Reverse engineering and custom design software. More info on: http://www.geomagic.com/products/, 2003. 1
[17] K. Pulli. Multiview registration for large datasets. In Proc 2nd Int.l Conf. on 3D Digital Imaging and Modeling, pages 160–168. IEEE, 1999. 2, 3, 4
c The Eurographics Association 2003.
Callieri et al / VCLab’s Tools for 3D range data processing
[18] C. Rocchini, P. Cignoni, F. Ganovelli, C. Montani, P. Pingi, and R. Scopigno. Marching Intersections: an efficient resamling algorithm for surface management. In Int. Conf. on Shape Modeling and Applications, pages 296–305, Genova, Italy, 2001. IEEE Comp. Society. 5 [19] C. Rocchini, P. Cignoni, C. Montani, P. Pingi, and R. Scopigno. A suite of tools for the management of 3d scanned data. In 3D Digital Imaging and Modeling Applications of: Heritage, Industry, Medicine & Land (3DPVT WS Proc., Padua (I), 3-4 April), 2001. 2 [20] C. Rocchini, P. Cignoni, C. Montani, and R. Scopigno. The Marching Intersections algorithm for merging range images. Technical Report B4-61-00, I.E.I. C.N.R., Pisa, Italy, June 2000. 2 [21] G. Roth. Registering two overlapping range images. In 3DIM’99: Second Int. Conf. on 3D Digital Imaging and Modelling, pages 191–200, October 1999. 3 [22] J. Stumpfel, C. Tchou, T. Hawkins, P. Debevec, J. Cohen, A. Jones, and B. Emerson. Assembling the sculptures of the parthenon. In A. Chalmers D. Arnold and F. Niccolucci, editors, VAST 2003 and EG Symp. on Graphics and Cultural Heritage, page (in press), Bighton, UK, Nov. 5-7 2003. Eurographics. 8 [23] INUS Technology. RapidformT M 2004. More info on: http://www.rapidform.com/index.htm, 2003. 1
c The Eurographics Association 2003.