1
This copy is author’s original pre-print version and may slightly differ from the official published version. Full citation: Belt, P., Oiva-Kess, A., Harkonen, J., Mottonen, M. & Kess, P. (2009) ‘Organisational maturity and functional performance’, International Journal of Management and enterprise development, Vol. 6, No. 2, pp. 147–164. DOI: 10.1504/IJMED.2009.022624
Organisational maturity and functional performance Pekka Belt* Department of Industrial Engineering and Management, University of Oulu, Finland, P.O. Box 4610, FI-90014 University of Oulu, Finland E-mail:
[email protected] *Corresponding author
Annukka Oiva-Kess Respecta Oy Tenholantie 12, 00280 Helsinki, Finland E-mail:
[email protected]
Janne Harkonen, Matti Mottonen and Pekka Kess Department of Industrial Engineering and Management, University of Oulu, Finland, P.O. Box 4610, FI-90014 University of Oulu, Finland E-mail:
[email protected] E-mail:
[email protected] E-mail:
[email protected] Abstract: This paper examines the maturity of company practises from
two different perspectives. The overall management system is analysed by using the People Capability Maturity Model (P-CMM). The maturity of an operational function is scrutinised by using the Verification and Validation Maturity Model (V2M2). Verification and validation (V&V) was chosen as an example as it has become a challenging function for the management of the high technology sector. Even the best performer in the managerial maturity analyses, a major Scandinavian telecom company, has significant difficulties with the V&V maturity. Typically, small and medium sized companies should concentrate on developing their overall management system before they can reach high maturity in single operational functions. Keywords: strategic management; capability; verification; validation; testing;
2 maturity; P-CMM; V2M2; CMMI; enterprise development.
3
1 Introduction Modern high technology products with numerous features are getting increasingly complex. It is difficult to design and manufacture electronics products without defects (e.g. Woodward and Hennell, 2005; Black, 2004). Verification and validation (V&V) activities have become increasingly important for the development of Information and Communication Technologies (ICT). The literature estimates V&V to take 30 to 80 percent of the entire costs in high-technology product development. These activities have developed into a critical factor that requires significant development efforts (e.g. Engel & Last, 2007; Gilb, 2005; Andersson and Runeson, 2002). Identifying and developing critical functions is one of the key priorities of top management. Bridging the enterprise strategy and operational efficiency and effectiveness has been found important (e.g. Ami and Sommer 2007). The top management and functional experts require a common language and valuable two-way communication (Nord et al. 2007). Maturity models are tools used for analysing and developing company practices. Capability Maturity Model (CMM) based models are among the most common. CMM models typically have five levels (1, 2, 3, 4, and 5), 1 being the initial and 5 the most advanced (e.g., CMU/SEI, 2006; Jacobs et al. 2005). In this study, maturity models are utilised for assessing the management systems of companies together with analysing a single specific operational function, namely V&V. The main focus is on the interdependence and the balance of managerial and operational aspects. This study utilises two different maturity models. The People Capability Maturity Model (P-CMM) (Curtis et al, 2001) has been used to analyse the level of overall management systems in companies. The Verification and Validation Maturity Model (V2M2) (Jacobs and Trienekens, 2002) has been utilised to analyse V&V. The interdependence of these two aspects is also scrutinised. The study aims to clarify whether the bottleneck for performance improvement lies with the maturity of the overall management system, or the operational function itself. The above mentioned can be condensed into two research questions: RQ1. How have the maturity models developed with respect to a) overall management systems and b) single company functions? RQ2. Are there major differences in the maturity of overall management system and that of a single specific function in industrial companies?
2 Organisational and functional level maturity models One way to measure the capability of industrial processes is to utilise various types of maturity models. Processes cannot be improved before they are well understood. The term maturity can be seen as an indication of how well employees or organisations ‘cope’ with a given process (Leonard 2004). The maturity approach to determine organisational abilities has its roots in quality management (Tiku et al. 2007). Crosby’s (1996) Quality Management Maturity Grid describes the typical behaviour of a company, which evolves through five phases in their ascent to quality management excellence. The first complete formulation of the process maturity framework was presented by Humphrey (1989). This was later used as the basis, when the Software Engineering Institute from Carnegie Mellon University developed the first maturity model,
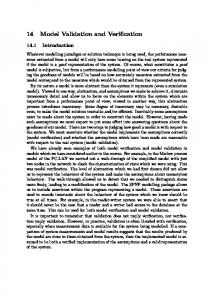
4 specifically designed for software development (SW-CMM, Software Capability Maturity Model) (Paulk et al. 1993). The original model has been further developed into Capability Maturity Model Integration (CMMI) to cover both software and system development (e.g., CMU/SEI, 2006; Lee and Chang, 2006). However, CMMI does not cover all the activities that may be relevant for different practitioners, or explicitly address all function specific issues (see e.g., McCaffery and Coleman, 2007; Beecham et al., 2005; Gottschalk and Solli-Saether, 2006; Jokela et al., 2006). Since SW-CMM was discovered to be functional for developing software creation, it has become a de facto standard for assessing and improving software processes (e.g., Leung et al., 2007; Gilles & Howard, 2003). It was, however, discovered that SW-CMM concentrates too heavily on technical processes (e.g. Yoo et al. 2006). There was a need for a model that would include also people and the development of their skills and competencies. Based on the original model, Curtis et al. (1995) created the People Capability Maturity Model (P-CMM) for developing processes and practices for managing competences. The model strengthens the readiness of an organisation to execute its strategy. The P-CMM model has been further developed, the latest version being 2.0 (Curtis et al. 2003). Another aspect the original SW-CMM did not sufficiently address are operational functions, such as testing. This was the reason for Burnstein (1996) to develop the Testing Maturity Model (TMM). TMM was developed for guiding the software-testing process (Burnstein, 1996). However, TMM is seen to overlook the fact that improvement actions at higher levels cannot be carried out without considering the organisational aspects (e.g., Jacobs and Trienekens, 2002). This was why Ham et al. (2001) developed the Metric Based Testing Maturity Model based on TMM and CMMI. Jacobs and Trienekens (2002) developed the model further and created the Metric Based Verification and Validation Maturity Model (MB-V2M2). The strength of V2M2 is that it is a comprehensive model that it is not geared towards any specific type of business, such as software engineering. V2M2 has a CMMI-like structure, allowing better compatibility with any enterprise-wide maturity assessment interests. Additionally, V2M2 takes the organisational aspects into consideration at higher levels. Figure 1 describes the development of CMM-based maturity models used in this study. The development path of these models has departed into two directions; some having overall management specific scope and others covering single functions. Previous studies have identified the combination of different maturity frameworks as the best way to develop operational functions (e.g. Vakaslahti, 1997; Jacobs et al. 2007). The assessment with these models, such as P-CMM have, however, been found laborious. There seems to be a need for further development of these models. Figure 1. The development of CMM-based maturity models used in this study
5
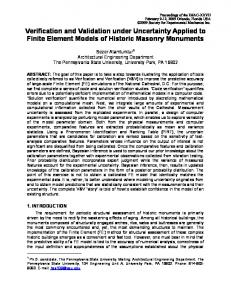
3 The research process The research process had two phases where 1) the general maturity of organisations was assessed by using P-CMM as a reference framework, and 2) the maturity of the selected operational function (V&V) was analysed by using V2M2. Additionally, the interdependence of these two was analysed. P-CMM covers both the implementation of an organisation’s strategy and the processes and practices required for its management system. The model includes 498 management practices divided into 22 management processes (see Curtis et al., 2001). Together they form a part of the organisational infrastructure. V2M2 covers verification and validation related processes and practices that can be used for analysing the operational functioning of these activities (e.g. Jacobs and Trienekens, 2002). Figure 2 illustrates the scope of the research. Managerial aspects were covered by PCMM analyses, and operational aspects by V2M2 analyses. The best performing company among those participated was identified to allow learning from their example. The results have been presented separately for the industry average and for the top company. Figure 2. Two stages of the study
6
3.1 Study on managerial aspects (P-CMM) Altogether thirteen different size companies were selected to participate in the study. The smallest ones employ less that 10 people and the biggest are large international companies. The study was conducted in three phases, so that the first phase was a general briefing for the management of all the companies. The second phase was a self-assessment conducted within the companies, and the third phase was an interview. Additionally, the best performing company among those participated was identified. The interviewees were selected so that they would represent the management as well as possible. The number of people participating in the self-assessment typically varied between 3 and 20 per organisation. The representatives were selected so that they knew the management practices used in the company as well as possible, together with their practical implementation. The people represented both the top management and development and human resources departments. Assessing the management practices took, on average, 3 days to complete in each company, as the assessment covered all hierarchical levels of the company as well as all the 498 practices of the P-CMM model. A scoring system was used for assessments in this study, in order to gain more information, instead of a simple on-off analysis. The scoring system is described in Table 1. Table 1. Scoring system applied in the P-CMM assessments
Points
Practice
5
The practice is widely in use (75 %) in the organisation
4
The practice has been tried and experience gained
3
There is a decision and a documented plan to start using the practice
2
There is a strong discussion whether to use the practice, but no decision
0
The practice is not widely known
Table 2 contains background information on the P-CMM assessments and on the interviews, including the company size and number of interviews. Table 2. Company size categories and the number of self-assessments and interviews
Company
Company size
Status of the interviewed
A
Mid-sized
B C D E F
Small Mid-sized Small Small Mid-sized
CEO & Directors responsible for development Directors Directors responsible for development CEO + Directors CEO All level employees represented
Selfassessments + interviews 8+6 2+2 6+6 3+3 1+1 23 + 23
7 G H I J K L Top
Mid-sized Large Small Large Mid-sized Small Large
Directors and managers All level employees represented All level employees represented Directors Directors responsible for development Directors Directors
Total
8+5 11 + 12 6+3 3+2 3+3 4+6 15 + 12 93 + 84
3.2 Study on functional aspects (V&V) In the second phase of the research one function was selected to represent the operational activities, namely verification and validation. The intention was to analyse the potential correlation between the maturity of the overall management system and that of an operational function. The study on V&V in different phases of the new product development (NPD) chain was conducted to obtain data to represent functional aspects in maturity analyses. This was done for both, to gain an understanding over the average state, and to identify and analyse the top company. The studied phases included applied research, product development, production and after-sales. The empirical study consisted of twenty interviews. Interviews were conducted informally allowing the interviewees to explain and clarify the cases and topics as entities. All the individual interview results were analysed by using the V2M2 model as the tool (see e.g., Jacobs and Trienekens, 2002 for the process area details). The interviewees were chosen on the basis of their professional expertise. Selected participants held responsible positions in the field of V&V. The experience and the interests ensured the high motivation and up-to-date knowledge in relation to the discussed topics. The job titles of the interviewees include: Product Development Manager, Director (R&D), Quality Manager, Senior Test Manager, Competence Manager, Engineering Manager, and Group Manager. The selected participants represented the top-experience in the field of V&V and testing.
4 Results & Analyses 4.1. P-CMM Analyses Each company was assessed using P-CMM and all of its 498 management practices. Each practice was given a score between 0 and 5. The total sum was calculated and compared to the theoretical maximum to obtain a percentage. The same analysis was conducted for all the participating companies. The results of the P-CMM analyses are presented process-area-wise in Appendix B. The summary of the results is presented in Figure 3 The average for all the 13 companies and the identified top company are presented separately in the right hand side of the figure. The results indicate the over-all maturity in the companies being typically quite poor. The variation among the companies was especially large. In some companies the coverage of the practices was almost non-existent while the top company’s score was close to 100 %.
8 Figure 3. Results of the P-CMM analyses
The results were processed further by categorising the companies into small, medium and large ones (Figure 4). The companies A and B are left out of calculating the average as they only wished to complete a part of the assessments due to the massive scale of the P-CMM study. In large companies, the maturity of the management system seems to be at a high level, and the variation between companies is moderate. The variation is more significant for small and medium sized companies. Figure 4. P-CMM comparison among small, medium, and large companies
9
4.2 V2M2 analyses The maturity analyses of the chosen operational function were conducted by concentrating on the V&V activities in ICT companies. The analyses were carried out by using the V2M2 analysis tool presented in Appendix A, by comparing the opinions of industry interviewees with the model requirements. The analyses were conducted for all the companies and the top company was identified. Table 3 presents examples of the interviewee comments by the representatives of the top company. The comments supporting conformance, as well as those being against, are presented towards each maturity level. The comments in Table 3 cover the entire NPD phasing: applied research, product development, production, and after-sales. In single phase analysis, the V&V activities are interpreted to be at a certain level of maturity once they meet all the requirements set by the reference model, and do not have any clear non-compliance issues at lower levels. The phase average is calculated as the arithmetic mean of the separate phases. Figure 5 illustrates the results for both the industry average and the identified top company. Table 3. Extracted interviewee comments for V&V through NPD process for the top company
[(+) = supports conformance (-) = against conformance] Interviewee comments Level 1 Conformance + “The goal is to find the best solutions, the learning curve starts on trial and error basis” + “V&V in early product development is assuring the functioning - more precise definition is difficult” + “V&V and testing in late product development includes type acceptance, functionalities, and environmental certifications as this is the last phase before production” + “Testing in production is assuring that the product has been made correctly” + “V&V and testing in after-sales demonstrates that the product is working, or is faulty” + “V&V in after-sales can be apprehended as customer education, ramp-ups, and maintenance testing” Level 2 Conformance + “Suitable test equipment is utilised for the intended purpose” + “The modules will be first tested by the design engineer himself” + “Self-testing functions are developed so that the product itself would indicate a fault situation as early as possible” + “A high number of V&V experts and other experienced people work in product development” + “New test environments are developed in co-operation with the suppliers” + “Well-defined interfaces are a must for testing modular products” + “Solid understanding of the development history is of great benefit” + “V&V in product development is broad-based and cause a large part of expenses of the entire product development” + “Product is not tested in production anymore for the product itself, but testing is for finding faults caused by the production process” + “For modular products, the sub-assemblies are tested more than the higher level
10 compositions” + “Testing includes a thorough fault analysis in after-sales” + “Fault databases are used to store after-sales data” - “Systematic ways of working are missing in relation to V&V to some extent, causing its own problems” (applied research) - “The test related know-how, especially in applied research has been somewhat weak, however, well defined practices could impede the creativity required” - “There are no universally applicable methods for testing anything non-standardised ” (applied research)
Level 3 Conformance + V&V can be seen as verifying requirement definitions, which will result in specifications after peer reviews” + “Best potential technical solutions go through a rigorous test program” + “The aim is to push the best technical solution through to become the standard” + “V&V includes verifying requirements specifications and peer reviews” + “Technology research gives the specification for product development, explaining the functionalities, but does not explain in detail how to conduct V&V” + “Process testing assures the product is assembled in production as specified” + “Functional testing towards the end of production demonstrates that the product functions as intended” + “Testing in after-sales has an intention to serve the other phases through NPD, supporting the learning curve” - “The staff ambitions have a tendency to be purely technical, causing in incapability of being able to view the aimed solutions from the viewpoint of both, internal and external customer ” - “The focus tends to be more on ideation than on considering the functioning of the product and the requirements of the product development” Level 4 Conformance + “Statistical methods are utilised in production to analyse the measured results. The results are observed for possible trends” + “Separate test equipment in production are compared to each other’s results, so that any equipment based errors will be detected” - “Internal functions have some difficulties understanding the requirements V&V activities have, causing some challenges” - “There is no knowledge on whether the right issues are being studied and verified” - “Managing V&V across technological borders is a challenge yet to be resolved, requiring sufficient, independent knowledge” - “Internal functions do not always understand the requirements of the internal customer, in relation to V&V, well enough, so that a fluent V&V process would be possible, it is common to have unnecessary overlapping” - “Other functions should better take the requirements set by V&V activities into account”
11 Level 5 Conformance N/A
The extracted interviewee comments in the Table 3 represent the views of the top company. It can be concluded that the V&V activities in applied research are not performed in a systematic and planned way. The results show a clear non-compliance even with the level two requirements. Also, the V&V related know-how in applied research being experienced somewhat weak impedes the introduction of basic practices that are required for the level two. However, the interviewees feel that defined practices could hinder the creativity required at these early stages of the NPD. Noteworthy is that there are no major differences between the top company and the industry average in applied research. The applied research phase is the only phase that seems to fail reaching the level 3 maturity in the top company. The ambitions of the personnel involved with V&V being purely technical and causing incapability to fully sympathise with the internal and external customers indicate non-compliance with the level 3 process area 1, ‘Organisation embedding’. The interviewee comments also indicate that the top company is not fully compliant with the level 3 process area 3 ‘V&V life cycle embedding’. Should the interview results be analysed against the level 4 requirements, there was strong evidence that none of the interviewed ICT companies was complying with the requirements. For example, the level 4 process area 1, ‘organisational alignment’, is not complied with as the internal functions are seen to have difficulties understanding the requirements set by V&V activities. Only in the production of the top company, there was evidence of utilisation of quantitative measurements and statistical methods to control the V&V process. In Figure 5 the results of the V2M2 maturity analyses are presented, showing the maturity of the V&V activities for different phases of the NPD process. The right side of the figure shows the average for all the participated companies as well as the results for the top company. The phase average was calculated as an arithmetic mean of the individual phase results. According to the results the maturity of the top company is at a higher level than that of the company average for every single NPD phase. The difference seems to be less significant in production where the maturity is the highest. The main difference is in the product development and after-sales phases. On the other hand, not even the top company reaches V&V specific maturity level higher than 3.
12 Figure 5. Results of the V2M2 analyses
4.3 Correlation of the results from organisational and functional maturities The top company for both P-CMM and V2M2 analyses appeared to be the same significant Scandinavian telecom company. Figure 6 presents the results of the maturity analyses for both the management system and the operational function. The difference between the maturity of the management system and that of the studied operational function was found to be the greatest in the top company. This forms a good basis for correlation analysis. Figure 6. Summary of the P-CMM and V2M2 maturity analyses
The results of the V2M2 analyses reveal how even the identified top company has a clearly lower V&V specific maturity than its separately studied overall maturity.
13 Mastering the level three (V2M2) requirements would mean V&V being integrally embedded into the NPD cycle, allowing an early consideration of V&V activities. Whereas, compliance with the higher levels (4-5) would mean managerial visibility into the V&V process, allowing fine-tuning and optimising through continuous monitoring and improvement. To comply with the requirements of the levels 4 and 5, the organisational aspects must be taken into account. The high maturity of the general management system in the top company means that they should have the capability to raise the maturity of the V&V activities higher than the present results indicate. The V&V activities, however, seem to be difficult for the management to handle efficiently and effectively, or these activities have not yet been considered and addressed as decisively. The study shows that the top company’s low maturity of the V&V activities does not originate from the poor maturity of the overall management system, but there must rather be other reasons for these results. To be able to improve the maturity of a single operational function, the top company must improve the organisational alignment of that function. The companies with a lower management system maturity should concentrate on improving the overall managerial capabilities. Only after reaching a higher management system maturity, it is realistic to strive for a high maturity in a single operational function.
5 Managerial implications An organisation should be able to assess both, the maturity of its whole management system as well that of its individual activities, such as V&V. It is not profitable for all companies to invest in gaining superiority in every single activity; rather the investment should be in line with the company strategy and its overall maturity. Investing in a single function is only productive, if the company is capable of utilising the results of such an investment. There should be a balance between the investments in a single activity and the overall organisational maturity. When analysing the maturity of a single function, according to any CMM-based maturity model, it must be noted that it can be developed only to level 3 without investing in the improvement of the entire management system. In practice this means that an organisation needs to develop the maturity of its management system, if it desires to raise the maturity of any single function to higher levels of 4 and 5. The capability, or maturity, of the management system of a company does not automatically mean that all important functions are of high maturity. This study revealed that not even the identified top company has reached a V&V specific maturity level higher than 3, even though the management system maturity would allow this. It would be possible for the top company to raise the V&V maturity, should they decide to invest in the matter. However, already now the top company does utilise the information from the after-sales phase to improve the performance of the earlier phases. Also, the V&V maturity of the product development phase is clearly at a higher level in the top company than is the case for the industry average. The average for all the companies indicates a level 2 maturity for both the overall management system and for the V&V activities. This shows that these firms should consider investing in improving their overall management system first and only then to improve their V&V activities, as they seem to be difficult to handle even for the top company. Smaller firms could learn from the leading company.
14
6 Conclusions Maturity Models are based on the principles of quality management. Some of these models emphasise analysing the overall management system maturity, while others are single function specific. The original maturity model (SW-CMM) did not adequately address managerial aspects, which was the main motivation for developing the P-CMM models for analysing management systems. SW-CMM and P-CMM do not sufficiently cover operational functions such as V&V. Currently there are separate maturity models addressing V&V issues, of which the most advanced seems to be V2M2. (RQ1) In this study the P-CMM and V2M2 models were utilised to analyse the correlation between the maturity of the overall management system and that of V&V activities. The results indicate a clear connection between the maturity of the general management system and the studied operational function. Noteworthy is that there was significant differences between different companies. V&V activities in the identified top company were at a surprisingly low level despite of its excellent results for the overall management system. A company with such a management system should be able to develop its V&V activities to a much higher level. (RQ2) A company being superior with their management system maturity does not automatically mean that they are superior with all operational functions. However, the management of such a company should have the capability of reacting into the rising significance of new matters affecting their business success. V&V activities seem to be one of these factors with growing importance. It is not realistic for companies with lower maturity to gain superiority in new and difficult matters without improving their management system maturity first. The interdependence of maturity and agility could be an interesting area where to continue this study as the agile development methods have become crucial for software development. Further research is also required to clarify the real reasons for the indentified maturity gap between the management system and verification and validation activities in the top company. The P-CMM analyses were extensively massive in scale, even though the number of case companies was not especially extensive. By having a wider set of organisations to be reviewed, the obtained results might have yielded a slightly different analysis. The scale of the V2M2 analyses was sufficient for the purpose of this study to draw conclusions.
Acknowledgements This research has been supported by the National Technology Agency of Finland (Tekes) and Nokia Foundation.
References Ami, T. and Sommer, R. (2007) 'Comparison and evaluation of business process modelling and management tools', International Journal of Services and Standards, Vol. 3, No.2 pp. 249 261. Andersson, C. and Runeson, P. (2002) ‘Verification and validation in industry – a qualitative survey on the state of practice’, Empirical Software Engineering, Proceedings, IEEE, International Symposium. Beecham, S., Hall, T. and Rainer, A. (2005) ‘Defining a requirements process improvement model’, Software Quality Journal, Vol. 13, No. 3, pp.247–279.
15 Black, R. (2004) ‘Critical Testing Process – Plan, Prepare, Perform, Perfect’, Boston: AddisonWesley. Burnstein, I. (1996) ‘Developing a Testing Maturity Model’, Illinois Institute of Technology. CMU/SEI (2006) ‘CMMI® for Development’, Version 1.2, Carnegie Mellon University, Software Engineering Institute. Crosby, P.B. (1996), ‘Quality Is Still Free: Making Quality Certain in Uncertain Times’, McGrawHill, New York, NY. Curtis, B. Hefley, W.E., and Miller, S.A. (1995a) ´Overview of the People Capability Maturity Model´, Software Engineering Institute, Carnegie Mellon University, Pennsylvania. Curtis B,, Hefley, W.E. and Miller, S.A. (1995b) ´People Capability Maturity Model´, CMU/SEI – 95 MM-02, Software Engineering Institute, Carnegie Mellon University, Pennsylvania. Curtis, B. Hefley, W.E. and Miller, S.A. (2001) ´People Capability Maturity Model® (P.CMM®)´ version 2.0 CMU/SEI-2001-MM-01, Software Engineering Institute, Carnegie Mellon University, Pennsylvania. Curtis, B. Hefley, W.E. and Miller, S.A. (2002) ´The People Capability Maturity model. Guidelines for Improving the Workforce´. Carnegie Mellon. The SEI Series in Software Engineering. Addison- Wesley. USA. Curtis, B. Hefley, W.E. and Miller, S.A. (2003a) ´Experiences Applying the People Capability Maturity Model´, Software Engineering Institute, Carnegie Mellon University, Pennsylvania. Curtis, B. Hefley, W.E. and Miller, S.A. (2003b) ´Introduction to the People CMM, Version 2´. Carnegie Mellon, Software Engineering Institute. TeraQuest Metrics. USA. Engel, M. and Last, M. (2007) ´Modeling software testing costs and risks using fuzzy logic paradigm´, The Journal of Systems & Software, 2007 9 (3), pp. 259-280. Gilb, T. (2005) ‘Competitive Engineering: A Handbook for Systems Engineering, Requirements Engineering, and Software Engineering Using Planguage’, pp.480. Gillies, A. and Howard, J. (2003) ´Managing change in process and people: combining a maturity model with a competency-based approach´, TQM & Business Excellence 14(7): 779–787. Gottschalk, P. and Solli-Saether, H. (2006) 'Maturity model for IT outsourcing relationships', Industrial Management and Data Systems, Vol. 106, No.2, pp. 200-212. Ham, M., Jacobs, J., Swinkels, R. and Van Veenendaal, E. (2001) ‘Metric based testing maturity model framework v1.1’, http://tmitwww.tm.tue.nl/research/v2m2/ (read 22 November 2004). Humphrey, W. S. (1989) ´Managing the Software Process´. Reading, MA: Addison-Wesley. Jacobs, J., van Moll, J., Kusters, R., Trienekens, J. and Brombacher, A. (2007) 'Identification of factors that influence defect injection and detection in development of software intensive products', Information and Software Technology, Vol. 49, No. 7, pp. 774-789. Jacobs, J., van Moll, J., Krause, P., Kusters, R., Trienekens, J. and Brombacher, A. (2005) 'Exploring defect causes in products developed by virtual teams', Information and Software Technology, Vol. 47, No. 6, pp. 399-410. Jacobs, J. and Trienekens, J. (2002) ‘Towards a metrics based verification and validation maturity model’, Lecture Notes in Computer Science, Vol. 2434, pp.133–148. Jokela, T. Siponen, M. Hirasawa, N. and Earthy, J. (2006) ´A survey of usability capability maturity models: implications for practice and research´, Behaviour & Information Technology 25(3): 263–282. Lee, M-C. and Chang, T. (2006) ‘Applying TQM, CMM and ISO 9001 in knowledge management for software development process improvement’, Int. J. Services and Standards, Vol. 2, No. 1, pp.101–115. Leonard, A. (2004) ´Focusing on maturity levels for the effective management of end users involved in software project teams´, South African Journal of Business Management, vol. 35, no. 1, pp. 17-25.
16 Leung, H.K.N., Liao, L. and Qu, Y. (2007) ‘Automated support of software quality improvement’, International Journal of Quality & Reliability Management, Vol. 24, No. 3, pp.230–243. McCaffery, F. and Coleman, G. (2007) ‘Developing a configuration management capability model for the medical device industry’, Int. Journal of Information Systems and Change Management, Vol. 2, No. 2, pp.139–154. Nord, J.H., Nord, G.D., Cormack, S. and Cater-Steel, A. (2007) 'An investigation of the effect of Information Technology (IT) culture on the relationship between IT and business professionals', International Journal of Management and Enterprise Development, Vol. 4, No.3 pp. 265-292. Paulk, M.C., Weber, C.V., Garcia, S.M., Chrisis, M.B. and Bush, M. (1993) ´Key Practices of the Capability Maturity ModelSM, Version 1.1´, Technical Report CMU/SEI-93-TR-025, ESCTR-93-178, Software Engineering Institute, Carnegie Mellon University, Pittsburgh, PA. Tiku, S., Azarian, M. and Pecht, M. (2007) ‘Using a reliability capability maturity model to benchmark electronics companies’, International Journal of Quality & Reliability Management, Vol. 24, No. 5, pp.547–563. Woodward, M.R. and Hennell, M.A. (2005) ‘Strategic benefits of software test management: a case study’, Journal of Engineering and Technology Management, Vol. 22, Nos. 1–2, pp.113–140. Vakaslahti, P. (1997) ´Process Improvement frameworks – a Small Case Study with People Capability Maturity Model´, Software Process – Improvement and Practice 3: 225–234. Yoo, C., Yoon, J., Lee, B., Lee, C., Lee, J., Hyun, S. and Wu, C. (2006) 'A unified model for the implementation of both ISO 9001:2000 and CMMI by ISO-certified organizations', Journal of Systems and Software, Vol. 79, No. 7, pp. 954-961.
17
APPENDIX A
18
APPENDIX B Process Areas
A
C
D
G
H
I
J
K
L
Top
Staffing (2)
55 100
51
31 28 10 30
15
5
81
60
63
100
Communication & Coordination (2)
58 100
58
45 17 33 11
11
0
59
54
46
100
Work Environment (2)
44 100
37
27 48
17
0
0
100 64
83
100
Performance Management (2) 53 100
50
0
77
Training and Development (2) Compensation (2)
B
E
0
11 15
93 100 110 49 56 39 100
F
4
6
40
0
77
29
100
42
97
11 100 52
40
94
76
68 18 21 62
98
0
100 65 100
95
Competence Analysis (3)
-
-
38
82
0
0
57
98
0
75
37
31
95
Workforce Planning (3)
-
-
50
4
0
0
34
96
0
96
45
66
95
Competency Development (3)
-
-
8
0
0
0
8
92
0
100 46
68
95
Career Development (3)
-
-
0
0
0
0
0
94
0
42
15
12
90
Competency-Based Practices (3)
-
-
49
25
0
0
31 100
0
78
62
56
96
Workgroup Development (3)
-
-
79
7
0
0
56 100
0
88
71
87
100
Participatory Culture (3)
-
-
60
38
0
0
25
67
0
92
71
63
96
Competency Integration (4)
-
-
Empowered Workgroups (4)
-
Competency-Based Assets (4)
-
Quantitative Performance Management (4)
8
0
0
0
10
0
0
8
0
88
100
65
0
0
0
27
17
0
56
0
42
100
-
13
0
0
0
17
19
0
80
0
8
88
-
-
73
0
0
0
29
65
0
80
44
33
100
Organisational Capability Management (4)
-
-
14
7
0
0
2
19
0
55
2
13
92
Mentoring (4)
-
-
38
0
0
0
0
75
0
7
0
7
100
Continuous Capability Improvement (5)
-
-
37
0
0
0
12
60
0
38
0
35
100
Organisational Performance Alignment (5)
-
-
22
0
0
0
25
0
0
28
0
47
72
Continuous Workforce Innovation (5)
-
-
26
0
0
0
5
100
0
35
0
54
89
16
27
44
17
8
4
23
57
1
67
35
49
95
Compliance %