Vision-based Mapping with Cooperative Robotsâ. James J. Little. Cullen Jennings. Don Murray. Computer Science Dept. University of British Columbia.
Vision-based Mapping with Cooperative Robots∗ James J. Little
Cullen Jennings
Don Murray
Computer Science Dept. University of British Columbia Vancouver, BC, Canada V6T 1Z4 {little,jennings,donm}@cs.ubc.ca ABSTRACT Two stereo-vision-based mobile robots navigate and autonomously explore their environment safely while building occupancy grid maps of the environment. The robots maintain position estimates within a global coordinate frame using landmark recognition. This allows them to build a common map by sharing position information and stereo data. Stereo vision processing and map updates are done at 3Hz and the robots move at speeds of 200 cm/s. Cooperative mapping is achieved through autonomous exploration of unstructured and dynamic environments. The map is constructed conservatively, so as to be useful for collision-free path planning. Each robot maintains a separate copy of a shared map, and then posts updates to the common map when it returns to observe a landmark at home base. Issues include synchronization, mutual localization, navigation, exploration, registration of maps, merging repeated views (fusion), centralized vs decentralized maps. Keywords: mobile robots, navigation, stereo vision, collaboration, exploration
1. INTRODUCTION Most robots that successfully navigate in unconstrained environments use sonar transducers or laser range sensors as their primary spatial sensor.1–5 Computer vision is often used with mobile robots, but usually for feature tracking, or landmark sensing, and not often for occupancy grid mapping or obstacle detection. In this paper, we present a working implementation of a cooperative mapping system using stereo-based robots. They use correlation-based stereo vision and occupancy grid mapping to successfully navigate and autonomously explore unknown and dynamic indoor environments. Their goal is to share a map, without interfering with each other’s use of the map. Simple schemes for cooperation lead the robots to corrupt each other’s results. We develop a method for using a landmark easily sensed with stereo as a home base, to which measurements can be registered. Both robots independently maintain a map and cache their sensory information together with records of their odometry. Upon seeing home base again, a robot corrects its sensory data to remove odometry errors, and updates the common map. The common map then reflects all data seen by either robot that has been registered to home base. Our initial robot, Spinoza,6 demonstrated stereo-based mapping and navigation. Murray and Jennings7 we presented algorithms for path planning and exploration using the generated map. Murray and Little8 describes how the stereo system operates and shows how to analyze the stereo data and compensate for various systematic errors that can occur, yielding a robust system. Localization is the problem of identifying the current location of a mobile robot. Given a known initial position and perfect odometry, the problem is a simple matter of calculation. However, in an unknown initial position, a robot needs to refer to its environment to determine its location in an external coordinate system. Even with a known initial position, drift in odometry causes the estimated position to deviate from the correct position, requiring correction. One solution is to supply landmarks, distinctive locations with identifiable appearances, and then provide a sensing method to identify the landmarks and localize the robot with respect to them. This engineering solution is prohibitively expensive except where its cost can justified, as in hospitals or factories.1 ∗This research was supported by grants from the Natural Sciences and Engineering Research Council of Canada and the Networks of Centres of Excellence Institute for Robotics and Intelligent Systems.
One can also search the local environment for visually distinctive locations and record these locations and a method to identify them (usually their visual appearance) as landmarks. This obviates the need to instrument the world and is preferable. A robot can acquire images and derive image descriptions that permit it to localize itself.9 One limitation of such an approach is that the appearance of surfaces varies significantly with differing viewpoints and is invariant only under restrictive assumptions. Other systems concentrate on known types of visual events, finding vertical lines associated with doors, or using range sensing, such as laser stripe systems, sonar, or active stereo vision to find locally salient geometric locations, such as corners, door joists, or pillar/floor junctions. Our current visually guided robot, Jos´e, maps its environment using real-time trinocular stereo from a camera fixed in the direction of motion. Jos´e integrates in a simple manner the recent stereo data with previous data in a 2D occupancy grid, used for navigation and obstacle avoidance. Features found in such maps are often used as landmarks for navigation. In our work, we combine the dense 2D occupancy grid with sparse 3D landmarks. Geometric information derived from stereo varies predictably with viewpoint, and can be a rich descriptor of the scene. A common solution for defining both the structure of the environment and distinctive locations is to track “corners”, local 2D image features, over long sequences of image frames,10 as the corners undergo incremental motion in the image. The 3D location of the corner points and the motion of the sensor can be determined.11 Little, Murray and Lu12 show how to eliminate corners from consideration that arise from accidental alignments, retaining only those corners that lie on a relatively flat (almost planar) surface. The resulting system provides distinctive landmarks visible over a wide range of viewpoints. Landmarks can provide the skeleton of a topological basis for coordinate system in which several robots or sensors can operate. When two sensors observe a sufficient set of landmarks, they can derive, using their own interior camera orientation, their exterior orientation. This permits them to describe their observations in a common coordinate system. Several systems in particular have used scene features as landmarks. Borthwick and Durrant-Whyte13 base their system on detecting corner and edge features in 2D, with no a priori knowledge of features or map necessary. It uses Extended Kalman Filtering14 to estimate both feature locations and robot position. The features assume a rectilinear world. Weckesser et al.15 use a priori landmarks at known positions in the global coordinate frame and particular models for landmarks (such as door jambs). Their system uses active stereo cameras and can effectively solve for pose of robot with respect to landmarks. The drawback is the need for models and prior knowledge of world. Thrun and Bucken16 have a system based on sensing regular landmarks, i.e., not distinctive landmarks (for example, overhead lights, doorways). It uses a Bayesian approach implemented in neural nets, and learns which landmarks are most salient. We are building a system in which several cooperating robots17 can share a world coordinate frame, localize themselves in the frame, and align all their data within it. It is impossible to keep coordinate frames consistent at all times, but the frames can be locally consistent. The local frame is important for current obstacle avoidance and task-specific activities. The system requires a “motion sensor” (odometry). We have used visual sensing since GPS and DGPS will not work in may environments (ones where you can’t see the sky). Our system uses edges found in occupancy grids as “corners”, but these corners are physical, not appearancebased. A particular pair of such corners forms home base, a landmark that is easily sensed with stereo and can support pose determination. While executing a traverse through the environment, the robot can mark corners for later use. When it returns, it updates the map using corrected raw data. Section 2 describes the robots and how they see in stereo and build maps using occupancy grids. Section 3 shows how we detect corner features in the occupancy grids and use them to localize the robots. Section 4 describes our protocol for sharing stereo data acquired during exploration in a common map. The final section concludes and describes future work.
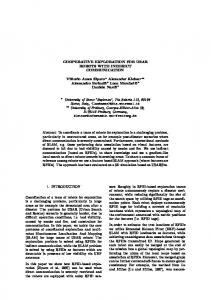
Figure 1. Jos´e and Eric, the mobile robots.
2. THE ROBOTS 2.1. Mobile robots: Jos´e and Eric We used a Real World Interfaces (RWI)† B-14 mobile robot, Jos´e, to conduct our experiments in vision-based robot navigation. Jos´e is equipped with a PentiumT M PC running the Linux operating system as its onboard processing. Jos´e has an Aironet ethernet radio modem that allows communication to a host computer, as well as a Matrox Meteor RGB frame grabber connected to a Triclops trinocular stereo vision camera module. The Triclops stereo vision module was developed at the UBC Laboratory for Computational Intelligence (LCI) and is being marketed by Point Grey Research, Inc.‡ Jos´e’s partner, Eric, is identically equipped. The stereo vision module has 3 identical wide angle (90◦ degrees field-of-view) cameras. The system is calibrated using Tsai’s approach.18 Correction for lens distortion, as well as misalignment of the cameras, is performed in software to yield three corrected images. These corrected images conform to a pinhole camera model with square pixels. The camera coordinate frames are co-planar and aligned so that the the epipolar lines of the camera pairs lie along the rows and columns of the images.
2.2. Trinocular Stereo Algorithm The trinocular stereo approach is based on the multibaseline stereo developed by Okutomi and Kanade.19 Each pixel in the reference image is compared with pixels along the epipolar lines in the top and left images. The comparison measure used is sum of absolute differences (SAD). The results of the two image pairs (left/right, top/bottom) are summed to yield a combined score. Multibaseline stereo avoids ambiguity because the sum of the comparison measures is unlikely to cause a mismatch—an erroneous minimum in one pair is unlikely to coincide with an erroneous minimum in another pair. Figure 2 shows a rectified image of our lab and the corresponding disparity image.
2.3. Mapping with occupancy grids Occupancy grid mapping, pioneered by Moravec and Elfes,20,21 is the most widely used robot mapping technique due to its simplicity and robustness and also because it is flexible enough to accommodate many kinds of spatial sensors. It also adapts well to dynamic environments. We selected it for all these reasons. The technique divides the environment into a discrete grid and assigns each grid location a value related to the probability that the location is occupied by an obstacle. Initially, all grid values are set to a 50% value (i.e., equal probability for occupied and unoccupied). Sensor readings supply uncertainty regions within which an obstacle is expected to be. The grid locations that fall within these regions of uncertainty have their values increased while locations in the sensing path † www.rwii.com
‡ www.ptgrey.com
Figure 2. Rectified image of our lab (left). Disparity image produced by the Triclops system (right). Nearer is brighter. Regions that either lack texture or have poor matches appear in white. The reflections of the chairs appear in the floor; later processing removes these erroneous areas. between the robot and the obstacle have their probabilities decreased. The system also maintains a map indicating which regions have been seen during exploration.
2.4. Constructing top-down views from stereo images Although occupancy grids may be implemented in any number of dimensions, most mobile robotics applications (including ours) use 2D grids. This may be viewed as unfortunate as stereo data provides information about the world in 3D. Much of this data is lost in the construction of a 2D occupancy grid map. This reduction in dimension is justified since indoor mobile robots fundamentally inhabit a 2D world. The robot possesses 3 DOF (X, Y, heading) within a 2D plane corresponding to the floor. The robot’s body sweeps out a 3D volume above this plane. By projecting all obstacles within this volume to the floor, we can uniquely identify free and obstructed regions in the robot’s space. Figure 3 shows the construction of the 2D occupancy grid sensor reading from a single 3D stereo image. Figure 3(a) shows the reference camera grayscale image (160x120 pixels). The resulting disparity image is shown in Figure 3(b). The white regions indicate areas of the image which were invalidated and thus not used. Darker areas indicate lower disparities, and are farther away from the camera. Figure 3(c) shows a column-by-column projection of the disparity image, taking the maximum valid disparity in each column. The result is a single row of maximum disparities. These represent the closest obstacle in each column. Figure 3(d) shows this column values converted into distance, and (e) shows these distance values converted into an occupancy grid representation, with black indicating the uncertainty region around the object, and white indicating regions that are clear. Notice the two “spikes” on the left hand portion of Figure 3(d). These were caused by mismatches in the stereo algorithm and their causes and removal are discussed in.12 The process illustrated in Figure 3 generates the input into our stereo vision occupancy grid. The mapping system then integrates these values over time, to expand the map, and keep it current in the changing world.
3. LOCALIZATION IN OCCUPANCY GRIDS We will do localization using visual information stored in an occupancy grid, so we need to detect features in the map. Corners are appealing because they are distinctive, provide 2 degrees of freedom of constraint, occur frequently in indoor environments, and stand out well in occupancy grids, despite quantization.
(a)
(b)
(c)
(e)
(d)
Figure 3. From stereo images to top-down views: (a) grayscale image (b) disparity image (white indicates invalid, otherwise brighter indicates closer to the cameras) (c) the maximum disparity in each column of the disparity image (d) depth versus column graph (depth in centimetres) (e) the resultant estimate of clear, unknown and occupied regions (white is clear, black is occupied and gray is unknown)
Figure 4. Edges found in the occupancy grid (left), and the occupancy with landmarks found (right). There are many ways to detect features (correlation, Hough transform, Karhunen-Loeve Transform) but we chose a least square model matching approach because it is capable of subpixel resolution, fast, and trackable, meaning if we have an estimate of solution, we can use this to find the real solution.
3.1. How we do it First we find boundaries between empty and solid space in the occupancy grid, and call these edges. Next, we find possible locations for corner models and use these as initial estimates. Third, we do a least-squares fit of a corner model to the edge data. Finally, we pick the best one. Once we have found the corner feature, we can use it and its original reference location to update the position and orientation of the robot. We found the orientation of a single corner could not be determined accurately enough, so we use two corners and take the angle between them to find the angle update. Another alternative would be to use a magnetic compass for orientation and put the robot in approximately the same location when updating odometry. At the same location, magnetic deviation would be the same. Another possibility is to use an inexpensive gyro compass, 3.1.1. Finding edges in map We grow regions of certainty in the map into regions of uncertainty. Certain areas are regions that have high confidence that they are empty or occupied; we mark these regions as empty or unoccupied. We preserve the regions that have never been seen. Next we find occupied regions that are adjacent to empty regions and mark them as “edge” pixels. Models are fit directly to edge grid locations. This could be improved with a quadrature filter technique like Gabor filters and some sort of non-maximal suppression to detect edges. Figure 4 shows, at left, the edges found by this process, in a section of the occupancy grid.
3.2. Model initialization Our problem is finding initial estimates of possible locations that might fit a corner model. We start with the edge image. We dilate this several times and then compute an orientation map for each grid location—the ith bit is set if a line in the dilated edge map can extend for a fixed number of grid locations from this location in a direction of i × 45◦ . Then we determine the corner map by looking within the orientation map for grid locations that have the ith and the (i + 2)th bits set. Search for a model fit is performed in the dilated edge map in order to save processing time.
3.3. Model fitting The problem is to fit a model of a corner that is parameterized by X, Y, Θ, to the edge grid locations given an initial estimate of position and orientation. The model of the corner is discretized into n points, labeled m1 , m2 , ..mn and evenly distributed along the model. Let x = [X, Y, Θ]T Now the n points can be determined as a function of x so mi = fi (x) Let x0 be the initial estimate of x. The error of the model at each point mi is the distance from mi to the nearest edge location. A Euclidean distance metric is used. These distances form the vector dist(m1 , nearestedge), dist(m2 , nearestedge), e= . .., dist(mn , nearestedge), The vector e has the distance from each point to the nearest edge. The Jacobian, J, of e with respect to x is computed by evaluating the partial derivative of ∂dist(fi (x), nearestedge) ∂xj evaluated around the current estimate of x. Most of the time in localization is spent finding the nearest edge location to a given point while computing the Jacobian. Following the technique of Newton, the change in x from this estimate xi to the next estimate xi+1 is given by: J(xi+1 − xi) This is an overconstrained system since the model as discretized into n points and this is a much larger that the 3 DOF of the model. The least squares solution to this is given by min ||J(xi+1 − xi) − e||2 This is the same as solving the normal equations J T J(xi+1 − xi) = J T e This model fitting works much better when this system of equations is stablized by adding the constraint xi+1 − xi = 0 to the original problem. Of course, this constraint needs to be appropriately scaled in the least-squares solution, as shown in.22 We measure position in grid cells and angle in degrees and scale all constraints equally by 0.1. This basically says we would prefer to change the solution by 10 grid locations to avoid a 1 grid location error. Let the matrix W 1 be 10 I. The system we wish to find the least squares solution to becomes: � � � � J e (xi+1 − xi ) = W 0 and the normal equations become (J T J + W T W )(xi+1 − xi ) = J T e These are solved with Gauss j order elimination with pivoting on the optimal row. The system is run for 10 iterations or until the change from the previous iteration is very small. Although extensive experiments have not been done, convergence seems fairly good, and normally occurs after 3 iterations.
(a)
(b)
Figure 5. (a) shows the initial map with the landmarks located (b) shows the map after returning to home base with the re-localized landmarks. This shows the amount of drift in the odometry readings: 2.4m in x and 1.1m in y. The total length of the traverse is approximately 82m.
3.4. Picking the best match There are several steps to selecting the best fit corner: 1. first eliminate all models with an RMS error above 1.5 pixels. This is one of the few “magic numbers” in the system. 2. pick the model closest to the estimated location Figure 5 shows, at left, the input occupancy grid, created by rotating the robot in place near a pair of corners, and the corners found. Our current implementation is at an early stage and there are many possibilities for improvement.
4. SHARING MAPS BETWEEN ROBOTS We describe how the robots maintain local maps and then update a shared map after observing home base and determining the correction to their odometry. The simplest form of cooperation in mapping is that both robots, Eric and Jos´e, explore the world and contribute their updates, in the form of radial maps, to a common shared map. The advantage of this is that each has access to the information from the other robot at all times. The disadvantage is that their independent errors in pose will corrupt the common map. The ideal situation is where both robots live in a world where their positions are well known with respect to a common coordinate system at all times, but this is difficult. Our goal is to build this mesh of landmarks to permit their use at all times. The current scenario: each robot begins by initializing itself with respect to a corner landmark (home base) and then begins its traverse of the world. While doing the traverse, it generates stereo maps and compresses them into 1D maps of maximum disarity versus image column, termed a radial map. It updates its own copy of the occupancy grid, while recording radial maps it sees, as well as its position and orientation when each radial map is acquired. At the end of a traverse, it has returned to home base, at which point it can determine its position and orientation (pose) relative to the home base. The difference between its actual pose and its pose estimated from the odometry of
(a)
(b)
Figure 6. The result of a long traverse out the lab door, around the lab through a corridor, and back into the lab through the back door (a) before correction (b) After correction. The robot path is drawn in by hand. In the original map the drift has caused two areas to merge into one. In the corrected map, the corridors appear more rectilinear. the vehicle is an error that must be corrected before its data can be merged with the common map. Figure 5 shows, at right, the map with the corners as seen after the traverse, as well as the original corners. The advantage with this scenario is that Eric’s data (uncorrected) does not corrupt Jos´e’s map and vice versa. The disadvantage is that information is shared only after periodic updates.
4.1. Rebuilding the map after localization The error in pose of the robot can be used to adjust the position and orientation of all measurements acquired during a traverse. We make the simple assumption that all errors occur uniformly distributed by path length along the length of the traverse. We recompute new poses for each radial map and then add the corrected observations to the shared map. The robot then re-imports the shared map (to receive all correct improvements from other robot partners) and begins a new traverse. The assumption that errors occur uniformly over the path length is, of course, an oversimplification of the problem. Odometry errors occur as a combination of systematic drift and incidental slips. They are often distributed in a random fashion, and also depend on many unknown parameters. These include floor inclination, floor covering or texture, robot wheel orientation, and relative robot orientation to oriented floor texture such as tiles. Our robots are driven in paths composed of straight segments coupled by rotation-only movements. This motion provides the minimum errors in odometry readings. For map correction, we assume that all orientation errors occur only during rotation movements, and translation errors occur during translation movements. While the latter assumption is quite strong, the former is not. We have found that paths during translation are not straight. A small drift in orientation can be caused by difference in wheels, or in the relative orientation of several wheels. A typical measured orientation drift over a translation of 8m is 2.5◦ . Until Eric returns to the home base, it does not share in the data produced by Jos´e, and vice versa. The disadvantage of this scheme is apparent: each robot is ignorant of the other’s data until the other has checked in at home base. However, the method does prevent one robot from polluting the other’s map. Figure 6(a) shows the occupancy grid map created by a long traverse about our lab. At right, the figure shows the map created with compensated robot positions. The total run was 82m long. The odometry error determined from landmark localization was 2.64m and 25.4◦. Although one can see that the corrected map has improved somewhat, the correction has not straightened the corridors. This is due to the assumption that orientation errors do not occur during translation.
5. CONCLUSIONS AND FUTURE WORK We have demonstrated a working system in which a pair of robots jointly explore an unstructured environment and build an occupancy grid map of it. The robots maintain independent maps while exploring. When they return to home base they determine a correction from the geometry of the home landmark, correct their recorded raw odometry and stereo data, and update the shared map. Thus each can acquire the information of the other’s exploration after correction. The asynchronous updates are handled upon return to home base. The system presented lays the groundwork for a more comprehensive cooperative mobile robot environment. As they map the world, they can note all corners seen. When one robot encounters a corner seen by another, they can re-localize within a new, local coordinate frame associated with this landmark and begin sharing maps. They don’t have to make it back to home base, can start a new home base with a new landmark, this leads to nodes that will be useful for creating topological maps, by linking locally consistent frames. As well, exploration can be a cooperative task. A robot can alter its exploration behaviour given knowledge of the other partners’ exploration activities. This modified behaviour could take the form of exploring in another area, following the lead robot and fixing up errors in the first mapping pass, or even simultaneously obtaining information from multiple viewpoints for a single object in the map. Corner localization works well because we are basing the localization on integrated data over several views, more robust than a single reading method. Our current environment uses easy-to-find landmarks placed near the robots at start-up. However, in a man-made environment there are many suitable corners that can be used as landmarks. We can extend the landmark detection method to use ’multi-level’ 2D maps. These are collections of 2D slices of the 3D environment. Near ceilings, room corners are rarely obstructed and are readily apparent. These can be used as commonly occurring landmarks. We have developed a system to use the optical flow produced during rotation for correcting the impulse-like errors in orientation. Since we know the depth at visible locations from our stereo system, we can compute the actual rotation of the robot from the observed movement of objects in the image (optical flow). At present this works when the robot rotates in place. This process is quite accurate, and can determine rotations of up to 45◦ within .25◦ error. We are planning to replace the odometry readings for motion estimation with the above mentioned optical flow rotation estimate, combined with an inertial measurement system for translation estimates. Inertial measurement units have a consistent, unbiased error model based on distance traveled and will not be subject to problems with odometry such as different floor surfaces and orientation. This will permit us to use a more tractable error model for our motion estimation and will result in better corrected maps. The world is composed of static (walls, floors), semi-static (furniture), and movable (people, robots) objects. The robots are recording semi-static and movable objects as well as static objects. With maps registered in the same coordinate frame over many runs, the occupancy grid cells can be statistically classified depending upon the variation in their values. Thus, cells that are almost always unoccupied and appear to now be occupied can be classified as moving objects. Cells that are split between occupied and unoccupied are semi-static objects, such as a door, and regions that are consistently occupied are part of the fixed environment.
ACKNOWLEDGMENTS Special thanks to Rod Barman, Stewart Kingdon, and the rest of the Robot Partners Project.
REFERENCES 1. S. B. N. et al., “Ark: Autonomous navigation of a mobile robot in a known environment,” in IAS-3, pp. 288–293, 1993. 2. G. Dudek, M. Jenkin, E. Milios, and D. Wilkes, “On building and navigating with a local metric environmental map,” in ICAR-97, 1997. 3. G. Dudek, E. Milios, M. Jenkin, and D. Wilkes, “Map validation and self-location for a robot with a graph-like map,” Robotics and Autonomous Systems 22(2), pp. 159–178, 1997. 4. R. A. Brooks, J. Connell, and P. Ning, “Herbert: A second generation mobile robot,” A.I. Memo No. 1016, MIT AI Laboratory, January 1988.
5. R. A. Brooks, “A robust layered control system for a mobile robot,” IEEE Journal of Robotics and Automation RA-2, pp. 14–23, 1987. 6. V. Tucakov, M. Sahota, D. Murray, A. Mackworth, J. Little, S. Kingdon, C. Jennings, and R. Barman, “Spinoza: A stereoscopic visually guided mobile robot,” in Proceedings of the Thirteenth Annual Hawaii International Conference of System Sciences, pp. 188–197, Jan. 1997. 7. D. Murray and C. Jennings, “Stereo vision based mapping for a mobile robot,” in Proc. IEEE Conf. on Robotics and Automation, 1997, May 1997. 8. D. Murray and J. Little, “Interpreting stereo vision for a mobile robot,” in IEEE Workshop for Perception for Mobile Agents, pp. 19–27, June 1998. 9. S. Oore, G. Hinton, and G. Dudek, “A mobile robot that learns its place,” Neural Computation 9, pp. 683–699, Apr. 1997. 10. J. Shi and C. Tomasi, “Good features to track,” in Proc. IEEE Conf. Computer Vision and Pattern Recognition, 1994, pp. 593–600, 1994. 11. C. Tomasi and T. Kanade, “Factoring Image Sequences into Shape and Motion,” in Proc. IEEE Workshop on Visual Motion, 1991, pp. 21–28, IEEE, 1991. 12. J. J. Little, D. Murray, and J. Lu, “Identifying stereo corners for mobile robot localization,” in IROS-98, 1998. 13. S. Borthwick and Durrant-Whyte, “Simultaneous localisation and map building for autonomous guided vehicles,” in IROS-94, pp. 761–768, 1994. 14. L. Matthies, T. Kanade, and R. Szeliski, “Kalman filter-based algorithms for estimating depth from image sequences,” International Journal of Computer Vision 3, pp. 209–236, 1989. 15. P. Weckesser, R. Dillmann, M. Elbs, and S. Hampel, “Multiple sensorprocessing for high-precision navigation and environmental modeling with a mobile robot,” in IROS-95, 1995. 16. S. Thrun and A. Bucken, “Learning maps for indoor mobile robot navigation,” tech. rep., CMU-CS-96-121, Apr. 1996. 17. J. J. Little, “Robot partners: Collaborative perceptual robotic systems.” http://www.cs.ubc.ca/little/, 1997. 18. R. Y. Tsai, “A versatile camera calibration technique for high-accuracy 3d machine vision metrology using off-the-shelf TV cameras and lenses,” IEEE Journal of Robotics and Automation 3, pp. 323–344, 1987. 19. M. Okutomi and T. Kanade, “A multiple-baseline stereo,” IEEE Transactions on Pattern Analysis and Machine Intelligence 15(4), pp. 353–363, 1993. 20. H. Moravec and A. Elfes, “High-resolution maps from wide-angle sonar,” in Proc. IEEE Int’l Conf. on Robotics and Automation, (St. Louis, Missouri), Mar. 1985. 21. A. Elfes, “Using occupancy grids for mobile robot perception and navigation,” Computer 22(6), pp. 46–57, 1989. 22. D. G. Lowe, “Fitting Parameterized Three-Dimensional Models to Images,” IEEE Transactions on Pattern Analysis and Machine Intelligence 13, pp. 441–450, May 1991.