Randy Pausch, â3D Magic Lenses,â in Proc. ACM. Symp. User interface software and technology, 1996, pp. 51â58. [5] C. W. Borst, V. B. Baiyya, C. M. Best, and ...
VISUAL ASSISTANCE TOOLS FOR INTERACTIVE VISUALIZATION OF REMOTE SENSING DATA Martin Lambers and Andreas Kolb Computer Graphics and Multimedia Systems Group Institute for Vision and Graphics Center for Sensor Systems (ZESS) University of Siegen, Germany {lambers,kolb}@fb12.uni-siegen.de ABSTRACT Interactive visualization systems allow extensive adjustments of the visualization process, to give the user full control over the visualization result. However, this flexibility increases the complexity of the user interface, impeding the task of finding a suitable set of visualization parameters for a given problem. Visual assistance tools can guide the user in this process, thereby helping to manage the complexity. In this paper, we show how two of such tools, lenses and detectors, can be applied to interactive visualization of remote sensing data. Index Terms— Visualization 1. INTRODUCTION Interactive visualization of remote sensing data gives the user much control over the visualization result. In the ideal case, the complete processing chain that is necessary to map sensor data to geometry or color can be manipulated interactively. Additionally, interactive data fusion allows weighting and blending of data sets from different modalities. For example, one view might combine a Digital Elevation Model (DEM), a Synthetic Aperture Radar (SAR) amplitude image, a multispectral image, and temperature data. For the DEM, a hole-filling or postprocessing filter might be applied. For the SAR image, despeckling and dynamic range reduction methods can be chosen and adjusted. For the multispectral image, specific bands or band combinations can be chosen. The temperature data can be mapped to various color scales. Finally, blending weights can be adjusted to overlay SAR, multispectral, and temperature data. In this scenario, the user has a lot of interactive control and can fine-tune all methods and parameters interactively to achieve the optimal result for the given task. However, this flexibility comes at a price: finding the optimal set of methods and parameters can be difficult and time consuming. Various user interface concepts have been proposed to help the user manage the complexity of interactive visualization. In this paper, we show how two of these concepts, lenses
and detectors, can be applied to interactive visualization of multimodal remote sensing data. We integrate both concepts into our visualization framework and present results. 2. FRAMEWORK We built a framework for interactive visualization of multimodal remote sensing data [1]. The framework uses graphics processing units (GPUs) to a large extent to meet the demand for computational power that this task requires. In this section, we will briefly review aspects of the framework that are immediately relevant for the implementation of lenses and detectors. From a visualization point of view, there are two categories of sensor data. Geometry data is mapped to vertices by the visualization system. This kind of data is usually provided as DEMs. Texture data is sensor data that is in some way mapped to color or transparency layers. This category includes orthophotos, SAR images, multispectral images, and any kind of data that can be mapped to color scales. Remote sensing data sets typically are very large, and continue to grow as sensor technology improves. Therefore, hierarchical data structures such as quadtrees are necessary to manage the data and to form the base of a Level of Detail (LOD) method applied during rendering [2]. In our framework, the base data structure for all data sets is a unified quadtree variant based on the WGS84 map. All input data sets (both geometry and texture) are mapped to this hierarchy in a preprocessing step. See Fig. 1. For each frame that is rendered, the application chooses a subset of this quadtree as a conservative estimation of the level of detail for the rendered scene. This subset is called the rendering quadtree, and determines the hierarchical subset of each input data set that needs to be processed for rendering. The framework lets the user interactively define the processing chains that map the sensor data to geometry and color. This processing is performed for each rendered frame, on all quads of the rendering quadtree, for all input data sets. The
select
DEM 2
select
OrthoPhoto
select
SAR Image
select
processing
Level 1
Level 2
GPU
processing
processing
Visualization
DEM 1
Combination
Level 0
processing
User data flow
control flow
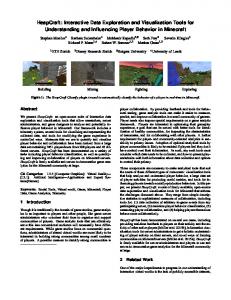
Fig. 2. Processing and combining remote sensing data prior to visualization, based on user interaction. Level 3
Fig. 1. Quadtree for a data set. The original data set is marked green. Quads that contain relevant data are marked blue. processed results (geometry and color quads) are then combined, again using parameters that can be interactively defined by the user. An overview of the data and control flow is given in Fig. 2. As a consequence, visual assistance tools that help the user with the task of choosing visualization methods and parameters need to work on the same data representation level as the processing, i.e. sensor data stored in a quadtree hierarchy. In particular, they can not work on a data representation that depends on the visualization result, because they are used to steer this result. 3. LENSES The concept of the lens allows two sets of visualization parameters to be active at the same time: one global set, and one local set that only applies to the region of the lens. This concept allows to compare two different parameter sets directly, thus giving additional insight into the data and simplifying the choice of a particular parameter set. The lens metaphor was introduced by Bier et al. as a rectangular sub-region of the 2D screen space [3]. In this subregion, visualization methods differ from those used in the rest of the screen space. This lens metaphor is applied mainly to 2D shapes, but an initial example for lens usage in a 3D scene is also given. Viega et al. introduced a 3D volumetric lens that is a
sub-region of the 3D object space instead of the 2D screen space [4]. This lens metaphor is used to inspect 3D objects. Borst et al. applied this volumetric lens concept to remote sensing data [5]. The implementation of lenses is specific to the application. For a 3D lens as used by Borst et al., it is necessary to know the geometry of the scene at the time the lens is applied. The same is true for 2D looking glass lenses. Both kinds of lenses need to determine the part of the geometry for which they are relevant. In contrast, in our situation we do not know the geometry before the lens is applied, because the geometry depends on the visualization parameters defined by the lens. For example, a lens might define processing parameters for a DEM data set that differ from the global parameters. Therefore, a lens in our framework must be defined in terms of a geometry that is fixed regardless of visualization parameters. To this end, we define our lens as a 2D circular area on the WGS84 geoid, given by a center and a radius. Since each quad of the quadtree hierarchy describes an area on the WGS84 geoid (see Fig. 1), it can be decided the quad is inside the lens, outside the lens, or if it intersects the lens. Therefore, for each quad that is processed for display on screen, it can be decided whether to use the lens parameters, the global parameters, or both for processing. In the latter case, an additional postprocessing step is applied that combines the two resulting quads into a single quad by determining for each sample whether it lies inside or outside the lens. Since this lens concept is applied before data processing and combination, it is guaranteed to produce a consistent and crack-free geometry even at the border of the lens. This is in contrast to 2D and volumetric lenses, where different visualization methods may lead to inconsistencies at the lens borders. 4. DETECTORS A detector allows the visualization system to find interesting features in the sensor data in real time. The system can then
Fig. 3. Example for lens functionality in the visualization framework. Two DEMs and two texture data sets are processed, combined, and displayed using different parameters (left, middle). A combined view using the lens allows direct comparison of parameter impact on specific regions (right). display visual hints for each detected feature, thereby guiding and assisting the user in exposing the important detail of the data. A detector usually specializes in finding well-defined features in a data set with known properties. Consequently, a very wide range of detectors exists, from generic corner detectors for optical images [6] to oil spill detectors for radar images [7]. Feature detection can be implemented efficiently on the GPU [8]. Detectors need to work on the sensor data and not on the resulting geometry or color information, both because specialized detectors need access to the original information for best performance, and because geometry and color depend on the processing results and will vary between consecutive rendered frames. To be more useful as visual assistance tools in interactive visualization tasks, detectors may compute additional information about the detected feature, and encode that information in a graphical hint displayed on screen, so that the user not only gets an overview of the interesting features, but also their properties. Selecting a hint then allows the user to examine a feature in detail. An example for such a feature detector is our point target detector for SAR images [9]. We reimplemented this detector in our framework as a basic example; in the context of interactive visualization of multimodal remote sensing data, multiple specialized feature detectors for each modality may exist, concentrating on different kinds of features. Because a detector works on quads from a quadtree hierarchy, the resolution of the data under examination depends on the quadtree level. For some detectors, it might be necessary to adapt to this resolution to find features that have similar sizes in world space. For others, it might make sense to find features of different size depending on the level of detail shown in the rendered view; in this case, the different resolution levels may be ignored. If a feature is detected, it initially only has an associated
2D location on the geoid surface, because the full 3D geometry is not yet known. To get full 3D location information that is necessary to display the visual hints, the elevation data for each feature must be read from the processed and combined DEM quads once these are computed. 5. RESULTS The example in Fig. 3 shows two DEMs, a SAR image, and an RGB image in the same view. The first DEM and the RGB image are part of the NASA Blue Marble Next Generation (BMNG) data set. The second DEM is the augmented SRTM data provided by CIAT [10]. The SAR image was taken by the TerraSAR-X satellite. Different processing and fusion parameters are chosen to produce the left and middle views. In the left view, a mixture of the BMNG topography data and the SRTM data set forms the geometry. In the middle view, a scaled version of the SRTM data is used. Additionally, in the middle view the SAR image shows more contrast and has a greater blending weight so that it dominates the RGB image. The right view shows both parameter sets active at the same time, inside and outside the lens, with a consistent and crack-free lens boundary. Moving the lens over features of interest allows direct comparison of the impact of different parameter sets, thereby easing the task of finding suitable parameters. When the lens is active, most quads still require only processing with one parameter set: the global set or the lens set. Only a few quads on the lens border require processing with both sets and subsequent combination of the results. Therefore, the performance impact of using the lens is small. The example in Fig. 4 shows an ASAR SAR image overlayed on the BMNG data set. SAR point targets are detected in the hierarchical SAR amplitude data as described in [9]. The green markers show the position of detected point targets and a rough quality estimate. Clicking on the markers opens a detailed analysis window.
Marble Next Generation data sets were produced by NASA Earth Observatory (NASA Goddard Space Flight Center). The SRTM data set is provided by the International Centre for Tropical Agriculture (CIAT) [10]. TerraSAR-X data sets c Infoterra GmbH. The ASAR data set is produced from
c European Space Agency (ESA). ESA remote sensing data, 8. REFERENCES [1] M. Lambers and A. Kolb, “GPU-Based Framework for Distributed Interactive 3D Visualization of Multimodal Remote Sensing Data,” in Proc. Int. IEEE Geoscience and Remote Sensing Symposium (IGARSS), 2009.
Fig. 4. Example for a SAR point target detector that gives an overview of the number, location, and quality of SAR point target responses in the current view. Note that although a relatively simple approach was chosen to detect SAR point targets, with an emphasis on speed rather than accuracy, the GPU implementation still requires a significant amount of computational power and slows down the visualization process notably. Therefore, detectors in interactive visualization systems should be used sparingly, and focus on relatively simple and generic features. 6. CONCLUSION Interactive visualization systems offer great flexibility to the user, but with this flexibility comes complexity. This is especially true in the context of visualization of multimodal remote sensing data, since each modality provides its own set of methods and parameters for mapping sensor data to geometry and color, and, additionally, flexible data fusion methods need to be adjusted. To guide and assist the user with the choice of methods and parameters, and to provide additional insight into the data, assistive user interface concepts like lenses and detectors can be used. However, these concepts have to be adapted for this purpose: in contrast to other application scenarios, interactive visualization of remote sensing data requires them to operate on a low-level, hierarchical sensor data representation, since the geometry and appearance of the visualized data is not known a priori. We have integrated two such visual assistance tools into our GPU-based visualization framework to demonstrate their applicability and usefulness. 7. ACKNOWLEDGEMENTS This project is partially funded by grant KO-2960-3/1,2 from the German Research Foundation (DFG). The NASA Blue
[2] R. Pajarola and E. Gobbetti, “Survey of Semi-Regular Multiresolution Models for Interactive Terrain Rendering,” Vis. Comput., vol. 23, no. 8, pp. 583–605, 2007. [3] Eric A. Bier, Maureen C. Stone, Ken Pier, William Buxton, and Tony D. DeRose, “Toolglass and Magic Lenses: The See-Through Interface,” in Proc. ACM SIGGRAPH, 1993, pp. 73–80. [4] John Viega, Matthew J. Conway, George Williams, and Randy Pausch, “3D Magic Lenses,” in Proc. ACM Symp. User interface software and technology, 1996, pp. 51–58. [5] C. W. Borst, V. B. Baiyya, C. M. Best, and G. L. Kinsland, “Volumetric Windows: Application to Interpretation of Scientific Data, Shader-Based Rendering Method, and Performance Evaluation,” in Proc. Int. Conf. Computer Graphics and Virtual Reality, 2007, pp. 72–78. [6] C. Harris and M. J. Stephens, “A Combined Corner and Edge Detector,” in Proc. Alvey Vision Conference, 1988, pp. 147–152. [7] C. Brekke and A. H.S. Solberg, “Oil Spill Detection by Satellite Remote Sensing,” Remote Sensing of Environment, vol. 95, no. 1, pp. 1–13, 2005. [8] F. Diard, GPU Gems 3, chapter Using the Geometry Shader for Compact and Variable-Length GPU Feedback, pp. 891–907, Addison-Wesley, 2008. [9] M. Lambers and A. Kolb, “Automatic Point Target Detection For Interactive Visual Analysis of SAR Images,” in Proc. Int. IEEE Geoscience and Remote Sensing Symposium (IGARSS), July 2008. [10] A. Jarvis, H.I. Reuter, A. Nelson, and E. Guevara, “Hole-filled Seamless SRTM Data V4,” 2008, International Centre for Tropical Agriculture (CIAT), http://srtm.csi.cgiar.org.