IEEE TRANSACTIONS ON PATTERN ANALYSIS AND MACHINE INTELLIGENCE,
VOL. 24, NO. 3,
MARCH 2002
313
Visual Input for Pen-Based Computers Mario E. Munich, Member, IEEE, and Pietro Perona, Member, IEEE Computer Society AbstractÐThe design and implementation of a camera-based, human-computer interface for acquisition of handwriting is presented. The camera focuses on a standard sheet of paper and images a common pen; the trajectory of the tip of the pen is tracked and the contact with the paper is detected. The recovered trajectory is shown to have sufficient spatio-temporal resolution and accuracy to enable handwritten character recognition. More than 100 subjects have used the system and have provided a large and heterogeneous set of examples showing that the system is both convenient and accurate. Index TermsÐSystems and applications, active and real-time vision, pen-based computing, pen-based interface.
æ 1
S
INTRODUCTION
AND
MOTIVATION
WITCHES, turn-knobs, sliders, keyboards, and mouses are currently the most popular interfaces between humans and machines. However, they are far from perfect. They are effective for many tasks, but for many other tasks they are inconvenient, inadequate, or too bulky. The first shortcoming is size. Exponential progress in VLSI and storage technology makes it possible to miniaturize computers and embed them in gadgets as diverse as digital cameras, cell phones, personal digital assistants (PDAs), dolls, and personal computers (PCs). The size of the typical PC and PDA is today mainly determined by the size of their human-machine interfaces: while we can shrink the size of the electronics and storage devices, a keyboard is nonshrinkable since it must fit the human fingers. The second shortcoming is inconvenience. When we communicate with a machine we must abandon our favorite means of communication: talking, gesturing, sketching, handwriting, and adopt the machine's mean's of communication: typing, mouse-clicking, knob-turning. Learning to use a keyboard effectively requires time and patience. Ditto for menu-based mouse interfaces. Current interfaces were designed for habitual computer users and for a limited range of tasks. If the ªcomputer revolutionº is to reach and benefit the majority of the world population, more intuitive interfaces have to be designed. If machines are to become our helpers, rather than ever more complicated tools, they must be designed to understand us, rather than us having to learn how to use them. The third shortcoming is inadequacy. Our machines and the rest of our world are not well-integrated because machines lack a sensory system. A machine does not know what is happening in its neighborhood, rather it sits and waits for a human to approach it and touch skillfully some of its hardware. Our desktop, our white-board, the visitor in our office are completely unknown to our office PC. There
. M.E. Munich is with Vocalpoint Technologies, 847 Howard Street, San Francisco, CA 94103. E-mail:
[email protected]. . P. Perona is with the Department of Electrical Engineering-136-93, California Institute of Technology, Pasadena, CA 91125. E-mail:
[email protected]. Manuscript received 21 June 2000; revised 19 Jan. 2001; accepted 17 Apr. 2001. Recommended for acceptance by D. Dori. For information on obtaining reprints of this article, please send e-mail to:
[email protected], and reference IEEECS Log Number 112309.
are many tasks that a machine will simply not do because its interfaces are inadequate. One avenue towards improving human-machine interfaces is to imitate nature and develop ªsensesº for machines. Take vision: cameras may be miniaturized, thus allowing the development of small and cheap hardware; humans can easily read the body language, sketches, and handwriting produced by other humansÐif a machine could do the same, this would provide a natural, friendly, and very effective vision-based interface. This interface would allow capturing much information that current interfaces ignore. The computer industry recognized the advantages of using handwriting as the human-machine communication modality. Pen-based interfaces provide convenience, flexibility, and small size. After the unsuccessful introduction of the visionary Apple Newton in the early 1990s, a new generation of pen-based PDAs has established itself in the market. These PDAs (e.g., the popular PalmPilot) represent an interesting compromise. Their input device is the computer screen: The screen must be as large as possible for convenience of use and as small as possible for portability. The optimal size, as identified by the market (approximately 12x8 cm), makes PDAs acceptable but definitely not excellent on both counts. Handwriting may also be captured using a video camera and computer vision techniques, rather than the traditional tablets and touch-sensitive screens. This is an attractive alternative because cameras may be miniaturized thus making the interface much smaller. Furthermore, a visionbased system would allow the user to write at will on any convenient surface, e.g., write on a piece of paper with a normal pen, on a blackboard, etc., regardless of size and location. In this paper, we present the first fully online, vision-based interface for conveniently and accurately capturing both handwriting and sketching. The interface is designed to be small and simple to use. It is built with a single consumerelectronics video camera and captures handwriting at high temporal (60Hz) and spatial (about 6,000x2,500 samples) resolution without using a special writing instrument. It allows the user to write at normal speed within a large writing area (more than half a letter-size page) with an output quality that is sufficient for recognition. The input interface consists of a camera, a normal piece of paper, and a normal pen. The camera focuses on the sheet of paper and images the pen tip;
0162-8828/02/$17.00 ß 2002 IEEE
314
IEEE TRANSACTIONS ON PATTERN ANALYSIS AND MACHINE INTELLIGENCE,
computer analysis of the resulting images enables the trajectory of the pen to be tracked and contact of the pen with the paper to be detected. The paper is organized as follows: In Section 1.1, we summarize previous work in this area. This will allow us to motivate our approach and design, which are described in Section 2. Section 3 presents a number of experiments that explore the performance of the system. A few concluding observations, as well as themes for future research, are collected in Section 4.
1.1 Previous Work The literature on handwriting recognition (see [10], [22], [25] for very comprehensive surveys) is divided into two main areas of research: offline and online systems. Offline systems deal with a static image in which the system looks for the handwritten words before doing recognition. Online systems obtain the position of the pen as a function of time directly from the interface. Online systems have better information for doing recognition since they have timing information and since they avoid the initial search step of their offline counterparts. The most popular input devices for handwriting are electronic tablets for online capturing and optical scanners for offline conversion. We are of course interested in building online human machine interfaces. The integration of the electronic and physical aspects of an office has been explored by two ambitious experimental systems. The Digital Desk [30], [31] developed at Rank Xerox EuroPARC merges physical objects (paper documents and pencils) with their electronic counterparts using computer vision and video projection. A computer screen is projected onto a physical desk using a video projector, while a camera is set up to watch the workspace such that the surface of the projected image and the surface of the image area coincide. A tablet digitizer or a finger tracked by the camera, like the system developed at INPG, Grenoble [4], [5], are used to input mouse-type information into the system, allowing one to select or highlight words on paper documents, cut and paste portions of text, draw figures, etc. The Liveboard [6], [19] developed by Xerox is similar in concept to the digital desk. This device is the replacement for the pads of flip-chart paper used in meetings. A computer screen is projected onto a white-board and a cord-less pen is used as input. The same image could be displayed onto boards placed at different locations and the input from each of the boards overlaid on all of them, allowing in this way for remote collaboration. The Digital Desk and the Liveboard are steps towards the integration of paper documents into the computing environment; these systems motivate the development of human-computer interfaces that can collect and interpret sketches and handwriting, and that do not require special hardware such as tablets and instrumented pens. A few vision-based interfaces [2], [14], [15], [18], [32] for handwriting are described in the literature. The MEMOPEN [18] consists of a special pen that carries a small CCD camera close to its tip, a stress sensor, a micro computer, and a memory. The camera captures a series of snapshots of the writing, while the stress sensor detects the pressure applied on the ballpoint to have a record of the pen-up/-down strokes. The images captured by the camera only include a partial portion of the writing, so the whole handwritten trace is recovered by overlaying successive
VOL. 24,
NO. 3,
MARCH 2002
snapshots. This system is quasi online since timing information is provided by the causality of image collection; however, the corresponding recognizer would need to look for the ink trace on the images before doing recognition. Also, the user is forced to write with a special purpose stylus rather than with a common pen. Alternative approaches [2], [32] consist of a video camera aimed to a user writing on a piece of paper. The camera provides a sequence of images at a frequency of 19 Hz. The last image of the sequence is thresholded in order to segment out the written text. The temporal order of the handwriting is reconstructed with a batch process by detecting the trace of ink produced between each two successive images. This detection may be obtained by performing image differencing between successive images at the location of the segmented text. The user is required to write with a white pen under carefully controlled lighting conditions [2]. This system provides the location of the pen tip on each image, but it still requires batch processing after all text have been written. Besides, the ink trace detection method is prone to errors due to changes in lighting conditions and small movements of the writing surface. In contrast with the mentioned systems, our approach [14], [15] is fully online. It obtains data from a fixed video camera and it allows the user maximum flexibility in choosing virtually any pen and writing surface. We track the pen tip in real time in order to reconstruct its trajectory accurately and independently of changes in lighting. As we show in Section 2.5 (see also Fig. 5), our interface increases the spatial resolution of the interface by a factor of 10 (as compared with the batch ink-trace approach [2], [32]) and improves robustness with respect to lighting and small motions of the writing surface. The pen tip is tracked continuously both when the user is writing and when the pen is traveling on top of the paper. The detection of the strokes corresponding to the ink trace is the added burden that our system pays for all the described improvements.
2
VISION SYSTEM
FOR
PEN TRACKING
Our design of the interface is subject to the following constraints: All components (camera, frame grabber, computer) must be cheap and readily available; the user has to be able to write in a comfortable position using a normal pen; the interface has to be simple and intuitive so that user's training time and effort is minimal; the acquired handwritten trajectory has to have sufficient spatio-temporal information to enable recognition. The first premise constrains the selection of the video camera to commercial consumer electronics devices. Typical low-cost cameras have spatial resolution of 480x640 pixels (rows x cols) at a frequency of 30 Hz. Most cameras are interlaced, so each frame is composed of two half-frames with a maximum resolution of 240x640 pixels at a frequency of 60 Hz. Given that the cut-off temporal frequency of handwriting is below 20 Hz [12], [24], [29], we are well above the Nyquist frequency of handwriting by working at 60 Hz, making sure that no frequency component of handwriting is lost. The spatial resolution of the interface should be such that it enables clear legibility of the acquired handwriting. Fig. 1c presents one example image provided by a camera located 30 cm above the writing hand, as shown on Fig. 1b. The resulting acquired trajectory is a signature shown magnified
MUNICH AND PERONA: VISUAL INPUT FOR PEN-BASED COMPUTERS
315
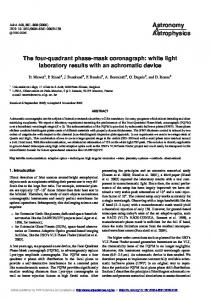
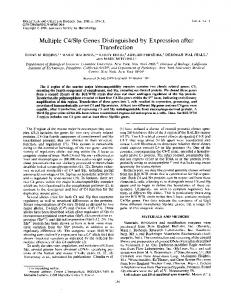
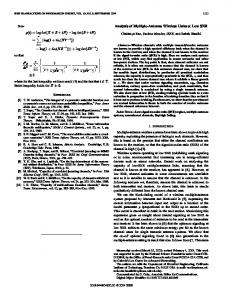
Fig. 1. Overview of the System. (a) Block Diagram of the system. The camera feeds a sequence of images to the preprocessing stage (Section 2.1). This block initializes the algorithm, i.e., it finds the initial position of the pen and selects the template (rectangular subregion of the image) corresponding to the pen tip. In subsequent frames, the preprocessing stage has only the function of cutting a piece of image around the predicted position of the pen tip and feeding it into the next block. The pen tip detector (Section 2.2) has the task of finding the position of the pen tip in each frame of the sequence. The filter (Section 2.3) is a recursive estimator that predicts the position of the tip in the next frame based on an estimate of the current position, velocity, and acceleration of the pen. The filter also estimates the most likely position of the pen tip for missing frames. The ballpoint detector (Section 2.5) finds the position of the very end of the pen tip, i.e., the place where the pen is in contact with the paper when the user is writing. Finally, the last block of our system checks for the presence of ink on the paper at the positions where the ballpoint of the pen was detected (Section 2.6). (b) Experimental setup. The system does not require any calibration. The user has the flexibility of arranging the relative positions of the camera and the piece of paper in order to write comfortably as long as the system has a clear sight of the pen tip. (c) Image provided by the camera. The user has a writing area larger than half a letter-size page. This image is the last frame corresponding to the trajectory shown in (d). The pen tip is tracked continuously, both when the user is writing (pen-down strokes) and when the pen is moving on top of the paper (pen-up strokes). The complete tracked trajectory is shown in (d). (e) Pen-down strokes corresponding to trajectory (d). (f) and (h) Two more examples of handwritten sequences acquired with the interface. (h) and (i) Corresponding pen-down strokes.
in Fig. 1d. This sequence approximately occupies 20 image pixels per centimeter of writing; the spatial accuracy of the interface is 0.1 pixels; thus, the resolution of the system is about 200 samples per centimeter. This signature, as well as the other trajectories presented in the figure are easily readable, showing that this ratio of image pixels per centimeter of writing provides sufficient information for a human to perform recognition. All handwriting examples shown in this paper follow a similar ratio of pixels per centimeter of writing. In order to satisfy the other premises, our interface does not require calibration and provides the user with the flexibility of arranging the relative positions of the camera and the piece of paper. Only two conditions are imposed onto the user, one is that the camera should be located so that it has a clear sight of the pen tip and the other is that the writing implement should have sufficient contrast with the piece of paper.
Fig. 1 shows the block diagram of the system, the experimental setup, an example of an image provided by the camera, and three pen tip trajectories captured with the interface along with their corresponding pen-down strokes. These examples show an important difference between our interface and conventional handwriting capture devices: We obtain a continuous trajectory by tracking the position of the pen tip in each of the images in the sequence; for some applications this trajectory must be segmented into strokes corresponding to ink trace (pen-down strokes) and strokes corresponding to movement above the paper (penup strokes). The method developed to detect pen-up/down strokes as well as the design and prototyping of the interface are the main contributions of this paper.
2.1 Initialization and Preprocessing The detection and localization of the position of the pen tip in the first frame and the selection of the template to be used for
316
IEEE TRANSACTIONS ON PATTERN ANALYSIS AND MACHINE INTELLIGENCE,
VOL. 24,
NO. 3,
MARCH 2002
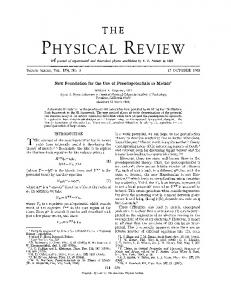
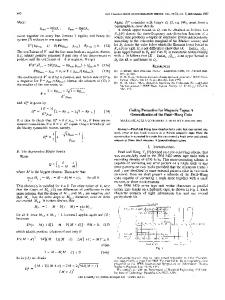
Fig. 2. Tracking Initialization. (a) Image provided to the user. The white rectangle is the initialization box. (b) The user has to place the pen tip inside the box so that the system can acquire the tracking template. Image differencing is used to detect when the pen tip gets inside the box. The figure shows the result of image differencing when the pen enters the tip acquisition area. (c) The boundaries of the pen tip are extracted using Canny's edge detector inside the initialization box. Only pixels with high contrast are selected. The dots display the boundary pixels and the cross indicates their centroid. Subpixel resolution in the location of edge elements is achieved by fitting a parabolic cylinder to the contrast surface in the neighborhood of each pixel. (d) Orientation of the boundary edge elements obtained with Canny's detector. (e) The different boundaries of the pen tip are obtained by clustering the orientation of the edge elements into the four quadrants and interpolating lines through the corresponding clustered pixels. (f) In the case in which only one of the boundaries is reliably detected, the other pen tip boundary is obtained by searching the image brightness profile along lines perpendicular to the detected boundary. Points of maximum contrast on these profiles define the missing boundary. The detection of the boundaries of the pen tip is performed on a sequence of frames in order to increase the robustness of the template extraction. The final centroid position is obtained as the mean of the location of the centroid in each individual frame. (g) The triangular model of the pen tip is completely specified with the location of the centroid of the tip, the orientation of the axis of the tip, and the positions of the finger and of the ballpoint. The pen tip axis is defined as the line passing through the centroid of the boundary pixels, whose orientation is the mean of the orientation of the boundary lines. (h) Image brightness profile across the estimated pen tip axis. The positions of the ballpoint and of the finger are extracted by performing a 1D edge detection on the profile. Subpixel accuracy is obtained by fitting a parabola to the edge detection result. (i) Final template of the pen tip automatically extracted by the interface.
detection in subsequent frames is the first problem to solve. There are two possible scenarios: 1) The user writes with a pen that is familiar to the system or 2) an unknown pen is used. The familiar-pen case is easy to handle: The system may use a previously stored template representing the pen tip and detect its position in the image by correlation. There are a number of methods to initialize the system when the pen is unknown. Our initialization method is a semiautomatic one that requires a small amount of user cooperation. It is based on a few reasonable assumptions:
We assume that the user is writing with a dark-colored pen on a light-colored piece of paper; we assume that the pen tip is conical in shape; and we assume that the edges between the pen tip and the paper have a larger contrast than the edge between the pen tip and the finger (see Fig. 2i). The first assumption restricts the pen to be used with the system to have a well defined contrast with the paper. Hence, transparent pen or pens without contrast could not be used. The restriction is not severe since pens come in all sort of colors and it is quite simple to get one that satisfy the
MUNICH AND PERONA: VISUAL INPUT FOR PEN-BASED COMPUTERS
317
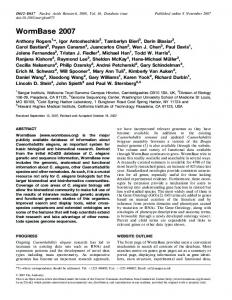
Fig. 3. Pen Tip Detector. The detection of the pen tip is obtained in our system by locating the maximum of the normalized correlation between the pen tip template and a subimage centered on the predicted position of the pen tip. The system analyzes the values of the maximum normalized correlation to detect whether the pen tip is within the predicted region of interest. If the value of maximum correlation is lower than a threshold, the system emits an audible signal and continues to look for the pen tip in the same place, waiting for the user to realize that tracking has been lost and that the pen tip must be returned to the region of interest. The system waits for a few frames; if the pen tip does not return to sight, then tracking stops.
requirement. The second assumption is true for most commercial pens. The third assumption restricts the paper to being lighter than human skin. The requirement is easily satisfied writing on a piece of common white paper. We display the image captured by the camera on the screen of the computer. A rectangular box is overlaid on this image, as shown in Fig. 2a. The user is required to place the pen tip inside the displayed box, ready to start writing. The system watches for activity within this box, which is measured by image differencing between frames. After the pen tip enters the box, the system waits until there is no more activity within the box, meaning that the user has taken a comfortable position to start writing. When the activity within the box has returned to low for a period of time (bigger than 200 ms), the system acquires the pen tip template, sends an audible signal to the user, and starts tracking. Fig. 2i shows the pen tip, whose conical shape projects onto the image plane as a triangle. One of the borders of this triangle corresponds to the edge between the pen tip and the user's finger and the two other boundaries correspond to the edges between the pen tip and the piece of paper. Detection and extraction of the pen tip template is reduced to finding the boundary points of the pen tip, computing the corresponding centroid, and selecting a portion of the image around the centroid. The edges between the pen tip and the paper have bigger contrast than the edge between the pen tip and the finger, thus, we only look for these two boundaries in the detection and extraction of the template. The boundaries of the pen tip are located using Canny's edge detector [3], as shown in Fig. 2c. Since detection and extraction of the pen tip from a single frame is not very reliable due to changes in illumination, the system collects information about the pen tip for a few frames before extracting the template. The algorithm is summarized in Fig. 2. The selection of the pen tip template is performed only at the beginning of the acquisition. The function of the initialization and preprocessing module in subsequent frames is only to extract a region of interest centered around the predicted position of the pen tip. The region of interest is
used by the following block of the system to detect the actual position of the centroid of the pen tip in the current image.
2.2 Pen Tip Detection The second module of the system has the task of detecting the position of the pen tip in the current frame of the sequence. The solution of this task is well-known in the optimal signal detection literature [8], [26]. Assuming that the signal to be detected is known exactly except for additive white noise, the optimal detector is a matched filter, i.e., a linear filter that looks like the signal to be detected. In our case, the signal consists of the pixels that represent the pen tip and the noise has two components: One component is due to noise in the acquisition of the images; the other one is due to shadows, due to pen markings on the paper, and due to changes in the apparent size and orientation of the pen tip during the sequence of images. The acquisition noise is the result of a combination of many factors, like changes in illumination due to light flickering or automatic gain of the camera, quantization noise, changes in gain of the frame grabber, etc., where not all these factors are additive. Changes in the apparent size and orientation of the pen while the user is writing significantly distorts the pen tip image, as shown in Fig. 3. Clearly, neither component of the noise strictly satisfies the additive white noise assumptions of the matched filter; however, as a first approximation, we will assume that the pen tip can be detected in each frame using the matched filter. In our system, the final localization of the pen tip is performed by fitting a triangle to the image of the tip as described in Section 2.5. 2.3 Filtering The filter predicts the most likely position of the pen tip on the following frame based on the current predicted position, velocity, and acceleration of the pen tip and on the location of the pen tip given by the pen tip detector. The prediction provided by the filter allows the interface to reduce the search area, saving computations while still keeping a good pen tip detection accuracy. The measurements are acquired faster and the measured trajectory is smoothed by the noise
318
IEEE TRANSACTIONS ON PATTERN ANALYSIS AND MACHINE INTELLIGENCE,
VOL. 24,
NO. 3,
MARCH 2002
TABLE 1 System Parameters
System parameters used in the real-time implementation.
rejection of the filter. A Kalman Filter [1], [9], [11] is a recursive estimation scheme that is suitable for this problem. We tested several different first- and second-order models for the movement of the pen tip on the image plane. The model that provided the best performance with the easiest tuning was a simple random walk model for the acceleration of the pen tip on the image plane. The model is given by (1): 8 x
k 1 x
k v
k 12 a
k > > < v
k 1 v
k a
k
1 a
k 1 a
k na
k > > : y
k x
k ny
k; where x
k, v
k, and a
k are the two-dimensional components of the position, velocity, and acceleration of the pen tip and na
k and ny
k are additive zero-mean, Gaussian, white noise processes. The output of the model y
k is the position of the pen tip corrupted by additive noise. The filter parameters used in the real-time implementation of the system are listed on Table 1.
2.4 Missing Frames The algorithm described in Section 2.2 detects the position of the pen tip in each frame of the sequence. Unfortunately, some intermediate frames could be missing due to problems in image acquisition or, in the case of the realtime implementation, due to synchronization problems between the host computer and the frame grabber. It is desirable to sample the handwritten trajectory at a constant rate; hence, there is a need for estimating the most likely position of the pen tip for the missing frames. The Kalman smoother [1], [9] is the scheme used in our system to solve this estimation problem (for more information, see [14]).
2.5 Ballpoint Detection The pen tip detector finds the most likely position of the centroid of the pen tip, a point that will be close to the center of gravity of the triangular model of the pen tip (see Section 2.1). The position of the ballpoint1 is obtained using an algorithm similar to the one used in the initialization; the major difference is that the pen is now in movement, so we need to compute one ballpoint position for each frame. Using Canny's edge detector, we find the position and orientation of the boundary edges of the pen tip. The edge detector is only applied to small windows in order to save computations and to speed up the processing of the current frame. We calculate the expected position of the boundaries using the orientations of the boundaries in the previous frame, the distance from the ballpoint and the finger to the centroid of the pen tip, as well as the current detected position of the centroid. A few points on these boundaries (in the case of the real-time system, we use five points) are chosen as the centers of the edge detection windows; we look for points in each window that have maximum contrast; the edges are found by interpolating lines through these points; the axis of the pen tip is computed as the mean line defined by the pen boundary edges; the image brightness profile through the axis of the tip is extracted in order to find the positions of the ballpoint and of the finger (see Fig. 4). 2.6 Pen Up Detection The trajectories obtained by tracking the ballpoint are not suitable for performing handwriting recognition using standard techniques. Most of the recognition systems to date assume that their input is only formed by pen-down strokes, i.e., portions of the trajectory where the pen was in contact 1. The term ballpoint is loosely used to indicate the actual ballpoint of pens and the pencil lead of pencils.
MUNICH AND PERONA: VISUAL INPUT FOR PEN-BASED COMPUTERS
319
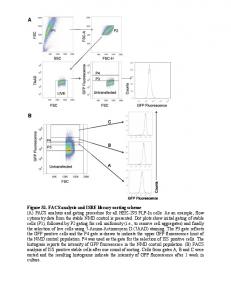
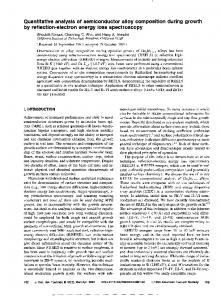
Fig. 4. Fine localization of the ballpoint. (a) Image of the pen tip displaying the elements used to detect the ballpoint. The cross ª+º in the center of the image shows the centroid of the pen tip provided by the pen tip detector. The points marked with a star ª*º show the places where the boundaries of the pen were found using edge detection. The lines on the sides of the pen tip are the boundary edges and the line in the middle is the pen tip axis. The other two crosses ª+º show the estimated positions of the ballpoint and of the finger. (b) Brightness profile along the axis of the pen tip. The positions of the ballpoint and of the finger are obtained by performing a 1D edge detection on the profile. This 1D edge detection is computed by correlating the profile with a derivative of a Gaussian function. The spatial resolution of the interface is defined by the accuracy on the localization of the ballpoint. The desired locations are extracted with subpixel resolution by fitting a parabola to the correlation peaks. (c) Result of correlating the image profile with a derivative of a Gaussian function. (d) Blow-up of the region between the dotted vertical lines in (c). The parabolic fit of the peak identifies the position of the ballpoint. The vertex of the parabola plotted with a cross ªxº corresponds to the estimated subpixel position of the ballpoint.
with the paper. Our interface has only one camera from which we cannot detect the 3D position of the ballpoint; therefore, contact has to be inferred indirectly. A stereo system would solve this problem at a cost in additional hardware, calibration, and visibility of the pen tip. The detection of the times when the pen is lifted and, therefore, not writing is accomplished in our system by using the additional information provided by the ink path on the paper. Given a particular position of the ballpoint, the system checks whether there is an ink trace on the paper at this place
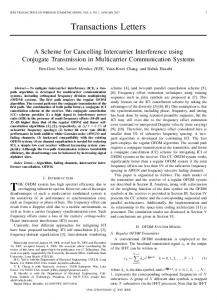
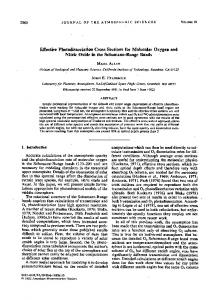
or not. The image brightness at any given place varies with illumination, writer's hand position, and camera gain. Moreover, the image contrast could change from frame to frame due to light flickering and shadows. Hence, the detection of the ink trace on the paper using image brightness is quite difficult, as illustrated by the example of Fig. 5. We can get several observations from the simple example of Fig. 5. The ink trace is narrow (1-2 pixels), so even a small error in locating the ballpoint could lead to a mismatch between the ballpoint and the ink trace. The handwritten
Fig. 5. Difficulties in detecting the ink trace. (a) The plot shows one sequence acquired with the interface. The dots indicate the ballpoint position over time. (b) The image displays a portion of the last frame of the sequence (we can see part of the pen tip on the right side of the image) showing the corresponding ink trace deposited on the paper. (c) Recovered ballpoint trajectory overlaid on the image of the ink trace. The sample points land over the ink trace most of the time with the exception of points at the beginning of the sequence (shown on the left side of the image). This happens because there might have been a displacement of the paper generated by one of the strokes (probably the long horizontal stroke between samples 20 and 40). (d) Each column of the picture shows the brightness profile of the image along lines that pass through each sample point and are perpendicular to the direction of motion. Brightness is measured at the position of the ballpoint and on five pixels on each side of the ballpoint along the mentioned perpendicular. We note that the ink trace is not always found at the ballpoint position (row 6 of the plot). We can see the ink trace being a few pixels off the ballpoint pixel at the beginning of the sequence (samples 1-20), then stabilizing on the ballpoint (samples 20-35) until the pen tip appears on the profile (samples 35-40) and later disappearing because of a pen up stroke (samples 40-55). From this example, we observe that we cannot rely on the ink trace captured in the last image of the sequence, but we should rather detect the presence of ink as the ballpoint trajectory is being acquired (see Sections 2.6.1-2.6.4).
320
IEEE TRANSACTIONS ON PATTERN ANALYSIS AND MACHINE INTELLIGENCE,
VOL. 24,
NO. 3,
MARCH 2002
to be done after the pen tip moves away; otherwise, the pen tip will obstruct the paper and the ink trace. Fig. 6 shows a block diagram of the pen-up/-down detection subsystem. The following sections describe in more detail each of the blocks presented in the figure.
Fig. 6. Pen up/down classification. Block diagram of the pen-up/-down classification subsystem. We detect when the pen is up or down using a bottom-up approach. The brightness of each point in the trajectory is compared with the brightness of the surrounding pixels. This comparison provides a measure of the confidence of ink absence. A Hidden Markov Model is used to model the transition of the confidence measure between the states of pen up and pen down. Using the local confidence measure and the estimated HMM state sequence, the system classifies each point of the trajectory as pen up or pen down. The measure of ink absence is difficult to obtain and prone to errors, so it is better to divide the trajectory of the ballpoint into strokes and aggregate the point-wise classification into a stroke-wise classification.
strokes are quite distorted due to the pixelization of the image, e.g., diagonal straight strokes present a staircase pattern. The value of brightness corresponding to the ink trace varies within the same image (and even more across images), so we need to detect the ink trace in a local and robust way. The local ink measurement should be performed as soon as possible since the paper might move in the course of the session. Working in this way, there would be a good fit of the sample points on top of the ink trace and the system would provide pen-up/-down information as the writing is produced, in an online fashion. However, the measurement has
2.6.1 Local Ink Detection The detection of the ink trace is performed locally for each point of the trajectory by comparing the brightness at the ballpoint with the brightness of surrounding pixels (see Fig. 7). A confidence measure of ink absence is obtained in a probabilistic setting. The brightness of inkless pixels is assumed to be a Gaussian-distributed random variable. The parameters of the corresponding Gaussian p.d.f. are estimated locally using the brightness of points located on a circle centered at the ballpoint. We assume that all these points correspond to inkless pixels. The ink absence confidence measure is computed as the probability of the brightness at the ballpoint pixel given that this pixel is inkless. If there is ink present at the ballpoint pixel, this measure is low, close to zero; otherwise, the measure is high, close to one. The selection of this particular confidence measure is very convenient since it provides automatic scaling between zero and one. The measurements of brightness cannot be obtained until the pen tip has left the measurement area; otherwise, the ink trace will be covered by the pen tip, by the hand of the user, or by both. The system assumes a simple cone-shaped model for the area of the image covered by the pen and the hand of the user. The ballpoint is located at the vertex of the cone, the axis of the pen tip defines the axis of the cone, the position of the finger has to be inside the cone, and the aperture of the cone is chosen to be 90 degrees. This simple model allows the system to determine if the user is left handed or right handed and whether a particular ballpoint position is within the cone. The system waits until the cone is sufficiently far away from the area of interest before doing any brightness measurements. Left-handed users are challenging since they usually cover with their hands the most recently written pen strokes; hence, the system has to wait much longer than for right-handed users in order to
Fig. 7. Local ink absence detection. (a) Typical pen-down sample point. The center cross corresponds to the estimated position of the ballpoint of the pen. The detection of ink is performed locally by comparing the brightness at the ballpoint with the brightness of the pixels located on a circle centered at the ballpoint position. The brightness at each point is obtained by interpolation [13]. (b) Histogram of the brightness values measured on the circle and corresponding Gaussian p.d.f. estimated from these values. The vertical line shows the value of brightness corresponding to the ballpoint's position. The ink absence confidence measure corresponds to the area below the Gaussian p.d.f. between 1 and the ballpoint's brightness. This confidence measure is equal to 0.075 for this example, indicating that ink is likely to be present.
MUNICH AND PERONA: VISUAL INPUT FOR PEN-BASED COMPUTERS
321
Fig. 8. Local model of pen up/down. Hidden Markov Model that models the transitions between pen-up and pen-down states. The observation of the model is the ink absence confidence measure, an intrinsically continuous variable as it was defined in Section 2.6.1. The HMM output is a set of discrete symbols, so we need to quantize the value of the confidence measure in order to define the output symbols. The confidence measure is a probability, so it is scaled between zero and one. The interval 0; 1 is divided into 16 equal intervals to quantize each confidence measure value and to translate it into observation symbols. The resulting HMM after training is shown in the figure. The bar plots display the output probability distributions of each state that are learned purely from the examples.
perform ink detection. We have acquired data from lefthanded users for the experiment of Section 3.3, but we haven't compared the accuracy of pen-up/-down detection for left- and right-handed users.
2.6.2 Local Pen-Up/-Down Modeling The ink absence confidence measure described in the previous section could be used to decide whether a particular sample point corresponds to pen up or pen down. However, making hard decisions based on a single measurement is likely to fail due to noise and errors in brightness measurements. A softdecision approach that estimates the probability of each individual point being a pen up or a pen down is more robust. A further improvement is provided by modeling the probability of transition between these two states (pen up or pen down), given the current measurement and the previous state. A Hidden Markov Model (HMM) with two states, one corresponding to pen up and the other corresponding to pen down, is a suitable scheme to estimate these probabilities. The HMM learns the probabilities of moving from one state to the other and the probabilities of rendering a particular value of confidence measure from a set of examples in an unsupervised fashion. The HMM used in our system has the topology presented in Fig. 8. We use the forward-backward algorithm [23] to train the HMM using a training set of handwritten sequences collected with the system. The training set consists of examples of cursive handwriting, block letters, numbers, drawings, signatures, and mathematical formulas in order to sample the variability of the pen up/down transition for different types of writing. The most likely state of the system at each point in the handwritten trajectory is estimated using Viterbi's algorithm [7], [23]. 2.6.3 Trajectory Segmentation The previous two sections describe local measures used to classify each sample of the handwritten trajectory as either pen up or pen down. The measurement of ink absence is subject to errors, so the performance may be improved by dividing the handwritten trajectory into different strokes and by aggregating the sample-wise classification into a strokewise classification.
The handwritten trajectory is segmented into strokes using two features, the curvilinear velocity of the pen tip and the curvature of the trajectory. Selection of these two features was inspired by the work of Viviani and Mc Collum [27], Viviani and Terzuolo [28], Plamondon and CleÂmente [20], and Plamondon and Maarse [21], and also by the intuitive idea that on the limit points between two different handwriting strokes the velocity of the pen is very small, the curvature of the trajectory is very high, or both. The set of segmentation points is the result of applying a threshold on each of the mentioned features. These thresholds were obtained experimentally and their values are presented on Table 1. Fig. 9 shows several examples of trajectories and the corresponding segmented strokes.
2.6.4 Stroke Classification Having divided the trajectory into strokes, we proceed to classify the strokes as either pen-up or pen-down. We experimented with two approaches, one based on the ink absence confidence measure and the other using the state sequence provided by the HMM. In the first approach, the mean of the ink absence confidence measures for all points in the stroke was used as the stroke confidence measure. In the second approach, a voting scheme was used to assess the likelihood of a particular stroke being a pen-up or pen-down, this likelihood provided the stroke confidence measure. If needed, hard classification of each stroke as pen up or pen down can be obtained by applying a threshold on the stroke confidence results. The hard classification, as well as the likelihood of pen up/down, are the stroke descriptors that our interface provides to a handwriting recognition system. 2.7 Stopping Acquisition We have mentioned that the system automatically stops if the value of maximum correlation is very low since this would imply that the pen tip has moved outside the search window (or that there was such a change in illumination that the pen tip no longer matches the template). The user can exploit this behavior to stop the acquisition by taking the pen tip away from the search window. There is another stopping possibility offered to the user. The system checks
322
IEEE TRANSACTIONS ON PATTERN ANALYSIS AND MACHINE INTELLIGENCE,
VOL. 24,
NO. 3,
MARCH 2002
Fig. 9. Trajectory segmentation. Several examples of trajectories acquired with the interface and the corresponding strokes obtained after segmentation. Successive strokes are indicated alternately with solid and dashed lines. The threshold in curvilinear velocity was chosen so that points that remain within the same pixel in two consecutive frames are discarded (see Table 1).
whether the pen tip has moved at all between consecutive frames and counts the number of consecutive frames in which there is no movement; if this number reaches a predefined threshold, the system stops the acquisition. Thus, if the user wants to finish the acquisition at the end of a desired piece of handwriting, he can hold the pen tip still and the system will stop the acquisition.
2.8 Real-Time Implementation The interface was implemented using a video camera, a frame grabber, and a Pentium II 230MHz PC. The camera was a commercial Flexcam ID, manufactured by Videolabs, equipped with manual gain control. It has a resolution of 480x640 pixels per interlaced image at 30Hz. The frame grabber was a PXC200 manufactured by Imagination. Fig. 10 shows the graphical user interface (GUI) of the windowsbased application that runs our system.
3
to be searched in order to find the pen tip. We acquired signature sequences by enlarging the search area and turning off the pen-up detection block of the system. In these experiments, we experienced a missing frame rate of at most 1 out of every 400 frames. We observe that the system occasionally loses track of the pen tip when the subject produces an extremely fast stroke. This problem of losing track of the pen tip could be solved in the future by using a more powerful CPU or dedicated hardware (that is able to process a larger search area). Nevertheless, after a few trials, the user learns how to utilize the system without exceeding its limits. The spatial resolution of the system was estimated in static and dynamic conditions. We acquired a few sequences in which the pen tip was held fixed at the same location, so any differences in the acquired points were due to noise on the image acquisition and errors in pen tip
EXPERIMENTAL RESULTS
3.1 System Specifications Temporal and spatial acquisition resolutions are key parameters that define the performance of the interface. The maximum working frequency provided by the camera is 60 Hz, so the temporal resolution of the system is at most 16.67 ms. The system is able to work at maximum frame rate since the total processing time per frame is 14ms. However, some frames are missed due to a lack of synchronization between the CPU and the frame grabber. A component of the system (see Section 2.4) estimates the most likely state of the system in the case of missing frames. This scheme is useful if the number of missing frames is small, otherwise, the system would drift according to the dynamics of the model of (1). We have used the system for acquiring hundreds of handwritten sequences in real time, experiencing a missing frame rate of at most 1 out of every 200 frames. We have shown in references [14], [16], [17] the performance of a signature verification system in which signatures are captured in real-time with our interface. Signatures are written at higher speeds than normal handwriting and, therefore, a bigger image neighborhood has
Fig. 10. Real-time application. This image shows the GUI (Graphical User Interface) of the windows-based application that implements our system. The biggest window is a Dialog Box that allows the user to input parameters and run commands. The top-left window displays the image captured by the camera in order to provide visual feedback to the user. The bottom-left window shows the acquired trajectory after having done point-wise pen up/down classification with a hard threshold.
MUNICH AND PERONA: VISUAL INPUT FOR PEN-BASED COMPUTERS
323
Fig. 11. Spatial resolution of the interface. The first figure corresponds to points acquired while the pen tip was kept still at a fixed position. This sequence is used to estimate the static resolution of the system. The second figure shows a straight line drawn with a ruler that is used to estimate the dynamic resolution of the system. The standard deviations of the error from the ideal position are given in the table as the estimated static and dynamic resolution of the system. One could take two standard deviations (roughly 0.1 pixels) to obtain a more conservative value of the spatial resolution.
localization. We repeated this experiment 10 times, placing the pen at different positions and using different illumination. The static resolution of the system was estimated by computing the average standard deviation of the points acquired in each of the sequences. We also acquired 10 sequences of a subject drawing lines of different orientations with the help of a ruler. The lines were carefully drawn to be straight, so any differences from a straight line would be due to noise in the image acquisition and errors in ballpoint localization. We fit a line through the acquired points and computed the distance between the points and the fitting line. The dynamic resolution of the system was estimated by computing the average standard deviation of the mentioned distance in each of the sequences. Fig. 11 shows two sequences used to compute the spatial resolution and summarizes the resolution of the system.
We note that the vertical resolution is almost the same for the two experiments, but the horizontal resolution varies by a factor of two from one experiment to the other. This difference is possibly due to the subject holding the pen mostly in a vertical writing position for the static resolution experiment. In any case, we observe that the system has quite a good resolution of less than one tenth of a pixel. Table 1 summarizes all the parameters used in the implementation of the real-time system. Fig. 12 shows several examples of complete handwritten sequences acquired in real time with our system. A few portions of one of the sequences are blown-up in order to depict the level of acquisition noise.
3.2 Pen Up Detection Experiments Only the pen tracking and the local ink detection components of the system have been implemented in the real-time application. In order to evaluate the performance of the complete pen-up detection subsystem, we collected
Fig. 12. Example sequences. The first row shows examples of sequences captured with the real-time system. We collected examples of cursive writing, block letters, printed letters, drawings, and mathematical symbols. The second row displays enlargements of portions of the sequence ªMaria Elena.º The dots represent the actual samples acquired with the interface. The sequences present a very low acquisition noise.
324
IEEE TRANSACTIONS ON PATTERN ANALYSIS AND MACHINE INTELLIGENCE,
TABLE 2 Point-Wise Classification Results
Comparison of the error rates of point-wise ink detection obtained using the ink absence confidence measure and the HMM model. The classification threshold used for the ink absence confidence measure is 0.4. We observe that none of the approaches is clearly better than the other. The HMM one has a lower FRR while the local measurements one has lower FAR. As we pointed out before, we have to wait until the pen tip is out of sight in order to measure brightness, so many pen-up points that correspond to a stroke that passes on top a segment of ink trace were misclassified as pen-down points. This is the main reason for the apparently large value of the FAR.
20 sequences comprising various types of handwriting (cursive, block letters, printed letters, numbers, drawings,
VOL. 24,
NO. 3,
MARCH 2002
signatures, and mathematical formulas). We used half of these sequences for training the HMM and the other half for testing. We obtained ground truth by classifying by hand each of the points of the test sequences as a pen up or pen down. We also classified by hand each of the strokes in which the test sequences were divided by the segmentation algorithm. Two types of error measurements were used to evaluate the performance of pen down detection: the false acceptance rate (FAR), which measured the percentage of pen-up points (segments) that were classified as pen down by the system, and the false rejection rate (FRR), which provided the percentage of pen-down points (segments) that were classified as pen up by our system. The examples of Figs. 1, 9, and 12 were used for training the HMM.
3.2.1 Point-Wise Classification Results All points in the test sequences were hard classified as either pen down or pen up in this experiment. Two
Fig. 13. Point-wise classification results. The first row shows three test sequences. The figures of the second row display each segment of the sequences with a thickness that is proportional to the average of the confidence of the endpoints. Most of the thicker segments corresponds to portions of the trajectory that should be classified as pen down. The third row shows only points of the trajectories that have been classified as pen down using the ink absence confidence measure. The fourth row presents only points that have been classified as pen down by the HMM. We see that there are several segments that appear in areas where there should be no ink trace on the paper. This misclassification is due to a bad measurement of the confidence of ink absence. From the plots of the third and fourth row, it seems that the HMM approach has lower FRR at the cost of a higher FAR.
MUNICH AND PERONA: VISUAL INPUT FOR PEN-BASED COMPUTERS
TABLE 3 Stroke Classification Results
Comparison of the error rates of stroke classification obtained using the ink absence confidence measure and the HMM model. For the first case, the average ink absence confidence measure was used as the classification parameter. The classification threshold was set to 0.2 (strokes with stroke confidence lower than the threshold were classified as pen down). For the second case, the percentage of points in the stroke classified as pen down by the HMM was used as the classification parameter. The classification threshold was also set to 0.2 in this case. We observe that the HMM has a much better FRR than the local measurements at the expense of a slightly worse FAR. We note that in most of the cases in which the stroke-up classification fails (reflected in the FAR), it is due to an incorrect segmentation, like the ªCº in the sequence ªPEDRO MUNICHº or the crossing stroke of the ªxº in the mathematical formula of Fig. 14. These incorrectly segmented strokes were always classified as pen down in the ground truth. Leaving out these segments in the computation of the performance, we obtained a reduction in the FAR for both methods of approximately 1 percent (absolute error) while the FRR is unchanged.
different approaches were compared: The first one used the value of the ink absence confidence measure as the classification parameter; the second approach used the HMM to classify each point. The hard classification was provided by the most likely HMM state sequence obtained with Viterbi's algorithm. Table 2 shows the resulting error rates. Fig. 13 presents the results of these two approaches on three test sequences.
3.2.2 Stroke Classification Results All test sequences were segmented into strokes and each stroke was classified as either pen down or pen up in this experiment. Two classification approaches were compared: the first one was based on the ink absence confidence measure; the second one was based on the HMM. In the first approach, the stroke confidence measure was computed as the average of the ink absence confidence measure of all points in the stroke. For the case of the HMM, the stroke confidence measure was calculated using a voting scheme. The ratio between the number of points classified as pen down by the HMM and the number of points in the stroke provided the stroke confidence measure. Table 3 shows the resulting error rates. Fig. 14 presents the results of stroke classification on three test sequences. 3.3 Signature Verification As mentioned before, the real-time interface was used as front-end for a signature verification system [14], [16], [17]. We acquired 25-30 true signatures and 10 forgeries from 105 subjects, adding to an approximate total of 4,000 signature samples. We collected data over the course of a few months in which subjects would provide signatures at different times during the day. The interface was placed next to a window, so natural sunlight was used for capturing signatures at day time, while electric lighting was used for acquiring signatures during the night. The subjects were asked to provide data in three different sessions in order to sample their signature variability. Given the number of subjects involved in the experiment, the position and orientation of the camera was different from
325
session to session and from subject to subject. Fig. 15 shows some examples of acquired signatures. We achieved a verification error rate of less than 1.5 percent for skilled forgeries and a verification error rate of less than 0.25 percent for random forgeries. These rates correspond to the condition of equal false acceptance rate and false rejection rate. These results and the techniques used for verification will be reported in a forthcoming paper.
3.4 Discussion The examples presented in Section 3 show that the interface is quite convenient and accurate for acquiring short handwritten trajectories. The system has not been tested for acquiring long sentences or even full pages of text. The main difficulty in this case would be perspective and radial distortion. This is not a problem for some applications, e.g., our signature verification algorithm which encodes handwriting in an affine-invariant parameterization. Perspective distortion of the image could be corrected easily if paper with a predefined pattern of symbols, e.g., a set of crosses located at a known distance from each other, was used; however, this would make the interface less convenient and general. Besides signature verification, informal tests by human observers found the output of the interface well within the resolution limits for easy reading and interpretation. However, the interface has not been tested for handwriting recognition. The results of the pen-down detection experiments are encouraging. The stroke confidence measure provides a soft classification of the pen-down and pen-up strokes that could be used in a handwriting recognizer. The usability of the interface has been tested by more than a hundred different subjects during the signature verification experiment. The acquisition of signatures took place under various lighting conditions and camera position, showing the robustness of the interface with respect to variability of the user's setup. Handwriting was captured at different scales with the interface. Changes of scale were introduced by the user when he adjusted the position and orientation of the camera to write more comfortably. These scale changes were small enough to be handled with a fixed set of system parameters. Larger scale changes would require adaptation of the system parameters to the acquisition setup. An appropriate procedure may be designed for the user to help the system in this task.
4
CONCLUSION
AND
FURTHER WORK
The design and implementation of a novel human-computer interface for handwriting was presented. A camera is focused on the user writing on a piece of paper with a normal pen. We have shown that the handwriting trajectory is successfully recovered from its spatio-temporal representation given by the sequence of images. This trajectory is composed by handwritten strokes and pen movements between two strokes. The temporal resolution is sufficient. The spatial resolution is approximately a tenth of a pixel, which allows capturing handwriting at sufficient spatial resolution within an area corresponding to half a sheet of letter paper using a cheap 480x640 pixels camera. The spatial resolution approximately corresponds to 20 samples per millimeter of writing, resolution that is five times lower than that of commercial tablets (100 lines per millimeter), but that is obtained with a much smaller and cheaper interface. The classification of
326
IEEE TRANSACTIONS ON PATTERN ANALYSIS AND MACHINE INTELLIGENCE,
VOL. 24,
NO. 3,
MARCH 2002
Fig. 14. Stroke classification results. The corresponding strokes for the sequences of Fig. 13 are shown on the first row. Successive strokes are plotted alternatively with solid or dashed lines. The figures of the second and third rows correspond to classification using the ink absence confidence measure; the figures of the fourth and fifth rows correspond to classification using HMM. The figures of the second and fourth row displays each stroke with a thickness that is proportional to the stroke confidence measure. The plots of the third and fifth rows show only the strokes classified as pen down in each case. The classification-based HMM seems to provide better results than the one based on the ink confidence measure.
pen-up and pen-down portions of the trajectory of the pen is obtained by using local measurements of the brightness of the image at the location in which the writing end of the pen was detected. Several modules of the interface are susceptible to improvement. We used only one pen tip template for the whole sequence acquisition. This template could be automatically updated once the peak value of correlation fell below a certain threshold. Since the information about the
boundaries and the axis of the pen tip, as well as the position of the ballpoint and the finger, are computed for each frame by the ballpoint detection module, the automatic extraction of a new pen tip template involves no extra computational cost. The region of interest used to detect the location of the pen tip has constant size in the current implementation of the system. The size of this region could be driven by the uncertainty on the predicted position of the pen tip, i.e., the size could depend on the covariance of the predicted
MUNICH AND PERONA: VISUAL INPUT FOR PEN-BASED COMPUTERS
327
Fig. 15. Signature verification. The first row of the figure shows examples of true signatures acquired with the interface. The second row presents examples of corresponding skilled forgeries also captured with our system.
location of the pen tip. Smaller regions would be required in cases of low uncertainty, reducing in this way the computational cost of performing correlation between the region of interest and the pen tip template. The ballpoint detection in the current frame of the sequence is based on the orientation of the axis and of the boundaries of the pen tip in the previous frame. We could improve the robustness of the ballpoint detection by modeling the change of axis and boundaries orientations from frame to frame. A recursive estimation scheme could be used to predict the desired orientations, allowing one to reduce the size of the windows used to perform edge detection and to decrease the number of computations. We used a Gaussian model for the brightness of inkless pixels. The estimation of the model parameters was performed using the brightness of points lying on a circle centered at the ballpoint position, assuming that all the circle points are inkless points. Clearly, this model is not strictly adequate for a random variable which takes values on the interval 0; 255 and the assumption is not completely valid since some circle points could correspond to the ink trace. This model could be improved by using a probability density function suitable for representing a random variable that takes values on a finite interval. However, as a first order approximation, we have shown that this model provides good results in pen-up/-down classification. The classification of strokes into pen-up strokes and pendown strokes is based on local measurements of brightness. A few other local measurements such as the local orientation of the ink at the position of the ballpoint, the correlation of this orientation with the local direction of the trajectory of the pen tip, etc., could be used in order to improve the classification rates. These local measurements of direction would decrease the FAR since a sample would be classified as ªpen downº only if an ink trace with the corresponding direction is found at the location of the sample. These additional local measures could be naturally included in the system by increasing the dimensionality of the observation of the HMM. The set of examples used to estimate the HMM parameters and to evaluate the pen-up/-down classification performance included examples of different types of writing provided by only one subject. More example sequences provided by different subjects should be acquired in order to estimate this performance in a writer-independent setting. Also, a bigger set of examples should be used to obtain a more accurate HMM for pen down detection.
ACKNOWLEDGMENTS The authors would like to acknowledge support from the US National Science Foundation Engineering Research Center on Neuromorphic Systems Engineering at Caltech (National Science Foundation (NSF) Cooperative Agreement No. EEC-9402726).
REFERENCES [1] [2] [3] [4] [5] [6]
[7] [8] [9] [10] [11] [12] [13] [14] [15] [16] [17] [18]
B.D. Anderson and J.B. Moore, Optimal Filtering. Prentice Hall, Inc., 1979. H. Bunke, T. Von Siebenhal, T. Yamasaki, and M. Schenkel, ªOn Line Handwriting Data Acquisition Using a Video Camera,º Proc. Int'l Conf. Document Analysis and Recognition, pp. 573-576, 1999. J. Canny, ªA Computational Approach to Edge Detection,º IEEE Trans. Pattern Analysis and Machine Intelligence, vol. 8, pp. 679-698, 1986. J.L. Crowley, ªVision for Man-Machine Interaction,º Robotics and Autonomous Systems, vol. 19, nos. 3-4, pp. 347-358, 1997. J.L. Crowley, F. Bernard, and J. Coutaz, ªFinger Tracking as an Input Device for Augmented Reality,º Proc. Int'l Workshop Face and Gesture Recognition, pp. 195-200, 1995. S. Elrod, R. Bruce, R. Gold, D. Goldberg, F. Halasz, W. Janssen, D. Lee, K. McCall, E. Pedersen, K. Pier, J. Tang, and B. Welch, ªLiveboard: A Large Interactive Display Supporting Group Meetings, Presentations and Remote Collaboration,º Proc. ACM CHI '92, pp. 599-607, 1992. G.D. Forney, ªThe Viterbi Algorithm,º Proc. IEEE, vol. 61, no. 3, pp. 268-278, 1973. K. Fukunaga, Statistical Pattern Recognition. Academic Press, 1990. A. Gelb, Applied Optimal Estimation. The MIT Press, 1974. S. Impedovo, L. Ottaviano, and S. Occhinegro, ªOptical Character RecognitionÐA Survey,º Int'l J. Pattern Recognition and Artificial Intelligence, vol. 5, pp. 1-24, 1991. R.E. Kalman, ªA New Approach to Linear Filtering and Prediction Problems,º Trans. ASME J. Basic Eng., pp. 35-45, 1960. G. Lorette and R. Plamondon, ªDynamic Approaches to Handwritten Signature Verification,º Computer Processing of Handwriting, pp. 21-47, 1990. B.D. Lucas and T. Kanade, ªAn Iterative Image Registration Technique with an Application to Stereo Vision,º Proc. Seventh Int'l Joint Conf. Artificial Intelligence, 1981. M.E. Munich, ªVisual Input for Pen-based Computers,º PhD thesis, California Inst. of Technology, Pasadena, Jan. 2000. M.E. Munich and P. Perona, ªVisual Input for Pen-Based Computers,º Proc. 13th Int'l Conf. Pattern Recognition, 1996. M.E. Munich and P. Perona, ªCamera-Based ID Verification by Signature Tracking,º Proc. Fifth European Conf. Computer Vision, H. Burkhardt and B. Neumann, eds., pp. 782-796, 1998. M.E. Munich and P. Perona, ªVisual Signature Verification Using Affine Arc-Length,º Proc. IEEE CS Conf. Computer Vision and Pattern Recognition, pp. 180-186, 1999. S. Nabeshima, S. Yamamoto, K. Agusa, and T. Taguchi, ªMemoPen: A New Input Device,º Proc. Int'l Conf. Human Factors in Computing Systems (CHI), pp. 256-257, 1995.
328
IEEE TRANSACTIONS ON PATTERN ANALYSIS AND MACHINE INTELLIGENCE,
[19] M. Nakagawa, T. Oguni, T. Yoshino, K. Horiba, and S. Sawada, ªInteractive Dynamic Whiteboard for Educational Applications,º Proc. Int'l Conf. Virtual Systems and Multimedia, pp. 479-484, 1996. [20] R. Plamondon and B. CleÂment, ªDependence of Peripheral and Central Parameters Describing Handwriting Generation on Movement Direction,º Human Movement Science, vol. 10, pp. 193-221, 1991. [21] R. Plamondon and F.J. Maarse, ªAn Evaluation of Motor Models of Handwriting,º IEEE Trans. Systems, Man, and Cybernetics, vol. 19, no. 5, pp. 1060-1072, 1989. [22] R. Plamondon and S. Srihari, ªOn-Line and Off-Line Handwriting Recognition: A Comprehensive Survey,º IEEE Trans. Pattern Analysis and Machine Intelligence, pp. 63-84, 2000. [23] L. Rabiner and B. Juang, Fundamentals of Speech Recognition. Prentice Hall, Inc., 1993. [24] B. Simard, B. Prasad, and M.K. Sinha, ªOn-Line Character Recognition Using Handwriting Modelling,º Pattern Recognition, vol. 26, no. 7, pp. 993-1007, 1993. [25] C.C. Tappert, C.Y. Suen, and T. Wakahara, ªThe State of the Art in On-Line Handwriting Recognition,º IEEE Trans. Pattern Analysis and Machine Intelligence, vol. 12, pp. 787-808, 1990. [26] H.L. Van Trees, Detection, Estimation and Modulation Theory: Part I. John Wiley and Sons, 1968. [27] P. Viviani and G. McCollum, ªThe Relation between Linear Extent and Velocity in Drawings Movements,º Neuroscience, vol. 10, no. 1, pp. 211-218, 1983. [28] P. Viviani and C. Terzuolo, ªTrajectory Determines Movement Dynamics,º Neuroscience, vol. 7, no. 2, pp. 431-437, 1982. [29] J. Vredenbregt and W.G. Koster, ªAnalysis and Synthesis of Handwriting,º Philips Techical Rev. vol. 32, no. 3/4, pp. 73-78, 1971. [30] P.D. Wellner, ªAdaptative Thresholding for the Digitaldesk,º Technical Report EPC-1993-110, 1993. [31] P.D. Wellner, ªSelf Calibration for Digitaldesk,º Technical Report EPC-1993-109, 1993. [32] T. Yamasaki and T. Hattori, ªA New Data Tablet System for Handwriting Characters and Drawing Based on Image Processing,º Proc. IEEE Int'l Conf. Systems, Man and Cybernetics, pp. 428431, 1996.
VOL. 24,
NO. 3,
MARCH 2002
Mario E. Munich received the degree of electronic engineer (with honors) from the National University of Rosario, Argentina, in 1990, and the MS and the PhD degrees in electrical engineering from the California Institute of Technology, Pasadena, in 1994 and 2000, respectively. He is currently a research scientist at Vocalpoint Technologies, San Francisco, California. His research interests include machine vision, handwriting and speech recognition, human-computer interfaces, pattern recognition, and machine learning. He is a member of the IEEE and the IEEE Computer Society. Pietro Perona received the DEng degree in electrical engineering from the University of Padova, Italy, in 1985 and the PhD degree in electrical engineering from the University of California, Berkeley, in 1990. He is currently a professor of electrical engineering and computation and neural systems, as well as the director of the NSF/ERC Center for Neuromorphic Systems Engineering at the California Institute of Technology (Caltech), Pasadena. He is also an adjunct professor with the University of Padova, Italy. His research interests include both human and machine vision. His current activity is focused on visual object recognition using vision as a human-machine interface and the perception of 3D shape perception. He has also worked on the use of diffusive PDE's for image processing (anisotropic diffusion) and filtering techniques for early vision and modeling of human vision. He is a member of the IEEE Computer Society.
. For more information on this or any other computing topic, please visit our Digital Library at http://computer.org/publications/dlib.