Page 1 .... Figure 1: Major processing stages in the depth-from-occlusion model.
..... in visual perception, in Neural Networks for Perception, vol. 1, H. Wechsler ...
)
AD-A249 035
l
lC
PROGRESS REPORT For the Period Ending January 1, 1992 VISUAL PERCEPTION OF DEPTH-FROM-OCCLUSION: A NEURAL NETWOR MODEL Contract Dp P.!.
# N00014-90-J-1864 -
Leif H. Finkel
Department of Bioengineering and Institute of Neurological Sciences University of Pennsylvania 220 South 33rd Street Philadelphia, PA 19104
bI
APR 0 11992 S
During this period, we have made substantial progress in understanding how objects are discriminated by the visual system. A number of papers describing our results are enclosed. Major goals of the project have been accomplished in several areas: 5
Completion of the beta release version of a novel neural network simulator, NEXUS
)
Development of a parallel version of the NEXUS simulator which allows anatomically interconnected networks to be simultaneously simulated on different workstations linked by ethernet connections'
3
Continuing research using our model of how the visual system extracts depth-from-occlusion. Considerable progress with regard to how surfaces may be represented. Numerous simulations of resp,,..ses to both real and illusory objectsj
A N-)
4
Development of related cortically-based models of color visual processing and texture discrimination. Color and texture are used to detect contours in images, and these contours can then be used by our depth-from-occlusion model to determine the relative depth of the colored or textured surfaces. The N XUS Neural Simulator
We have now completed the beta release version of the NEXUS simulator. NEXUS is an interactive simulator which allows the user to construct large-scale (10 neurons, 106 connections) neural networks. The simulator supports both biologically-based and artificial network architectures. In addition, NEXUS allows the user to create hybrid neural systems in which different types of networks are interconnected. Thus, for example, one can create a biologically-based early vision system which feeds into a PDP object recognition network. NEXUS is currently being tested in several research laboratories at Penn. We are also testing it as a tool in a graduate course in Computational Neuroscience (enrollment of 38 students). The students use NEXUS to carry out eight simulations. The simulations include, for example, a PDP model of classifying tree leaves as to their species (oak, maple, beech, etc.), a model for the formation of ocular dominance columns, and analysis of the Adelson-Bergen Energy models of motion detection and texture discrimination. This summer, we will use NEXUS to run a shortcourse on neural simulation at the McDonnell Summer Institute for Cognitive Neuroscience at Dartmouth. After these tests of the simulator are complete we plan to make NEXUS available to all interested users. We have also completed a preliminary version of pNEXUS-a parallel version of NEXUS which allows interconnected networks to be simulated on different machines linked by ethernet connections. The program allows NEXUS to be simultaneously run on a number of workstations, with
. . .. . .. ...... ............... 932~ i' 2
I
018
92 327 018
FCT
9 - 7 2
Il92-07825
IRIIIIlIIII'(
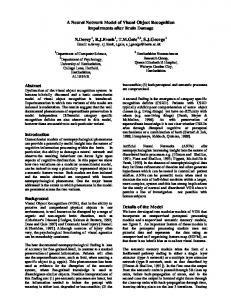
different networks defined on each machine. Information is shared between networks by means of common access to stored files. In this way, very large multi-network models can be simulated. For example, a model of visual cortical function might include several interconnected models of shape, color, motion, and depth processing, each of which runs on a separate workstation. pNEXUS allows communication and integration between these modules. Model of Depth-from-Occlusion Our model of depth-from-occlusion addresses the problem of how the visual system can discriminate objects in a complex scene. There are two fundamental problems at the core of object discrimination: binding and segmentation. The binding problem addresses how the attributes of an object-shape, color, motion, depth-are linked to create an individ,!al object. It can also be applied to how the parts of an object are linked or bound together (e.g. why the horse's tail is perceived as part of the horse). Segmentation deals with the converse problem of how attributes of separate objects are distinguished. The process of determining depth-fromocclusion is a paradigmatic example of how the visual cortex may carry out the binding and segmentation processes. Namely, when two surfaces overlap, there is an ambiguity as to which of the surfaces "owns" the common border. Consider, for example, a tree branch crossing in front of our view of the moon. Since the tree branch is, in fact, in front of the moon, the common border belongs to the branch. However, if the "half-moons" were actually two separate objects, then the common border would belong to them as well. The determination of which surface "owns" the border determines the occlusion relationship. The extraction of depth-from-occlusion thus provides a simple but powerful paradigm for studying how objects are defined, discriminated, stratified, and linked. Our present simulations consist of 10 interconnected networks, each of which contains one or more topographically organized arrays of 64x64 units (the system contains a total of 1.7x10 5 units). This total includes both conventional neuronal units, and a new type of network unit called PGN (programmable generalized neural) units which execute arbitrary functions or algorithms. A single PGN unit can emulate the function of a small circuit or assembly of standard units. PGN units are particularly useful in situations in which an intensive computation is being performed but the anatomical and physiological details of the how the operation is performed in vivo are unknown. Alternatively, PGN units can be used to carry out functions in a computationally efficient manner; for example, to implement a one-step winner-take-all algorithm. Figure 1 shows the major processes carried out by the network system. Early visual processing involves networks specialized for detecting edges, orientation, endstopping, curvature, and junctions. All of these processes, and all of the processes discussed below, are carried out using either known or plausible neural architectures. After contour extraction, more global properties are determined, including the determination of closure and the discrimination of the inside-vs.outside of a contour. For example, figure 2 illustrates the neural mechanism used to determine the inside-vs.-outside of a contour. Orientation-tuned cells determine the local orientation of a contour. These orientation cells inhibit their nearest neighbors, except for cells located roughly perpendicular to the local orientation of the contour (see figure 2). Units extend dendrites in a stellate pattern, i.e., in all directions, and these dendrites are activated when they intersect the contour. An important aspect of the mechanism is that each unit responding to the contour is bound with other such units by means of a local tag. This tag could be implemented in vivo by phase-locked firing of units[3], but the mechanism does not depend upon the biophysical implementation of the tag. The tag serves the following function: if the stellate dendrites intersect other contours in the scene (i.e., those with tags which differ from the tag detected by the neighboring orientation-tuned unit), these inputs do not activate the unit. The function of the circuit can then be intuitively understood as follows. If a unit is inside the contour, all of its dendrites
Statement A per telecon Dr. Harold Hawkins ONR/Code 1142 Arlington, VA 22217-5000 NWW 3/31/92
. vati'alor
...
Dis
L_
i
Discmalte Edges, U
Oriented"n and Terming;s
n
prlelpmm Continuity and Closure and Dynamically Bind Contour
Determine o irection
iDermine Dircton hof
f
id
i
pathways.
CurvatureF
(Possible Occlusion Boundaes I
Deamine Relative Depth of
Unk Occluding Contours I l
UnkOccluded Contours t
Obt Using Distributed Representation in FOREGROUND and BACKGROUND Maps
Figure 1: Major processing stages in the depth-from-occlusion model. Each process is carried out by one or more networks. Following early visual stages, information flows through two largely parallel pathways-one concerned with identifying and linking occlusion boundaries (left side) and another concerned with stratifying objects in depth (right side). Networks are multiply interconnected and there are two major feedback pathways.
3
conur bndg
drelction of figur
Figure 2: Neural circuit for determining direction of figure (inside vs. outside). Hypothetical input stimulus consists of two closed contours (bold curves). The central unit of 3x3 array (shown below) determines the local orientation of the contour. Surrounding units represent possible directions (indicated by arrows) of the inside of the figure relative to the contour. All surrounding units are inhibited (black circles) except for the two units located perpendicular to local orientation of the contour. Units receive inputs from the contour binding map via dendrites that spread out in a stellate configuration, as indicated by clustered arrows (dendrites extend over long distances in map). Units inside the figure will receive more inputs than those located outside the figure. The two uninhibited units compete using a winner-take-all architecture. Note that inputs from separate objects are not confused due to the tags generated in the contour binding map. will intersect the contour; if the unit is outside, then only some of its dendrites will intersect the contour. A simple "winner-take-all" circuit can then pick the unit which is on the inside. Using this mechanism, we can determine which side of the contour is the inside in one cycle of iteration (we use PGN cells to implement a one-step winner-take-all). Note that the problem of inside/outside has traditionally been considered a difficult computational process, one requiring global information about the curve; yet using neural architectures, we have found a mechanism for determining the solution in one cycle of network operation. We have similarly used a number of other simple mechanisms, based on known or plausible neural architectures to carry out all of the visual processes required by the model. The neural mechanisms include: " feedback connections from higher to lower cortical areas which serve to integrate visual perception " a distributed representation of relative depth * a new role for phase-locked cortical firing * a neural mechanism for detecting T-junctions and for shuffling objects in relative depth 4
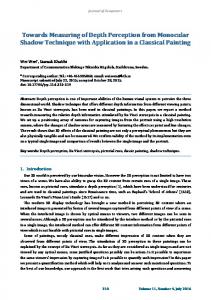
9 neural mechanism for linking objects across occlusion barriers Details of network construction and extensive results are presented in the enclosed papers. We briefly summarize some of the major results below. Figure 3 shows a typical visual scene presented to the system. The early networks discriminate the edges, lines, terminations, and junctions present. Figure 3A displays how contours are bound in a visual scene. On the first cycle of activity, discontinuous segments of contours are bound separately. These contours are later bound together as a result of feedback from the linking processes. Figure 3B shows the determination of inside-vs.-outside (we call this the "direction of figure") for a portion of the scene. The direction of the arrows indicates the direction of the "inside" as determined by the network. The presence of T-junctions (e.g., between the horse and the fence) are used by the system to force various objects into different depth planes. Results of this process are displayed in figure 3C which plots the firing rate of units in the foreground network-this indicates the relative depth of the objects. The system has successfully stratified the fence, horse, house and sun. Figure 4 shows a stimulus, adapted from Kanizsa [4], in which there are two possible perceptual interpretations (middle panels)-on the left, the two figures respect local continuity (this is the dominant human perception); on the right, the figures respect global symmetry. Figure 4A shows the contour binding tags, and figure 4B shows the direction of figure determined by the system. Both results indicate that the network makes the same perceptual interpretation as a human observer. As this example illustrates, the model obeys several of the classical Gestalt laws of perceptual organization. The results of figure 4 correspond to the law of "good continuation" [6], but other simulations have demonstrated effects consistent with the general notion of Priignanz. It is thus possible that the Gestalt laws arise from intrinsic neural constraints, for example, the anatomic connection patterns in striate and extrastriate cortex. In our simulations, we used implicit connectivity patterns based on the anatomical data of Rockland and Lund (9]. These connection schemes were directly responsible for generating proximity and good continuation effects. The final simulation is, again, adapted from Kanizsa [4], and shows a perceptually vivid, illusory white square in a field of black discs. The illusory square appears closer than the background, and the four black discs inside its borders appear even closer than the square. This is an example of what we call "occlusion capture", an effect related to Ramachandran's capture phenomenon. In this case, the illusory square has "captured" the discs within its borders and pulled them into the foreground. Figure 5A shows the contour binding tags after one (left) and three (right) cycles of activity. Initially, each disc is bound separately. After several cycles, responses to the illusory square are generated and the square is given a common tag. Note that the edges of the discs occluded by the illusory square are now bound with the square, not with the discs. This change in "ownership" of the edges is the critical step in discriminating the illusory square as an object. For example, Figure 5B shows determination of the direction of figure after one and three cycles of activity. The change in which surface "owns" the edge is reflected by a change in the direction of "inside". Figure 5C displays the firing rate of units in the foreground network (as in 30), thus showing the relative depths discriminated by the system. The discs are placed in the background, the illusory square at an intermediate depth, and the discs located within the borders of the illusory square are located closest to the viewer. In this case, the depth cue which forces the internal discs to the foreground is not due to T-junctions, but rather to another network mechanism we call "surround occlusion". Thus the system demonstrates occlusion capture corresponding to human perceptions of this stimulus.
5
IDDDD I
__WMD
EI --]rF-]-71 FIF r-I I EDIDDI DDZIILIZ 9-Pl-II-IIE1-1-1II -1 A
-f
N
B
C
Figure 3: Object discrimination and stratification in depth. Top panel shows a 64 x 64 input stimulus presented to the system. A Spatial histogram of the contour binding tags (each box shows units with common tag, different boxes represent different tags, and the order of the boxes is arbitrary). Initial tags shown on left; tags after five iterations shown on right. Note that objects have been linked across occlusions. B Magnified view of a local section of the direction of figure network corresponding to portion of the image near horse's nose and crossing fence posts. Arrows indicate direction of inside of figure as determined by network. C Relative depth of objects in scene as determined by the system. Plot of activity (% of maximum) of units in the foreground network after 5 iterations. Points with higher activity are "perceived" as being relatively closer to the viewer. 6
0
C
*
A
............. ' -
l S
*IH
Q
t tItI
B
Figure 4: Segmentation of ambiguous figures. Upper panel shows an ambiguous stimulus, adapted from Kanizsa [4], two possible perceptual interpretations of which are shown below. The interpretation on the left is dominant for humans, despite the figural symmetry of the segmentation on the right. Stimulus was presented to the system, results shown after three iterations. A Spatial histogram showing the contour binding patterns (as in fig. 3A). The network segments the figures in the same manner as human perception. B Determination of direction of figure confirms network interpretation (note at junction points, direction of figure is indeterminate).
7
WR
I1-IW--WEull. I -"l -I IEI:F 1 rI ll[-l A
D: 0 0, 0:0
I'-,
" - ,,,,
I
I
B
I.'""' B )
C
, ,,
C
Figure 5: Occlusion capture. Upper panel shows stimulus (adapted from Kanizsa [4]) in which we perceive a white illusory square. Note that the four black discs inside the illusory square appear closer than the background. A 64 x 64 discrete version of stimulus wa- presented to the network. A Spatial histogram (as in fig. 2A) of the initial and final (after 3 iterations) contour binding tags. Note that the illusory square is bound as an object. B Direction of figure determined by the system. Insets show a magnified view of the initial (left) and final (right) direction of figure (region of magnification is indicated). Note that the direction of figure of the "mouth" of the pac-man flips once the illusory contour is generated. C Activity in the foreground network (% of maximum) demonstrates network stratification of objects in relative depth. The illusory square has "captured" the background texture. 8
There are a number of points of agreement between our model of depth-from-occlusion and recent theories of visual perception by Nakayama [8] and Kellman and Shipley [5]. In fact, we provide neural mechanisms which, when simulated, display many of the psychophysical effects described by these authors. Our model differs from previous neural models in that it discriminates objects-not just contours. The difference is critical: a network which generates responses to the three sides of the Kanizsa triangle, for example, is not representing a triangle (the object) per se. To represent the triangle it is necessary to link these three contours into a single object boundary, to represent the surface of the triangle (including surface properties such as depth, color, texture, etc.), and finally to bind all these attributes into a whole. The proposed model demonstrates that one can build a self-contained system for discriminating objects based on occlusion relationships. The model is successful at stratifying simple visual scenes, for linking the representations of occluded objects, and at generating responses to illusory objects in a manner consistent with human perceptual responses. The model uses neural circuits that are biologically-based, and conforms to general neural principles, such as the use of a distributed representation for depth. The system can be tested in psychophysical paradigms and the results compared to human and animal results. In this manner, a computational model which is designed based on physiological data and tested with psychophysical data offers a powerful paradigm for bridging the gap between neuroscience and perception. Extraction of Texture and Color Boundaries In real images, there are multiple cues to object boundaries beyond the simple luminance gradients considered above. Two of the most useful such cues are discontinuities in color and texture. Color and texture also serve as prime examples of "surface" properties which must be bound to an object. Proceeding towards our goal of discriminating complex objects in real images, we have begun to develop neural models of both color and texture discrimination. The color model is based on the anatomy and physiology of the color pathway from the retina to area V4. It primarily addresses the problem of color constancy and color contrast.' Recent results of Desimone and Schein [10] recording in macaque visual cortex have implicated the large "silent" surrounds of V4 neurons in this process. We have shown that such a mechanism can qualitatively account for a number of psychophysical resports in the literature [2] [11]. However, we have found it necessary to propose that V4 uses both positive an negative contrast signals in each color channel in addition to opponent-channel responses (provided by type II cells in area Vi). The contrast signals reflect the difference between the center and (large) surround as calculated by V4 cells. (Negative contrast includes those cases when surround activity exceeds activity in the center of the receptive field). We use a simple neural circuit in which the two "contrast" signals modulate the response of the direct feedfoward "opponent" signal. We can then account for a wide range of both color and luminance contrast and constancy effects. We are currently refining and testing the ability of the model to quantitatively account for human psychophysical results. We have also recently begun to test several models of texture discrimination. We have used NEXUS to reproduce recent models proposed by Adelson and Bergen [1] and by Malik and Peronna [7]. We have successfully used the outputs of these models (i.e., the locations of discriminated texture boundaries) as inputs to our depth-from-occlusion model. In this case, the textured regions are discriminated, the surfaces are linked to the boundaries, and the textured IColor constancy refers to the fact that the perceived color of an object remains relatively invariant as the wavelength of the incident light ischanged, i.e., an orange looks "orange" under sunlight, fluorescent light, incandescent light, etc. despite the fact that the amount of low and middle wavelength light reflected from the orange differs greatly in the different cases. Color contrast is the related effect in which the perceptual appearance of a colored object changes when it is viewed against differently colored backgrounds, i.e., an orange looks more red on a yellow background than on a grey background. 9
surfaces are ordered in depth depending upon cues to occlusion. In the same manner, boundaries discriminated by other early vision systems could by fed into the occlusion model and used to bind surfaces and order them in depth. It is important to note, however, that color and texture are probably processed by separate systems from those concerned with occlusion. This implicit difference (which may be relegated to the magnoceliular and parvocellular divisions of the visual projection) is reflected in the parallel pathways of the depth-from-occlusion model (see figure 1). Conclusions We have made substantial progress in a number of areas-the NEXUS simulator, development of a theoretical model of occlusion that integrates anatomical, physiological and psychophysical data, testing of the model through extensive computer simulations on teal and illusory stimuli, and the development of related models in color and texture discrimination. We plan to vigorously pursue these findings and to consider a number of additional topics. For example, we are currently testing the ability of the model to account for the perceptual vividness of different illusory contour configurations, the ability to account for the perception of transparency, and extending the model to handle motion-related occlusion information as occurs in the accretion and deletion of texture near a moving occlusion boundary. We are beginning to run preliminary tests of the pNEXUS program in which several different cortical areas are simultaneously simulated, and interconnections between the areas mediate integration of function in parallel. Finally, we are attempting to set up a facility for analyzing real video images so as to test the model on a more complex set of stimuli. Enclosures Papers: . L.H. Finkel and P. Sajda (1992) Object Discrimination based on Depth-from-Occlusion, Neural Computation [in press] 2. P. Sajda and L.H. Finkel (1992) NEXUS: A simulation environment for large-scale neural systems. Simulation [in press] 3. P. Sajda and L.H. Finkel (1992) A neural network model of object segmentation and feature bindiug in visual cortex. Proceedings of the Int. Joint Conf. on Neural Networks, (submitted] 4. K. Sakai, P. Sajda, and L.H. Finkel (1992) Texture discrimination and binding by a modified energy model, Proceedings Int. Joint Conf. Neural Networks [submitted] 5. '-.M. Courtney, G. Buchsbaum, and L.H. Finkel (1992) Biologically-based neural network model of color constancy and color contrast, Proceedings Int. Joint Conf. Neural Networks (submitted] 6. L.H. Finkel (1991) Neural Networks, in Encyclopedia of Human Biology, vol. 5, 387-392. 7. L.H. Finkel, G.N. Reeke, and G.M. Edelman (1992) A cortically based model for integration in visual perception, in Neural Networks for Perception,vol. 1, H. Wechsler, ed., pp. 41-63, Academic Press, Boston. 8. L.H. Finkel and G.M. Edelman (1991) Models of somatotopic map organization, in Lectures in Complex Systems, vol. III, L. Nadel and D. Stein, eds., pp. 269-284, Addison-Wesley, Redwood City, Ca. 10
*
Abstracts: 1. P. Sajda anu L.H. Finkel (1992) Extraction of depth-from-occlusion by a physiologically based network, ARVO Proceedings[in press] 2. S. ".. Courtney, G. Buchsbaum, and L.H. Finkel (1992) Color constancy and color contrast in a physiologically-based network model, ARVO Proceedings [in press] Technical Reports: 1. P. Sajda, K. Sakai, and L.H. Finkel (1992) NEXUS User Manual, beta release-version 0.8, University of Pennsylvania Technical Report
References [11 J. Bergen and E. Adelson. Early vision and texture perception. Nature, 333:33-364, 1988. [2] K.T. Blackwell and G. Buchsbaum. Quantitative studies of color constancy. J. Optical Soc. America, 5:1772-1780, 1988. [3] C. M. Gray and W. Singer. Neuronal oscillations in orientation columns of cat visual cortex. Proceedings of the National Academy of Science USA, 86:1698-1702, 1989. [4] G. Kanizsa. Organizationin Vision. Praeger, New York, 1979. [5] P.J. Kellman and T.F. Shipley. A theory of visual interpolation in object perception. Cognitive Psychology, 23:141-221, 1991.
[61 K. Koffka. Principlesof Gestalt Psychology. Harcourt, Brace, New York, 1979. [7] J. Malik and P. Petrona. Preattentive texture discrimination with early vision mechanisms. J. Optical Soc. America, 7:923-932, 1990. (8] K. Nakayama and S. Shimojo. Toward a neural understanding of visual surface representation. Cold Spring HarborSymp. Quant. Biol., LV:911-924, 1990. [9] K. S. Rockland and J. S. Lund. Widespread periodic intrinsic connections in the tree shrew visual cortex. Science, 215:1532-1534, 1982. [10] S.J. Schein and R. Desimone. Spectral properties of V4 neurons in the macaque. J. Neuroscience, 10:3370-3389, 1990. [11] J. Walraven. Discounting the background: the missing link in the explanation of chromatic induction. Vision Research, 16:289-295, 1976.
11