Visualisation of the Semantic Web: Topic Maps Visualisation Bénédicte Le Grand, Michel Soto, Laboratoire d'Informatique de Paris 6, France
[email protected];
[email protected] Abstract Topic Maps provide a bridge between the domains of knowledge representation and information management by building a structured semantic network above information resources. Our research at LIP6 aims at visualizing this semantic layer efficiently, which is a critical issue as Topic Maps may contain millions of elements. This paper is divided into two parts. First, we depict briefly basic Topic Maps concepts. Then, we discuss Topic Maps visualisation requirements and we study how existing visualisation techniques may be applied to Topic Maps representation. We conclude by giving a few directions that could lead to the "ultimate" Topic Map visualisation tool.
1. Introduction The standards developed in the context of the Semantic Web provide means of adding semantics to the data available on the Web. XML is a first level of semantics which allows users to structure data with regard to their content rather than their presentation. However, more semantics can be added with the Resource Description Framework (RDF) or Topic Maps standards. RDF was developed by the World Wide Web Consortium [14] whereas Topic Maps were defined by the International Organisation for Standardization [4]. The Topic Map paradigm was recently adapted to the Web by the TopicMaps.Org consortium [13]. Both RDF and Topic Maps aim at representing knowledge about information resources by annotating them; these standards are compatible. Topic Maps provide a bridge between the domains of knowledge representation and information management. They build a semantic network above information resources, which allows users to navigate at a higher level of abstraction. However, Topic Maps are multidimensional knowledge bases and they may be very large. Users may still have problems to find
relevant information within a Topic Map, therefore, the issue of Topic Maps visualisation and navigation is essential. This paper is organised as follows: first we present Topic Maps basic concepts; then, we discuss Topic Maps visualisation requirements and we study how existing visualisation techniques may be applied to Topic Maps representation. We conclude by giving a few directions that could lead to the "ultimate" Topic Map visualisation tool.
2. Topic Maps basic concepts Topic Maps are a new ISO standard [4] which allows to describe knowledge and to link it to existing information resources. Topic Maps are described as the "GPS of the information universe", as they are designed to enhance navigation in complex data sets. Although Topic Maps allow to organise and represent very complex structures, the basic concepts of this model – topics, occurrences and associations - are simple.
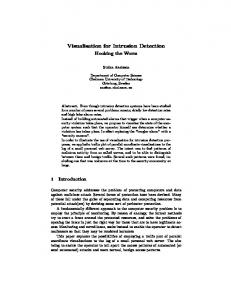
Figure 1. Example of Topic Map
A topic is a syntactic construct which corresponds to the expression of a real-world concept in a computer system. The figure 1 represents a very small Topic Map which contains four topics: XML Europe 2000, Paris, Ile-de-France and France. These topics are instances of other topics: XML Europe is a conference, Paris is a city, Ile-de-France is a region and France is a country. A topic may be linked to several information resources – e.g. Web pages - which are considered to be somehow related to this topic. These resources are called occurrences of a topic. In the Topic Map represented on the figure 1, occurrences of the topic Paris may be URLs pointing to some pictures or maps. Occurrences help organise data and understand their context by providing means of linking real resources to abstract concepts. It is important to notice that topics and information resources belong to two different layers. Users may navigate at an abstract level – the topic level – rather than directly within data. The concepts presented so far – topics and occurrences – allow to organise information resources with regard to a concept. However, it is interesting to describe relationships between these concepts, which is possible in Topic Maps through topic associations. An association adds semantics to data by expressing a relationship between several topics, such as XML Europe 2000 takes place in Paris, Paris is located in Ilede-France, etc. Every topic involved in an association plays a specific role in this association, for example, Ilede-France plays the role of container and Paris plays the role of containee. One advantage of Topic Maps is that they add semantics to existing data – by organising and describing them – without modifying them. Moreover, one single Topic Map may describe several information pools and several Topic Maps may apply to one single information pool. In this section, we described Topic Maps basic constructs: Topic Maps contain topics which are connected by associations and which point to information resources through occurrences. Topics Maps can enhance navigation and information retrieval in complex data sets by adding semantics to these resources. However, a topic may have a high number of dimensions, as it is characterised by its name(s), its type(s), its occurrence(s) – the resources which are related to it - and the role(s) that it plays in associations. Moreover, Topic Maps may also be complex because of their size: they may contain millions of topics and associations.
3. Topic Maps Visualisation As stated in the previous section, Topic Maps are very powerful but they may be complex. Intuitive visual user interfaces may significantly reduce the cognitive
load of users when working with these complex structures. Visualisation is a promising technique for both enhancing users' perception of structure in large information spaces and providing navigation facilities. According to Gershon et al. [3], it also enables people to use a natural tool of observation and processing – their eyes as well as their brain – to extract knowledge more efficiently and find insights. In the following, we first present the goals of Topic Maps visualisation. Then we review different visualisation techniques which may be applied to Topic Maps representation.
3.1. Visualisation goals The goal of Topic Maps visualisation is to help users locate relevant information quickly and explore the structure easily. Thus, there are two kinds of requirements for Topic Maps visualisation: representation and navigation. A good representation helps users identify interesting spots whereas an efficient navigation is essential to access information rapidly. According to Schneiderman [11], "the visual information-seeking mantra is: overview first, zoom and filter, then details on-demand". 3.1.1. Representation requirements. First of all, users should be provided with an overview of the Topic Map. This overview must show the main features of the structure in order to deduce the Topic Map’s main characteristics at a glance. Visual representations are particularly fitted to these needs, as they exploit human abilities to detect patterns. The first thing we need to know about a Topic Map is what it deals with, i.e. what its main concepts are. Once they are identified, more structural information is needed, such as the generality or specificity of the Topic Map. This kind of information should appear clearly on the representation so as to help users compare different Topic Maps quickly and explore only the most relevant ones in detail. The position of topics on the visual display should reflect their semantic proximity. These properties can be deduced from the computation of Topic Maps metrics, as shown by Le Grand and Soto [7]. Moreover, Topic Maps are multidimensional knowledge bases. Topics, associations and occurrences are characterised by many parameters, which should appear somehow in the visualisation. The requirements we stated before are not compatible, as it is not possible – nor relevant – to display simultaneously general information and details. We can compare this to a geographic map; a map of the world cannot – and should not – be precise. If a user is interested in details, she must precise her center of interest, for example by choosing a specific country. As
in geographical maps, we need to provide different scales in Topic Maps representations. Moreover, visualisations should be dynamic to adapt to users' needs in real time. Combinations of time and space can help ground visual images in one's experience of the real world and so tap into the users' knowledge base and inherent structures. 3.1.2. Navigation requirements. A good navigation allows users to explore the Topic Map and access information quickly. Navigation should be intuitive so that it is easy to get from one place to another. Several metaphors are possible: users may travel by car, by plane, by subway or may simply be “teleported” – as on the Web - to their destination. The differences lie in what they see during their journey. From a car, they see details, from a plane they have an overview, etc. Navigation is essential because it helps users build their own cognitive map – a map-like cognitive representation of an environment - and increase the rate at which they can assimilate and understand information. Free navigation should be kept for small structures or expert users as the probability of getting lost is very high. For beginners, who do not know where to start their exploration, predefined navigation paths are preferable until topics of interest are identified. To sum up the visualisation goals, the whole Topic Map should be represented in order to help users understand it globally. This overview should reflect the main properties of the structure. However, users should be able to focus on any part of the Topic Map and see all the dimensions they need. Providing these several scales requires the use of different levels of detail. Finally, users should be able to navigate easily and intuitively at these different levels of detail. In the following section, we study which visualisation techniques meet our requirements and may be used to represent Topic Maps.
3.2. Visualisation techniques Many visualisation techniques are currently available to represent complex data. Among them, graphs, trees and maps seem to be the best suited metaphors for Topic Maps visualisation. 3.2.1. Graphs and trees. Representing Topic Maps as graphs seems natural as they can be seem as a network or graph of topics and associations. The Topic Map shown on the figure 1 is displayed as a graph consisting of nodes and arcs. However, this simple representation may become cluttered and difficult to interpret when the size of the structure increases. As a Topic Map may contain millions of topics and
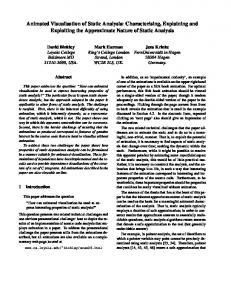
associations, it becomes necessary to use sophisticated graphs visualisation techniques. Graphs and trees are suited for representing the global structure of a Topic Map. However, trees are better understood by human beings since they are hierarchical. Trees are easier to interpret than graphs. Topic Maps are not hierarchies and thus may not be directly represented as trees. However, it may be interesting to transform small parts of the Topic Map into trees. By doing so on a little part of the Topic Map (to avoid clutter), we may benefit from the advantages of trees. The challenge of graph visualisation is to provide graphs which display many nodes but remain readable. A first solution, proposed by Munzner [9], is to use hyperbolic geometry – instead of euclidian geometry – which allows to display a very large number of nodes on the screen. Another solution to the lack of space on the screen is to represent Topic Maps in three dimensions. A 3D interactive Topic Map visualisation tool – UNIVIT (Universal Interactive Visualisation Tool) - was implemented by Le Grand and Soto [6], which uses virtual reality techniques such as 3D, interaction and different levels of detail, as shown on figure 2.
Figure 2. UNIVIT Representation Moreover, the quality of the visualisation can be increased by an efficient node positioning, which makes it possible to intuitively derive information from the distance between nodes. For instance: • topics linked together by an association may be represented close to each other in the graph. • topics of the same type or pointing to the same occurrences may be clustered. Graphs and trees meet our first requirement since they may represent the whole Topic Map. However, users also need to see detailed information about the topics they are interested in. This second requirement, which consists in representing all the different
parameters of a Topic Map (name, type, etc.), may be really challenging. Different shapes and colors may be used to symbolize various dimensions of nodes and arcs of the graph. However, the number of different shapes, colors, icons and textures is limited, which makes this kind of representation unsuited to a Topic Map containing millions of topics and associations. In order to display detailed information, it is thus necessary to focus on a part of the Topic Map. A graphlike overview of a Topic Map helps users understand the structure globally and select specific topics they may be interested in. Once a topic is selected, it is easy to display very precise information about it. Once users' needs are clearly identified, a useful way to represent a Topic Map is to display a list -or index- from which it is possible to select a topic and see related information. The navigation is usually the same as on Web sites: users click on a link to open a new topic or association. An example of such a visualization is provided by the Ontopia Omnigator [10], as shown on figure 3.
Figure 4. Mondeca's Topic Navigator 3.2.2. Maps. Topic Maps aim at enhancing navigation within complex data sets. In the real world, maps are used to achieve this goal. It is thus natural to consider representing Topic Maps as maps. A map should display the most significant elements of the structure. The location and the size of these elements on the map is essential. In the Tree-Maps proposed by Bruls et al. [1], data is reorganized so as to reflect the relative importance of topics, as shown on the figure 5. These Tree-Maps may be used to represent Topic Maps.
Figure 3. Ontopia Navigator We showed that the global view and precise parameters could not be displayed at the same level of detail. It is essential that users can navigate easily from one level of detail to another. Some tools already provide interactive graphical visualizations. Mondeca’s Topic Navigator [8] builds graph representations in realtime, according to what users are allowed or need to see (figure 4).
Figure 5. Tree-Map One of the challenges of Topic Maps visualisation as maps is to find optimal coordinates for the topics. The Self-Organizing Maps (SOM) algorithm, proposed by Kaski, Kohonen et al. [5] can be used to achieve this by
organising the topics onto a two-dimensional grid so that related topics appear close to each other. Factor analysis can also be used to compute topics coordinates. Davison [2] explains how the multi-dimensional scaling (MDS) algorithm uses similarity measures between topics to provide a 2D map of the structure. The figure 6 is an example of map which represents a small Topic Map about rock music.
Figure 7. Themescape Representation
Figure 6. MDS Map The ThemeScape software by Cartia Inc. (1992) provides different types of maps. They look like topographical maps with mountains and valleys, as shown on the figure 7. The concept of the layout is simple: documents with similar content are located close to each other and peaks appear where there is a concentration of closely related documents. Higher numbers of documents create higher peaks. The valleys between peaks may be interesting because they contain fewer documents and more unique content. The labels reflect the major two or three topics represented in a given area of the map, providing a quick indication of what the documents are about. Additional labels often appear when we zoom into the map for greater detail. We can zoom to different levels of magnification to declutter the map and reveal additional documents and labels. This visualisation is very interesting since it combines different representations in several windows. Users may choose one of them according to the selected type of information. Visual tools may utilise animated 3D landscapes which take advantage of human beings' ability to navigate in three-dimensional spaces, recognize patterns, track movement, and compare objects of different sizes and colors. Users may have complete control over the appearance of data. Virtual reality techniques include interactivity and the use of different levels of detail (LOD). Immersion in virtual worlds makes users feel more involved in the visualisation.
A representation of Topic Maps as virtual cities, developed by Le Grand and Soto [7], is shown on the figure 8. Topics are represented as buildings which coordinates are computed from a matrix of similarities between topics. Users may navigate freely or follow a guided tour through the city; they may also choose to walk or fly. The properties of topics are symbolised by the characteristics of the corresponding buildings, such as name, color, height, width, depth, etc. Occurrences and associated topics are displayed in two windows at the bottom of the screen. As human beings are used to 2D, a traditional 2D map is also provided and the two views – the map and the virtual city – are always consistent.
Figure 8. Topic Map as a Virtual World Users may explore the world and interact with data. However, they may get lost in the virtual world. In order to avoid these problems, predefined navigation paths are also proposed. The different levels of detail make it
possible to display many scales: details appear only when the user is close to the subject of interest.
4. Conclusion In this paper, we presented Topic Maps basic concepts. These structures may be complex, thus efficient visualisation techniques are essential. We reviewed different types of visualisation metaphors, especially graphs, trees, maps and virtual worlds. Some of them may represent efficiently the global structure while others are better at displaying details or providing interaction with data. In fact, each technique is wellsuited for a specific level of detail. The best way to benefit from the advantages of each method is thus to provide several levels of details for the representation of Topic Maps. This can be done by displaying several windows or by selecting the most appropriate representation at a given level of detail. A specific visualisation tool is usually adapted to display a certain amount of data. The limit of this approach is that giving users too many options may confuse them and result in an over-complicated interface. If only one tool is to be used for visualisation, the Topic Map may be filtered or clustered to reach the scale at which the tool is useful, which was proposed by Le Grand and Soto [7]. This is achieved through a conceptual analysis of the Topic Map, which allows us to characterize the structure and identify the topics which are the most relevant to users needs.
5. References [1]
Bruls, M., Huizing, K., van Wijk, J. J., 2000, Squarified Treemaps, Proceedings of Joint
[2] [3] [4]
[5] [6] [7]
[8] [9] [10] [11]
[12] [13] [14]
Eurographics and IEEE TCVG Symposium on Visualization, IEEE Press, pp. 33-42. Davison M. L., 1992, Multidimensional scaling, Malabar, Fl, CA : Krieger Publishing. Gershon, N., Eick, S.G., 1995, Visualisation's New Tack: Making Sense of Information, IEEE Spectrum, pp. 38-56. International Organisation for standardization (ISO), International Electrotechnical Commission (IEC), Topic Maps, International Standard ISO/IEC 13250:1999, 19 April 1999. Kaski, S., Honkela, T., Lagus, K., Kohonen, T., 1998, WEBSOM – self_organising maps of document collections, Neurocomputing, volume 21, pp 101-117. Le Grand, B., Soto, M., 2000, Information management – Topic Maps visualization, XML Europe 2000, Paris, France. Le Grand, B., Soto, M., 2001, XML Topic Maps and Semantic Web Mining, Semantic Web Mining Workshop, ECML/PKDD 2001 conference, Freiburg, Germany. Mondeca, 2001, Topic Navigator, http://www.mondeca.com/site/products/products.html. Munzner, T., 1997, H3: Laying Out Large Directed Graphs in 3D Hyperbolic Space, IEEE Symposium on Information Visualization. Ontopia, 2001, Ontopia Topic Map Navigator, http://www.ontopia.net/solutions/navigator.html Shneiderman, B., 1996, The eyes have it: a task by data type taxonomy for information visualizations, Proceedings of 1996 IEEE Visual Languages, Boulder, CO, pp. 336-343. ThemeScape Product Suite, http://www.cartia.com/products/index.html TopicMaps.Org XTM Authoring Group, 2001, XTM: XML Topic Maps (XTM) 1.0: TopicMaps.Org Specification. World Wide Web Consortium, 1999, Resource Description Framework (RDF) Model and Syntax Specification, W3C.