Visualization and Classification of Documents: A New Probabilistic Model to Automated Text Classification. Giorgio Maria Di Nunzio Department of Information Engineering – University of Padua Via Gradenigo, 6/a – 35131 Padova – Italy
[email protected]
Abstract. A novel two-dimensional representation of documents may be used both to visualize and classify textual documents and to build classification schemes that may be used to browse, explore, and retrieve resources from Digital Library Management System (DLMS)s. We propose a mathematical formalization of the two-dimensional approach where documents’ coordinates are defined as probabilities. An extension of the two-dimensional classification algorithm, named selective re-projection, is also proposed. Experiments showed that this approach confirmed to be an alternative to classical classification methods for text classification. In particular the low requirements of space and time and the intuitive representation of the two-dimensional plots make this approach a valuable support for analysis of textual collections.
1
Introduction
Digital Library Management Systems (DLMSs) generally manage collections of multi-media digitalized data and include components that perform the storage, access, retrieval, and analysis of the collections of data. Multi-media digital libraries require new solutions for content organization, access and interaction. In particular, user interfaces, querying, browsing and visualization solutions are important and critical subjects of investigation [1]. In this context, DLMS designers not only deal with increasingly complex data sources but are continually confronted by the complexity of different user needs and abilities [2]. For this reason, a taxonomy (or subject hierarchy, classification scheme) may be used to browse, explore, and retrieve resources from DLMSs. Interfaces that use this kind of taxonomy are typically used by users when they want to express their information needs in terms of keywords or when the specific request is not clear in their mind [3]. Building taxonomies or classification schemes is a general classification problem where objects having attributes (or features) are placed into categories based on the values of these attributes. A particular instance of the classification problem is Automated Text Classification (ATC) where document words are interpreted as the features, and entire documents are the objects interpreted
as numerical vectors [4]. The size of the dictionary, that is to say the number of words, of the corpus being classified is considerable; this number may easily reach the hundreds of thousands. Processing the collection and training the system becomes extremely costly in computational terms by means of standard classification techniques; hence, a reduction of the original space is needed. The choice of the number of words that constitutes the vector space for the documents is a crucial and challenging point. In fact, it is necessary a trade-off between the accuracy of the classifier and the time spent to train and validate it, being this latter strictly tied to the size of the vocabulary of words chosen. The feature selection approach is a widely used approach to reduce the size of the vocabulary [5,6,7]. In literature, different statistical methods, such as Naive Bayes [8,9], ridge logistic regression [10], and support vector machines [11], showed that it is possible to achieve a good tradeoff between efficiency and effectiveness through feature selection approaches. The question of the number of features also arises also when a compact visualization of the textual documents is needed. In scientific visualization and information visualization, the graphical models are typically constructed from measured or simulated data representing objects or concepts associated with phenomena from the physical world [12]. Several techniques for visualizing multidimensional data sets have been studied [13] since, in general, there is no standard mapping into the Cartesian coordinate systems. In spite of several visualization approaches in literature, there are very few examples of applications where text classification methods are used; self-organizing maps are probably the most used technique of visualization for text classification [14]. However, visualization methods provide only limited forms of guidance, visual or non-visual, for the user when training/testing an ATC system. Typically, the user selects the dataset and tunes the values for some parameters of the classification algorithm which are often difficult to determine a priori. Usually users do not obtain any intermediate result and have no possibility to intervene during the execution of the algorithm.
2
Background and Motivations
In our previous research, we showed that with an intuitive formulation of two simple parameters, namely presence and expressiveness, for each word of the vocabulary of the corpus, it is possible to build an ATC system that performs well without an explicit need of a feature selection phase [15]. Moreover, the combination of these two basic parameters in weights for each word (named local and global weights), and then in coordinates of a document d (simply named X(d) and Y (d)) leads to a two-dimensional representation of documents [16,17] where it is possible to use efficient learning algorithms [18]. It has been also shown that this representation achieves a difference in performance with respect to state-of-the-art statistically significantly less than 4 point percent [19]. There are three significant advantages of this approach proposed that we want to summarize here:
– one is that there is no explicit need for feature selection to reduce dimensionality since documents are represented by only two dimensions; – another is that the space required to store objects is very limited as well as the computational cost for training the classifier; – finally, there is an undoubt benefit with the 2-D visualization of collections to analyze performances and find possible relations among categories. The major drawback so far is that the definition of the parameters is still intuitive and not formalized. For this reason, the main motivation of this work is to formalize mathematically the two-dimensional representation of documents and to present it as a probabilistic model. We want to give a probabilistic interpretation of the documents’ coordinates and to compare our model with well-known probabilistic models in ATC, namely the Naive Bayes models, and particularly the multi-variate Bernoulli Naive Bayes model.
3
Mathematical Formalization
Before we start the formalization, we would like to introduce briefly the Naive Bayes approach that makes use of a simple theorem of probability known as Bayes’ rule: P (x|ci ) P (ci |x) = P (ci ) × P (x) where ci and x are values taken by random variables C and X. C is a random variable whose values are classes (c1 , ..., ci , ..., cn ) while X is a vector random variable whose values are vectors of feature values x = (x1 , . . . , xk ). A common strategy to estimate the probability P (x|ci ) is to assume that it can be decomposed in the following way: P (x|ci ) =
k Y
P (xj |ci ) .
j=1
This assumption is usually referred to as independence assumption where the occurrence of a particular value of xj is statistically independent of the occurrence of the other xj 0 , given a document of class ci . The two-dimensional probabilistic model that is going to be presented makes an implicit use of the independence assumption; moreover, two more assumptions are added: 1. the frequency of a word inside a document is not important; 2. the relative number of documents in each category, according to the training set, is not considered, and only the relative frequency inside the category is considered. The first assumption is exactly the same of that of the multi-variate Bernoulli model where documents are considered as boolean vectors (a word is either present or not in a document regardless of the frequency). The second assumption
considers each category to be equiprobable, while the probability of finding a document containing a term t inside a particular category depends on the relative frequency of documents containing that term into the category. Given a collection of documents and a set of categories C = {c1 , ..., ci , ..., cn }, and given the assumption stated before, two basic measures will be defined: the presence of a term t in the category ci , and the expressiveness of a term t in the category ci . These two measures will be also defined for a general subset of categories Γ ⊂ C. 3.1
Presence and Expressiveness
The presence of a term t in the category ci , that is Pˆ (t, ci ), is given by the ratio Ni|t /Ni between the number of documents in ci in which term t appears at last once, and the total number of documents in ci . A straightforward frequentist interpretation of this ratio gives that the ratio is the probability that a document randomly sorted from ci contains t at least once; let us call this probability P[t ∈ ci ]. Keeping in mind the assumption we have done earlier, we can easily express the general presence of a term t in the set of categories Γ in terms of the probability that a document randomly sorted from Γ contains t at least once. In fact, by using the total probability theorem, we get: P Nj|t X 1 X j∈γ Nj P[t ∈ Γ ] = P[t ∈ Γ |cj ]P[cj ] = P[t ∈ cj ] = = Pˆ (t, Γ ) |Γ | j∈γ |Γ | j∈γ where we used the equality P[t ∈ Γ |cj ] = P[t ∈ cj ], since the probability that a document randomly sorted from Γ contains t at least once, when cj is the observed category in Γ , equals the probability that a document randomly sorted from cj contains t at least once. Similarly, the general expressiveness of a term t in the set of categories Γ , ˆ Γ ), is given by that is E(t, ˆ Γ ) = 1 − Pˆ (t, C − Γ ) = P[{t ∈ C − Γ }C ] = P[t 6∈ C − Γ ] E(t,
(1)
where {t ∈ C − Γ }C denotes the complement set of {t ∈ C − Γ }. Formula (1) shows that the general expressiveness of a term t in the set of categories Γ equals the probability that a randomly sorted document in C −Γ does not contain term t. 3.2
Local and Global Term Weighting
Let us define now the weight of a term t in a set of categories Γ , with respect to the rest of the world C − Γ . We have: ˆ Γ) . W (t, Γ ) = Pˆ (t, Γ ) · E(t, It is easy to see that LW (t, ci ) = W (t, ci ) and GW (t, C − ci ) = W (t, C − ci ). Again, the weight of a term t in a set of categories — and so local and global
weights — can be interpreted as a probability. To show this fact, suppose we consider the following experiment: let us randomly sort a document from Γ and, independently, a document from C − Γ . To mathematically model this experiment, we can consider the probability space S, which models the experiment, as the Cartesian product of two independent spaces SΓ and SC−Γ , modelling the random sorting of a document from Γ and C − Γ , respectively [20]. Now, the probability of sorting both a document containing term t at least once from Γ and a document not containing term t from C − Γ is given by: ˆ Γ ) = W (t, Γ ) P[t ∈ Γ, t 6∈ C − Γ ] = P[t ∈ Γ ]P[t 6∈ C − Γ ] = Pˆ (t, Γ ) · E(t, which proves our statement. 3.3
Local and Global Coordinates
Finally, a probabilistic interpretation of local and global coordinates can be given by defining suitable probability spaces. In fact, once a set of categories Γ is fixed, we can consider a sample space Ω = {t1 , t2 , . . . , tN } of all the terms of the vocabulary; moreover, W (t, Γ ) can be seen as an additive measure on Ω. Now, given a generic subset A = {tj1 , tj2 , . . . , tjk } of Ω, the probability of A can be defined as Pk W (tjl , Γ ) P[A] = Pl=1 . (2) N i=1 W (ti , Γ ) From Formula (2) it is straightforward to get that both Xi and Yi coordinates of a document can be seen as probabilities. For the sake of the reader, we report here the definition of the coordinates given a vocabulary of term T = Ω and a document d = A: Pk Pk LW (tjl , Γ ) l=1 GW (tjl , Γ ) Xi (d) = Pl=1 , Y (d) = . PN i N i=1 LW (ti , Γ ) i=1 GW (ti , Γ )
4
Training the Classifier : Selective Re-projection
Once the documents are projected in the two-dimensional space, it is possible to classify them using the algorithms we proposed in past works [15,16,18]. The general idea is that given a point p(0, q) close to the origin, |q| < 0.1, a straight line that separates the documents of category ci from the remainder documents exists according to some criterion and its equation is Yi,opt = mopt · Xi + qopt , where mopt is an appropriate angular coefficient. It has been observed that the algorithms in question showed to be efficient and graphically appealing; nevertheless, performances on different collections never reach state-of-the-art although the difference in performance is statistically significantly less than four
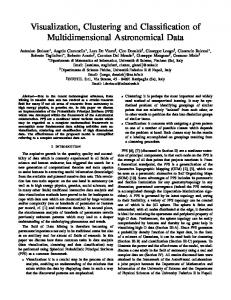
point percent [19]. In the following paragraphs a novel approach that exploits the overlapping categories, that is to say the categories that have a similar distribution on the plane, will be presented and tested to verify whether performances increase or not. Given a category of interest Γ = ci , if one projects singularly each category of the set C −Γ = C −ci , it is possible to find one or more categories that clearly overlap with ci (see for example Fig. 1). If one removed the overlapping category, there would be a situation where the positive and negative documents are almost linearly separable in the two-dimensions. This peculiar behavior suggested a second learning phase named selective re-projection that can be summarized with the following steps: 1. Find overlapping categories – find the category oi ∈ C that overlaps most with ci ; – remove oi from the set C; oi – find the optimal separating line Yi,opt , where oi at top indicates that the overlapping category was removed from the set C. 2. Create a secondary two-dimensional space – create a secondary new two-dimensional space with C 0 = {ci , oi } where Γ 0 = ci and C 0 − Γ 0 = oi The two steps are now discussed in more details. 4.1
Find Overlapping Categories
In the first step, the main concern is to find the overlapping category in the primary two-dimensional space (with primary we intend the space found with Γ = ci and C − Γ = C − ci ). The procedure we follow to find it is the following: 1. Find the parameters needed for the two-dimensional representation with Γ = ci ; 2. for each category cj ∈ C −ci with j 6= i, find the best separating line between the two categories; 3. repeat the steps above for all the cj with j 6= i; 4. find the category oi that overlaps most over ci ; 5. remove from the training set S, those documents which belong to the category oj ; oi 6. find the best separating line Yi,opt between ci and the reduced set C − ci − oi . At the end of point 3, a list of accuracy measures is produced for each pair (ci , cj ), and it is important to choose a criterion to decide what is the overlapping category. Determining the overlapping category the one that produces the lowest accuracy is a poor choice. In order to find what are the candidates to be the overlapping categories, we monitored the output of this measures and put a Lower Control Limit (LCL) [21] equal to: LCL = mean(x) − 3 · std(x) where x is the vector of the observed measures. Then, from all the measures (hence categories) that are below the LCL, the smallest one is chosen as the candidate oi .
Fig. 1. Training documents of Reuters-21578 collection projected in the two dimensional space. Positive documents are the ones of the category of interest ci , negative documents are the ones of the set C − ci . Documents highlighted with circles are those of a category oi ∈ C − ci that overlaps most with ci
4.2
Projecting Documents in the Secondary Space
oi Once category oi has been found as well as the separating line Yi,opt , the second step aims to build the new secondary two-dimensional space (with secondary we intend the space found with C 0 = {ci , oi } and Γ 0 = ci ) with following passages:
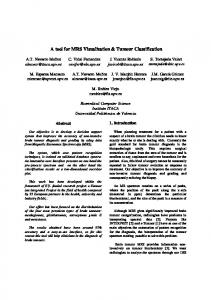
1. recompute the parameters of the coordinates considering C 0 = {ci , oi } and Γ 0 = ci ; oi 2. project all the training documents which fall below the optimal line Yi,opt (of the primary space) in the secondary space; ∗ 3. find the new separating line Yi,opt in the secondary space. In Fig. 2 the documents of the two overlapping categories of Fig. 1 which fall below the separating line (not shown in figures) have been re-projected in the secondary space. The figure shows clearly a better separation between the two categories of documents. Testing whether a document d belongs to ci requires four steps: project d oi with the original coordinates, check if d is below the optimal line with Yi,opt , ∗ re-project d in the new space, check if d is below the new optimal line Yi,opt . If all these conditions are true than the documents is assigned to ci .
Fig. 2. The documents of the two overlapping categories of Fig. 1 which fall below the oi separating line Yi,opt have been re-projected in the secondary space.
5
Experimental Analysis
To make the evaluation of the two-dimensional probabilistic model comparable to most of the published results on ATC, the Reuters-215781 and RCV12 were chosen as a benchmark. The experimentation in this paper used the ModApte split of Reuters-21578, and only the 10 most frequent of the 135 potential categories herein are examined; these 10 categories account 7,193 training documents and 2,787 test documents. A sample of 16 categories out of the 103 potential categories of RCV1 were chosen. These 16 categories approximately follow the distribution of the documents of the whole collection [7]. The training set (30,529 documents) consisted on the first month of the Reuters year (August 20 1996, September 19 1996) while the test (36,243 documents) set was the last Reuters month (July 20 1997, August 19 1997) (a similar choice on the months has been done in one of the experiments of [22]). Some text preprocessing was done on the documents: a first cleaning was done removing all the punctuation marks and and converting all the letters to lowercase. A stoplist of 232 words was used to remove the most frequent words 1 2
http://www.daviddlewis.com/resources/testcollections/reuters21578/ http://about.reuters.com/researchandstandards/corpus/
of the English language, finally the English Porter stemmer3 was used as the only method to reduce the space of terms. Numerical tokens were removed in two experiments out of three, to see the difference in performance when using a whole alpha-numeric vocabulary. Standard IR evaluation measures were used. Recall ρi and Precision πi are defined for each category ci as (using the same notation of [4]): ρi =
T Pi T Pi + F Ni
πi =
T Pi T P i + F Pi
where T Pi (true positive) is the number of documents correctly classified under category ci , and F Ni (false negative) and F Pi (false positive) are defined accordingly. A measure which combines ρi and πi is the Fβ function [23]: Fβ =
(β 2 + 1) · πi · ρi β 2 · πi + ρi
(3)
where the parameter β is used to weight differently, or equally, Recall and Precision. The macro-averaged F1 was calculated to evaluate the performance of the classifier for the whole set of categories. The F1 measure was also used to measure the accuracy of the classifier during phase 1 described in Sect. 4.1 to find the overlapping category. The SVMLight package4 , a widely used implementation of Support Vector Machines (SVM), was employed with the default parameters (linear kernel) as a baseline to compare performances. In this case, each word was weighed using a standard TfIdf weighting scheme (tfc according to the notion of [24]), and no feature selection was performed. Tables 1 and 2 show the F1 performances of different approaches with respect to the SVM baseline. We used a k-fold cross validation with k = 5, and we ran 10 times each cross-validation. The tables report the average of the performances. Table 1 reports performance comparison on Reuters-21578. For each category is reported the F1 measure of the two-dimensional (standard) approach (Normal ), the selective re-projection approach (Re-proj ) and the SVM baseline. The last line presents the F1 macroaverage values for each approach. A categoryby-category investigation shows that the re-projection in the new space usually improves performances. The maximum gain in performance is obtained on category corn (+34.8%) while on category interest there is a loss of -1.5%. The overall gain on the F1 measure is +7.8%. Moreover, significance tests (using the signed rank test) show that the difference in performance between Re-proj and SVM is not appreciable, and the two approach may be considered comparable. Table 2 presents performance comparison on RCV1 using a vocabulary of words with/without numbers. There is a positive improvement in both experiments although it is much more appreciable when numerical tokens are removed. When only words are used, the overall gain on the F1 measure is +7.8%; when the 3 4
http://www.tartarus.org/∼martin/PorterStemmer/ http://svmlight.joachims.org/
whole vocabulary is used the overall gain on the F1 measure is +3.2%. Again, significance tests confirmed that there is no difference between Re-proj and SVM outputs; nevertheless it can be noticed that when the whole vocabulary is used there SVM performs a little bit better. Table 1. Performance comparison on Reuters-21578 category earn acq money-fx grain crude trade interest wheat ship corn F1 macro
6
Normal 0.946 0.855 0.759 0.889 0.824 0.797 0.750 0.784 0.845 0.596 0.805
Re-proj 0.971 0.939 0.862 0.916 0.874 0.860 0.739 0.843 0.867 0.804 0.868
SVM 0.987 0.950 0.762 0.929 0.885 0.776 0.737 0.859 0.805 0.854 0.855
Conclusions
The paper presented a mathematical formalization of the two-dimensional text categorization approach. A probabilistic definition of documents’ coordinates has been proposed, and an extension of the two-dimensional classification algorithm, named selective re-projection, was proposed in order to improve performances. The system was empirically evaluated and tested on Reuters-21578 and Reuters Collection Volume 1 benchmarks using standard evaluation measures. Significance test confirmed that there is no difference in performance between the two-dimensional approach and state-of-the-art SVM. Therefore, this approach confirmed to be an alternative to classical classification methods for text classification. In particular the low requirements of space and time and the intuitive representation of the two-dimensional plots make this approach a valuable support for analysis of textual collections.
Acknowledgment The author would like to give the most sincere thanks to Luca Pretto for the fruitful cooperation in carrying out together the formalization part of this work.
References 1. Catarci, T., Christodoulakis, S., Del Bimbo, A., eds.: 7th International Workshop of the EU Network of Excellence DELOS on Audio-Visual Content and Infor-
Table 2. Performance comparison on RCV1 category godd c313 c15 e121 e132 ghea gobit gpol gspo m14 m143 c183 e13 e21 e142 c13 F1 macro
2.
3.
4. 5.
6. 7.
8.
9.
tokens without numbers all tokens Normal Re-proj SVM Normal Re-proj SVM 0.344 0.779 0.221 0.4809 0.4851 0.1895 0.078 0.239 0.044 0.0862 0.2037 0.0222 0.803 0.862 0.860 0.9310 0.9418 0.9746 0.606 0.671 0.660 0.7452 0.7412 0.7742 0.939 0.916 0.977 0.4541 0.4885 0.5179 0.730 0.729 0.818 0.5759 0.6706 0.6586 0.516 0.850 0.097 0.4941 0.2162 0.0000 0.898 0.776 0.978 0.7997 0.7645 0.8594 0.697 0.932 0.938 0.9417 0.9616 0.9812 0.970 0.987 0.990 0.8912 0.8845 0.9749 0.428 0.709 0.661 0.7071 0.8830 0.9349 0.787 0.462 0.920 0.7207 0.7018 0.7596 0.744 0.825 0.773 0.7804 0.6952 0.9056 0.712 0.840 0.894 0.6480 0.7958 0.8905 0.600 0.563 0.480 0.4167 0.5385 0.2727 0.559 0.652 0.704 0.5605 0.6088 0.6946 0.670 0.737 0.748 0.6632 0.6848 0.7026
mation Visualization in Digital Libraries (AVIVDiLib‘05), Cortona (AR), Italy, Centromedia, Capannori (Lucca), Italy (2005) Adams, A., Blandford, A.: Digital libraries’ support for the user’s ‘information journey’. In: 5th ACM/IEEEE Joint Conference on Digital Libraries (JCDL-05), Denver, CO, USA, ACM Press, New York, NY, USA (2005) 160–169 Krowne, A., Halbert, M.: An initial evaluation of automated organization for digital library browsing. In: 5th ACM/IEEEE Joint Conference on Digital Libraries (JCDL-05), Denver, CO, USA, ACM Press, New York, NY, USA (2005) 246–255 Sebastiani, F.: Machine learning in automated text categorization. ACM Computing Surveys 34 (2002) 1–47 Yang, Y., Pedersen, J.O.: A comparative study on feature selection in text categorization. In Fisher, D.H., ed.: Proceedings of the Fourteenth International Conference on Machine Learning (ICML–97), Nashville, Tennessee, US, Morgan Kaufmann Publishers, San Francisco, US (1997) 412–420 Forman, G.: an extensive empirical study of feature selection metrics for text classification. Journal of Machine Learning Research 3 (2003) 1289–1305 Mladenic, D., Brank, J., Grobelnik, M., Milic-Frayling, N.: Feature selection using linear classifier weights: Interaction with classification models. In: Proceedings of the 27-th International ACM SIGIR (SIGIR–04), Sheffield, UK, ACM Press, New York, NY, USA (2004) 234–241 Eyheramendy, S., Lewis, D.D., Madigan, D.: On the naive bayes model for text categorization. In: Proceedings of the 9-th International Workshop Artificial Intelligence and Statistics (AISTATS–03), Key West, Florida, US (2003) McCallum, A., Nigam, K.: A comparison of event models for naive bayes text classification. In: AAAI/ICML-98 Workshop on Learning for Text Categorization, Madison, WI, USA, AAAI Press (1998) 41–48 Technical Report WS-98-05.
10. Zang, T., Oles, F.J.: Text categorization based on regularized linear classification methods. Information Retrieval 4 (2001) 5–31 11. Joachims, T.: Text categorization with support vector machines: Learning with many relevant features. In N´edellec, C., Rouveirol, C., eds.: Proceedings of the Tenth European Conference on Machine Learning (ECML–98), Chemnitz, DE, Springer Verlag, Heidelberg, DE (1998) 137–142 12. Keim, D.A.: Information visualization and visual data mining. IEEE Transactions on Visualization and Computer Graphics 8 (2002) 1–8 13. Keim, D.A., Kriegel, H.P.: Visualization techniques for mining large databases: A comparison. IEEE Transactions on Knowledge and Data Engineering 8 (1996) 923–938 14. Kohonen, T., Kaski, S., Lagus, K., Salojrvi, J., Honkela, J., Patero, V., Saarela, A.: Self organization of a massive document collection. IEEE Transaction on Neural Networks 11 (2000) 574–585 15. Di Nunzio, G.M., Micarelli, A.: Does a new gaussian weighting approach perform well in text categorization? In Gottlob, G., Walsh, T., eds.: Proceedings of the Eighteenth International Joint Conference of Artificial Intelligence (IJCAI–03), Acapulco, Mexico, Morgan Kaufmann Publishers, San Francisco, US (2003) 581– 586 16. Di Nunzio, G.M.: A bidimensional view of documents for text categorisation. In: Proceedings of the 26-th European Conference on Information Retrieval (ECIR– 04). Number 2997 in LNCS, Sunderland, UK, Springer Verlag (2004) 112–126 17. Di Nunzio, G.M.: 3-d environment to represent textual documents for duplicate detection and collection examination. In Catarci, T., Christodoulakis, S., Del Bimbo, A., eds.: 7th International Workshop of the EU Network of Excellence DELOS on Audio-Visual Content and Information Visualization in Digital Libraries (AVIVDiLib‘05), Cortona (AR), Italy, Centromedia, Capannori (Lucca), Italy (2005) 12–21 18. Di Nunzio, G.M., Micarelli, A.: Pushing “underfitting” to the limit: Learning in bidimensional text categorization. In: Proceedings of the 16th European Conference on Artificial Intelligence (ECAI–04), Valencia, Spain, IOS Press (2004) 465–469 19. Di Nunzio, G.M.: Cross-comparison for two-dimensional text categorization. In: Proceedings of the 11-th Symposium on String Processing and Information Retrieval (SPIRE-04). Number 3246 in LNCS, Padova, Italy, Springer Verlag (2004) 125–126 20. Feller, W.: An Introduction to Probability Theory and Its Applications. Third edn. Volume I. John Wiley & Sons, New York (1968) 21. Ross, S.: Introduction to Probability and Statistics for Engineers and Scientists. Academic Press (2000) 22. Damerau, F.J., Zhang, T., Weiss, S.M., Indurkhya, N.: Text categorization for a comprehensive time-dependent benchmark. Information Processing and Management 40 (2004) 209–221 23. van Rijsbergen, C.J.: Information Retrieval. Second edn. Dept. of Computer Science, University of Glasgow, Glasgow, UK (1979) 24. Salton, G., Buckley, C.: Term-weighting approaches in automatic text retrieval. Information Processing & Management 24 (1988) 513–523