Visualizing the Runtime Behavior of Embedded Network Systems: A Toolkit for TinyOS Andrew R. Daltona , Sally K. Wahbab , Sravanthi Dandamudib , Jason O. Hallstromb,∗ a Department
of Mathematics and Computer Science, Western Carolina University, Cullowhee, NC 28723,USA b School of Computing, Clemson University, Clemson, SC 29634,USA
Abstract TinyOS is an effective platform for developing lightweight embedded network applications. But the platform’s lean programming model and power-efficient operation come at a price: TinyOS applications are notoriously difficult to construct, debug, and maintain. The development difficulties stem largely from a programming model founded on events and deferred execution. In short, the model introduces non-determinism in the execution ordering of primitive actions — an issue exacerbated by the fact that embedded network systems are inherently distributed and reactive. The resulting set of possible execution sequences for a given system is typically large and can swamp developers’ unaided ability to reason about program behavior. In this paper, we present a visualization toolkit for TinyOS 2.0 to aid in program comprehension. The goal is to assist developers in reasoning about the computation forest underlying a system under test and the particular branches chosen during each run. The toolkit supports comprehension activities involving both local and distributed runtime behavior. The constituent components include (i) a full-featured static analysis and instrumentation library, (ii) a selection-based probe insertion system, (iii) a lightweight event recording service, (iv) a trace extraction and reconstruction tool, and (v) three visualization front-ends. We demonstrate the utility of the toolkit using both standard and custom system examples and present an analysis of the toolkit’s resource usage and performance characteristics. Key words: Embedded network systems, sensor networks, TinyOS, nesC, program visualization, program comprehension, dynamic analysis, static analysis
1. Introduction Embedded network systems continue to attract tremendous interest across a diverse range of application domains. The burgeoning community formed around this technology is a witness to its potential to transform the computing landscape. This new system class, with sensor networks serving as the typifying example, holds the potential to bring invisible computing from the pages of science fiction to the forefront of our daily lives. Indeed, the transformation has already begun: Sensor networks are changing the way we interact with our peers [1, 2], observe our planet [3, 4, 5], and protect our communities [6, 7, 8] — and we are just getting started. Our work is motivated by the observation that TinyOS [9, 10, 11] has served as an important catalyst for initiating this transformation and by the expectation that it will continue to play a prominent role in the years ahead. There are a number of factors that contribute to the continued adoption of TinyOS. Among the most significant is the programming model that the operating system provides to developers and the benefits that this model imparts. Specifically, the model aids developers in constructing applications that are both lightweight and power-efficient, making it well-suited to a host of hardware platforms and in situ deployments. ∗ Corresponding
author. Email addresses:
[email protected] (Andrew R. Dalton),
[email protected] (Sally K. Wahba),
[email protected] (Sravanthi Dandamudi),
[email protected] (Jason O. Hallstrom) Preprint submitted to Science of Computer Programming February 6, 2009
X()
X()
Z()
Y()
Z()
Y()
S1
S2
τS1 = [X(Y Z|Z)] X()
τS2 = [X(Y Z|Z)|Y Z] τS3 = [X(Y Z|")[Y (Y Z|")Z(Y Z|")| Z(Y Z|")]]
Z()
Y() S3
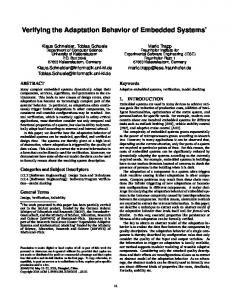
Figure 1: Example Execution Patterns
The central guiding principle is a control flow model based on events and deferred execution. By contrast to the typical linear style of desktop- and server-class systems, TinyOS applications execute in a reactive style. Nodes spend much of their time sleeping, waking periodically to execute a short series of actions —typically involving coordination with peers— before falling back into an idle state. The short bursts of activity are triggered by internal interrupts (e.g., clock sources, ADC completion signals), external interrupts (e.g., message reception events), and the execution of previously deferred actions (e.g., long-running operations best executed outside interrupt context). Abandoning a thread-based model in favor of events limits memory and energy consumption — precious resources on platforms intended for in situ deployment. But these benefits come at a significant price: TinyOS applications are notoriously difficult to construct, maintain, and debug. Problem Statement. The reactive model provided by TinyOS introduces non-determinism in the execution ordering of an application’s primitive actions. In the sequential programming paradigm, control flow originates from a single source within each thread, and the constituent actions execute linearly to completion. By contrast, actions within a TinyOS application are “selected” for execution based on interrupt patterns and previously deferred execution requests; certain actions are preemptive. As a result, the execution ordering that arises at runtime cannot be predicted a priori. Moreover, embedded network systems are, by definition, distributed and reactive. Hence, in addition to the comprehension difficulties associated with tracing local program actions, developers must identify the causal connections among these actions to faithfully trace the system’s global behavior. The non-determinism associated with distributed and reactive systems is well-known: The execution ordering of local actions is influenced by message delivery and loss patterns, environmental conditions, and other factors that cannot be predicted in advance. The non-determinism inherent to the TinyOS programming model may require further explanation. In contrast to thread-based systems, in which path sets tend to grow 1slowly with program size and follow naturally from application structure, path sets grow quickly in TinyOS systems and tend not to mirror source structure. To illustrate this point, consider the three call graphs shown in Figure 1. The first, S1, 2
corresponds to a standard thread-based system. The application includes a single entry point at X(). The path set for this system is captured by the regular expression, τS1 , which generates 2 possible execution paths. Now consider S2, an event-based system without preemption, with an additional entry point at Y (). Assuming program actions execute atomically with respect to one another, the path set for this system is described by τS2 , which generates 3 possible execution paths. Finally, consider a TinyOS application, S3, in which event Y may preempt event X (denoted by the open circle on the stem). The corresponding path set, captured by τS3 , now includes at least 12 possible execution paths, depending on the preemption policy (i.e., allowable preemption depth, preemption priorities, and reentrancy constraints). Further, the execution paths do not follow naturally from the system call graph. In real systems involving asynchronous message traffic and environment-triggered actions, the path sets are much larger; they can quickly swamp developers’ ability to reason about the behavior of their programs — especially in the “end cases”. The goal of our work is to provide tool support to assist developers in understanding the path sets underlying their systems and the particular paths chosen during each run. We focus on a program visualization approach that supports comprehension activities involving both local and distributed runtime behaviors. Contributions. We present a visualization toolkit for TinyOS 2.0 to aid in program comprehension. This is, to the best of our knowledge, the first toolkit of its kind for any sensor network platform. Three modes of operation are supported. The first is focused on static application structure, and consequently, on potential execution paths. The output in this mode consists of an annotated system call graph corresponding to a user’s source base. The latter —and more interesting— modes of operation focus on dynamic application behavior, and consequently, on actual execution paths. The output in each case is an annotated UML sequence diagram corresponding to the behavior of a single application run. In the first of these dynamic modes, the generated diagrams record local interactions among participating components. In the second, the diagrams capture distributed interactions in a manner that highlights causally-connected events within a network and demarcates regions of logically concurrent activity. The toolkit architecture consists of five components; these components are the focus of this manuscript. First, we describe a full-featured static analysis and instrumentation library implemented in Java for TinyOS 2.0. Second, we describe a system constructed using this library to insert logging probes within a source base to capture the program actions of interest to a developer. Third, we describe a lightweight service for recording TinyOS execution events. Fourth, we describe a tool to extract recorded events across participating nodes and to reconstruct the associated runtime trace(s). Finally, we describe three visualization front-ends corresponding to the static and dynamic views introduced above. We demonstrate the utility of the toolkit using standard network system examples included as part of the TinyOS 2.0 distribution, as well as a custom example involving distributed coordination. We also present a detailed analysis of the toolkit’s resource usage and performance characteristics. Before proceeding, we note that the contributions of this manuscript are presented in the context of the Tmote Sky hardware platform [12]. Each matchbox-sized device consists of an 8Mhz MSP430 microcontroller, 48K of instruction memory (ROM), 10K of data memory (RAM), 1Mb of off-chip EEPROM storage, and a 2.4GHz IEEE 802.15.4 (Zigbee) wireless transceiver. The platform is widely used in academic research and is beginning to gain popularity in the commercial sector. Its hardware profile is representative of other standard platforms for embedded network construction. As we will see, accommodating the severe resource constraints of such platforms is a key component of the contributions. Paper Organization. The remainder of the manuscript is organized as follows: Section 2 surveys some of the most important elements of related work and highlights the novelty of our contributions. Section 3 presents an overview of the TinyOS operating system and the associated nesC programming language. Section 4 details the design and implementation of the visualization toolkit. Section 5 presents use-case scenarios that demonstrate the toolkit’s utility. Section 6 presents an analysis of the toolkit’s performance and associated runtime overhead. Finally, Section 7 concludes with a summary of contributions and pointers to future work.
3
2. Related Work That sensor network systems are difficult to construct and debug is hardly a new observation. While reducing this difficulty continues to be a significant research thrust within the community, our work appears to be the first to consider a program visualization approach. Program visualization does, however, have a rich history in the domain of desktop systems. Here we survey some of the most significant efforts reported in the literature. We conclude with an overview of program comprehension projects specific to sensor network systems. 2.1. Visualizing Local Runtime Behavior Myriad approaches to visualizing local runtime behavior have been explored. A key focus has been the development of visual abstractions that support program comprehension activities involving large trace datasets. Jones et al. [13, 14], for example, focus on scalable abstractions that can be tailored for use across different types of execution data. Their approach provides statement-, file-, and system-level views of a collected dataset based on various coloring schemes applied over three source representations: The first is the source itself. The second is a line plot that mirrors the indentation structure of the source using one row of pixels for each source line, adapted from the SeeSoft system [15]. The third is a “tree-map”, a rectangle subdivided along the horizontal and vertical axes to represent hierarchical relationships, adapted from Shneiderman [16]. (Variations on these representations have since been applied in a range of program comprehension systems; see, for example, [17, 18, 19, 20, 21].) In addition to the coloring techniques applied over these structures, Jones et al. describe mechanisms for filtering and summarizing runtime data across multiple runs. While the utility of the authors’ work has been vetted in a number of contexts, none of the three visual abstractions are well-suited to reasoning about program control flow. Our work, on the other hand, is specialized for this purpose. Hamou-Lhadj et al. [22] similarly focus on large-scale trace datasets. The authors describe an Eclipse plugin that supports interactive exploration of a recorded trace sequence. Each sequence is represented using a standard “tree-view”. The main challenge addressed by the authors is to ensure the intellectual scalability of the view across large datasets. To this end, they describe filtering mechanisms that collapse subtrees automatically based on recurring subtree patterns, depth culling, relaxed call ordering relations, and other tree transformations. A selection-based filtering mechanism is also discussed, similar to the mechanism used in our approach. Their plugin represents one realization of the trace summarization concept originally proposed by Hamou-Lhadj [23]. Cornelissen et al. [24] focus on similar comprehension challenges and also rely on collapsion and expansion mechanisms to achieve scalability, although their visual abstractions are fundamentally different. Each rendered view aggregates trace data using a hierarchical model of program entities (e.g., packages, classes, methods). Their “massive sequence view” portrays a snapshot of the global system trace as a time-ordered sequence of edges among higher-level program entities. Their “circular bundle view” represents calling patterns within a region of the global trace as slots around a circle. Each slot represents a system entity and the edges among them represent aggregated calls, with edge thickness denoting the cardinality of the aggregate. This aggregation approach dates back to Holten [25], who introduced edge bundling as a mechanism for reducing clutter in the context of visualizing inclusion relationships. In contrast to the work of Jones et al., Hamou-Lhadj et al., and Cornelissen et al., our work targets control flow comprehension at a fine-grained level using UML sequence diagrams. Lienhard et al. [26, 27] also focus on trace datasets, but argue for a more object-centric approach. The authors observe that in object-oriented systems, the flow of references has a fundamental impact on execution behavior and program understanding. They present a meta-model for recording runtime trace data that captures reference flow information and use this model as the basis for a trace visualization tool. In their approach, trace data is rendered using a compact tree representation that supports interactive subsequence selection. Selected subsequences are represented using a “side effect view” that aids in understanding the effect of reference changes. The view, similar to a UML object diagram, uses an edge coloring scheme to differentiate between references that existed before the sub-trace was executed, those that are deleted in the sub-trace, and those that are considered side effects. We note that in contrast to object-oriented applications, 4
nesC applications are purely static; all component references are fixed throughout the application’s lifetime. Hence, side-effect analyses of this type are inapplicable. The use of dynamic visualization methods in the object-oriented context dates back to the infancy of the paradigm. Kleyn and Gingrich [28] describe a system for visualizing the structural and behavioral aspects of a system using graphs that are dynamically highlighted and annotated. Each visualization requires two runs of the system under study. During the first run, trace data is collected to initialize the graph. During the second run, trace data is collected to drive the animation. The resulting scenes focus on function activations across various structures (e.g., inheritance hierarchies, containment hierarchies, call graphs). De Pauw et al. [29] describe a similar system, but support a richer set of rendering and animation primitives. Their approach might also be described as more object-centric. The supported views illustrate the degree of interaction among classes, control flow among objects, class activation frequency, object instantiation frequency, and other properties. Beyond the obvious language and platform differences, our work is focused on generating UML Sequence Diagrams. Given the common usage of this notation in many developer communities, our expectation is that the toolset will be more amenable to adoption. Dynamic visualization techniques continue to receive significant attention. Reiss [30] describes a realtime visualization toolkit for Java-based systems. The principal visual abstraction is the “box display”, where each box includes an enclosed rectangle used to represent the state of a given class or thread. Characteristics of the rectangle (e.g., height, width, hue, texture) are mapped to statistics concerning program entities. These statistics include the number of invocations on a given class, time spent in a particular thread state, number of synchronization events executed within the last epoch, and others. The main display includes one box for every thread and class of interest. In [31], Reiss and Renieris extend these concepts to provide finergrained detail at the level of basic blocks. More precisely, the authors describe an approach to relating thread activity to the basic blocks executed during each epoch. The visual abstraction, while more sophisticated, bears similarity to the box display. In this case, each box represents a single file and its internal elements represent basic blocks. Similar property mappings to those already discussed are used to represent the time spent in each block, object allocations performed by each thread, and other statistics. While the work of Reiss and Renieris has proven valuable in revealing high-level patterns of runtime behavior, their work is not well-suited to supporting comprehension activities associated with low-level control flow — our primary focus. Closer to our work is that of Lange and Nakamura [32]. The authors describe a program visualization toolkit for C++ applications that combines static structural information and dynamic trace information to generate object-centric views of program behavior. The toolkit components are similar to ours; they include an instrumentation system, an execution trace recorder, and a program database from which static program information can be retrieved. The generated visual representations include object creation and lifetime graphs, as well as object-centric call graphs. A simple selection interface enables filtering on classes and methods. Malloy and Power [33] describe a similar, but more advanced visualization system for C++ applications. The generated visual representations include class and method call graphs, UML communication diagrams, and UML sequence diagrams. The system additionally includes static and dynamic event filtering —which inspired aspects of our work— and supports dynamic visualization during the execution of a program under test. In contrast to these systems and others designed to reverse-engineer UML sequence diagrams [34, 35], our work targets embedded network applications constructed using TinyOS and nesC. The programming model and associated language are fundamentally different than that provided by C++. Moreover, our approach operates in an asynchronous execution environment under tight resource constraints. We conclude with an interesting direction for future work: Cornelissen et al. [36, 37] describe an approach to reverse-engineering UML sequence diagrams to aid in test suite comprehension. A key component of their work centers on improving the scalability of the generated diagrams by abstracting over irrelevant execution details. The abstraction mechanisms include excluding calls beyond a specified stack depth, merging related objects, omitting constructor calls on unused objects, excluding specified call patterns, and other mechanisms. The authors also explore a metrics-based approach to identifying the most appropriate abstractions for a given execution sequence and then applying the abstractions automatically. While we have not explored the use of such abstractions in our work, they present an interesting opportunity for 5
future exploration. 2.2. Visualizing Distributed Runtime Behavior A range of efforts have focused on visualizing distributed behavior in the context of desktop- and serverclass systems. CORBA systems have received particular attention. Moe and Carr [38], for example, describe an interceptor-based approach to collecting runtime performance data in CORBA systems. This data is aggregated in the form of scatter plots used to identify anomalous execution patterns. A plot comparing execution times across a series of calls could, for instance, be used to identify undesirable execution paths across distributed components. This approach, while well-suited to conveying aggregate data, is not designed to provide insights into low-level calling behaviors — the focus of our work. Li [39] describes a similar instrumentation and visualization framework, but focuses on identifying causal connections among distributed events. Beyond standard probe injection, his approach relies on augmenting remote procedures with additional arguments used to track distributed call chains and thread ownership relations. Each injected probe records the relevant identifiers, call latency data, and statistics concerning resource usage (e.g., CPU utilization, memory usage). Upon termination, the collected data is used to recover the dynamic system call graph. Navigating the graph can reveal deep insights about the causal connections among threads, functions, latency, and resource consumption across a network. While the architecture shares similarities with our design, it does not consider local runtime behaviors (since the associated calls do not pass through CORBA stubs). Further, in contrast to our work, the authors explicitly exclude consideration of asynchronous call chains. A number of visualization frameworks for parallel message-passing environments have been proposed. Nagel et al. [40], for instance, describe a suite of tools for visualizing applications implemented using the MPI model [41]. Trace data is collected for realtime analysis using the standard MPI profiling interface, as well as by custom probes specified by the developer. The generated views focus primarily on the percent of time spent at each participating node on a given set of tasks; both static snapshots and dynamic animations are provided. More interesting is the “timeline” view which depicts the message exchanges among MPI nodes. Similar to the work of Li, the system described by Nagel et al. does not provide detailed call sequence information for local processing tasks. The visual abstractions are also dissimilar to ours, which target UML users. Wu et al. [42] similarly target applications executing on SMP clusters. Their visualization approach relies on “time-space plots” to summarize collected trace data over a specified time window. In this format, time is measured on the vertical axis; the units on the horizontal axis vary. Memory consumption might, for instance, be measured on this axis to depict the memory profiles of various processes over time. A significant contribution of their work is a clock synchronization technique used to correlate distributed events. As we will later see, our approach avoids the use of synchronized clocks (and timestamps) due to the severe resource constraints of the target platforms. Topol et al. [43] present a similar, but more sophisticated visualization environment for cluster-based systems. A broad set of realtime and postmortem views are provided. Although there is support for depicting the message exchanges among nodes, the views focus primarily on resource consumption and other performance characteristics. By contrast, our work differs in its emphasis on source-level program understanding. Closest to our work is that of Briand et al. [35]; the project goals are similar: Their objective is to generate UML sequence diagrams that capture the runtime behavior of distributed systems constructed using Java RMI1 . The approach is to project the global trace sequence collected during a run onto a single local sequence diagram. The name of each participating object is prefixed with an identifier that indicates its host address. Method invocations across distributed objects are then represented using standard sequence diagram notations. We follow a similar convention in our approach, but with several important differences: First, we provide interactive linking among causally connected events to reduce the cognitive burden associated with large datasets. Second, we automatically identify (and colocate) regions of logically concurrent 1 The
authors present an excellent survey of similar tools.
6
activity across distributed participants2 . Finally, our system targets resource-constrained sensor nodes and captures activity with interrupt granularity. In [44], we describe a program visualization testbed for sensor network systems. The work presented here leverages aspects of that system. We have not, however, previously considered local projections of distributed behavior, nor the automatic identification of logically concurrent activity regions. Consequently, the corresponding visual abstractions described here are new. 2.3. Sensor Network Development and Debugging While program visualization techniques have received little attention in the sensor networks community, a number of efforts have focused on assisting sensor network developers. Several authors have, for example, described techniques for detecting and localizing software faults in sensor networks. Ramanathan et al. [45] present an approach based on comparisons between actual and expected network traffic patterns. While helpful in identifying node-level fault candidates, the approach does not aid in identifying source-level problems. In contrast, Krunic et al. [46] focus on providing source-level assistance. The authors describe a diagnostic system designed to trap program faults before they can disable the hosting device. The system includes a network interface for collecting context information related to a fault, including runtime trace information. Our approach to encoding trace information using numeric tokens is similar to the approach discussed in [46]. Improving runtime visibility has been another important focus in the literature. Tolle and Culler [47] describe a network management system that enables developers to expose attributes as part of a program implementation. Attributes are encoded manually and can be read and written across a network at runtime from a basestation. The system additionally provides the ability to log events at manual instrumentation points and to exfiltrate log data for later analysis. Again, the event encoding approach is similar to ours. Whitehouse et al. [48] extend this work; they describe a system for accessing program state without the need for manual attribute encoding. The toolkit additionally provides remote procedure call capabilities from a basestation to a network node. In [49, 50], we describe a sensor network testbed that leverages the work of Tolle and Culler to provide state visibility across a test network. The system also provides automated exfiltration and interpretation of network message streams. While these systems have proven useful in improving runtime visibility, they provide little insight into the path sets underlying a system or the particular paths chosen during a run — the focus of our work. Finally, it is worth noting that a number of groups have recently released development environments for TinyOS [51, 52, 53]. The environments include a subset of the features found in standard development environments, including syntax highlighting, automated code completion, compilation support, etc. The environments additionally provide support for visualizing the static structure of TinyOS applications. The representations range from simple hierarchical component views to more detailed representations of component bindings and call graph structure. The tools do not, however, support visualization of dynamic program behavior. 3. Background: TinyOS and nesC TinyOS applications are implemented in nesC [54, 55], a component-based dialect of the C programming language. Applications are constructed by composing application-specific components with general-purpose components provided by the operating system (e.g., timers, device drivers, network protocols). Here we summarize the basic language constructs and execution model. We omit some advanced language features (e.g., generic programming, parameterized interfaces, single function wirings), but note that these features are supported by the visualization toolkit. In nesC, the basic programming abstraction is the component3 , which bears some similarity to a class. Components encapsulate state and behavior and expose this behavior through interfaces. An interface 2 Two events e1 and e2 are logically concurrent if there is no causal connection between them. While e1 and e2 need not occur at the same instant in a given run, they could occur at the same instant in some run. 3 For the sake of presentation, we use the term component only in reference to nesC modules.
7
consists of command and event declarations. A command is analogous to a class method; it is a function that can be invoked on a providing component. In contrast, an event is a function invoked by a providing component. An event declaration specifies the signature of the handler that will be invoked when the event is signaled. For example, Timer.fired() specifies the signature of the handler invoked when an underlying timer event is signaled. Notice that commands impose an implementation responsibility on providing components, whereas events impose an obligation on using components. In addition to exposing public behavior, components may implement private behavior. Private behavior is realized by functions accessible only from within the declaring component. A component may include standard C style functions, as well as one or more tasks. A task is a special type of function posted for later execution. One of the most interesting characteristics of nesC is that it enforces loose component coupling. The language does not allow a component to explicitly name the target of a command or event invocation. Instead, all invocations must flow through interfaces, without naming the components that provide those interfaces. Hence, components not only specify the interfaces they provide, but the interfaces they use. Interface dependencies are resolved by configurations that wire interface users to interface providers. Control flow originates from one of two sources. The first source is the TinyOS task scheduler. Call chains originating from the scheduler are said to execute in a synchronous context. By default, the scheduler executes tasks —which may invoke commands and signal events— in the order in which they were posted. Each task executes to completion before the next task is scheduled. Interrupts provide the second source of control flow. Call chains originating from an interrupt are said to execute in an asynchronous context. An asynchronous call chain may preempt a synchronous call chain, or even preempt an active asynchronous chain. Commands and events executed along an asynchronous chain typically require special logic to prevent race conditions, whereas synchronous call chains typically do not. To enable the compiler to distinguish between the two, commands and events callable from an asynchronous context include the async keyword as part of their signature. These asynchronous functions are prohibited from calling synchronous functions since the latter are not equipped to handle (logical) concurrency4 . We will see that this rule has important implications for the toolkit. 3.1. Example: Blink To make these concepts more concrete, consider a variant of the Blink application included as part of the TinyOS distribution and detailed in the accompanying tutorial [56]. The application serves as the “Hello World!” equivalent in the embedded domain: When installed, it instructs the hosting device to toggle its red LED once a second. At the core of the implementation is a timer component that provides the interface shown in Listing 1. Listing 1: The Timer Interface 1 2 3 4 5 6 7
interface Timer { command void startPeriodic(uint32_t dt); command void startOneShot(uint32_t dt); command void stop(); event void fired(); ... omitted ... }
Timer is a generic interface parameterized by precision tag (line 1); the value of the parameter indicates the precision of the providing component (e.g., milliseconds, microseconds). The interface declares three commands: The first is used to start a timer that fires repeatedly every dt time units (line 2). The second is used to start a timer that fires once, after an initial delay of dt time units (line 3). (The precise meaning of dt in each case depends on the precision tag parameter.) The third command is used to stop an active timer (line 4). Finally, the interface defines the fired() event, signaled when the underlying timer fires (line 5).
4 This rule is not strictly enforced; violations are treated as warnings. Violations are, however, considered to be dangerous and rarely occur in deployed systems. We ignore this possibility in the design of our toolkit.
8
Listing 2: The BlinkC Module 1 2 3 4 5 6 7 8 9 10 11 12 13 14 15
module BlinkC { uses { interface Boot; interface Leds; interface Timer as BlinkTimer; } } implementation { event void Boot.booted() { call BlinkTimer.startPeriodic(1000); } event void BlinkTimer.fired() { call Leds.led0Toggle(); } }
The main “body” of the Blink application is implemented by BlinkC, shown in Listing 2. The component declares three used interfaces (lines 3–5): The first, Boot, defines an event signaled once at system startup. The second, Leds, provides commands for controlling the LEDs of the hosting device. (The Tmote Sky platform provides three LEDs.) The third is the instantiated Timer interface, locally renamed to BlinkTimer; TMilli indicates millisecond precision. No interfaces are provided by BlinkC since it is the “top-level” application component. The implementation portion of the component includes two event handlers, corresponding to the events declared by its used interfaces. The booted() handler, signaled through Boot, consists of a single command call to initiate a periodic timer (lines 9–11). As a result, the timer will signal a fired() event every 1000 milliseconds. The corresponding fired() handler toggles the state of the red LED from on to off and viceversa (lines 12–14). In general, command and event (handler) implementations consist of C-style code with interspersed command calls and event signals. Listing 3: The Blink Configuration 1
configuration Blink {}
2 3 4 5
implementation { components MainC, LedsC, BlinkC; components new TimerMilliC() as BlinkTimerC;
6
BlinkC.Boot -> MainC.Boot; BlinkC.Leds -> LedsC.Leds; BlinkC -> BlinkTimerC;
7 8 9 10
}
The configuration used to resolve the interface dependencies in BlinkC is shown in Listing 3. Blink begins with a declaration of the components to be assembled (lines 4–5). The first, MainC, implements the main entry point for every TinyOS application; it provides the Boot interface. The second, LedsC, provides a basic LED driver. The third, BlinkC (discussed above), implements the main application logic. Finally, the instantiated generic component TimerMilliC, locally renamed to BlinkTimerC, provides the Timer interface. The remainder of the configuration consists of wiring statements that bind interface users to interface providers. The first statement binds the Boot interface used by BlinkC to the Boot interface provided by MainC (line 7). Hence, the boot() event signaled at startup will be dispatched to the BlinkC handler. The second statement is similar, binding the Leds interface to the LED driver (line 8). Finally, the BlinkTimer interface used by BlinkC is bound to the Timer interface provided by BlinkTimerC. The interface names have been omitted; they will be inferred automatically by the compiler. Before concluding this section, it is worth noting that multiple components may be bound to the same used interface. In the example above, for instance, the BlinkTimer interface used by BlinkC could be bound to a second timer component by introducing a fourth wiring statement. Invocations through the interface 9
nesC source (original)
nesC source
nesC source
(mod. 1)
(mod. 2)
probe selection, insertion
analysis, instantiation source metadata
execution
compilation image
trace
symbol map filtered trace
trace filtering
visualization
trace trace extraction, reconstruct.
(CG)
visualization
visualization
(SD Local)
(SD Distributed)
message map
Figure 2: Visualization Process Overview
would be dispatched to all providing modules automatically. This type of “fan-out” further complicates the already difficult task of reasoning about the path sets underlying TinyOS applications. 4. Visualization Toolkit We now turn our attention to the design and implementation of the visualization toolkit. The steps involved in visualizing the behavior of an application are summarized in Figure 2. The first step is to parse and transform the source base of the system under test. There are two outputs associated with this step. The first is an instantiated source base free of generic types. This instantiation process is critical to later visualization tasks; it enables individual component instances to be traced at runtime, improving the achievable visualization granularity. The second output is a collection of metadata captured during the parse; it records all program symbols and all calling relationships among components and functions. In the simple case, this metadata can be used to generate an annotated call graph for the system under test. In the more interesting case, the metadata is used as input to a second step, in which a developer selects a set of functions to be traced. The selected functions are used to guide the insertion of logging probes that record enter and exit events on the functions of interest. If distributed behavior is targeted, radio transmission and reception functions are automatically selected for instrumentation. The output of the selection step is an instrumented source base and a symbol map that associates numeric identifiers with the selected program symbols. These identifiers are used in place of the symbol names during the tracing process to accommodate the storage limitations of typical hardware platforms. The instrumented system is then compiled and executed on one or more devices. After execution, the resulting trace data is collected from each participating device. The data is then reconstructed using the symbol map to substitute symbol names for the numeric identifiers stored in the trace. Optionally, the reconstructed trace may be filtered to select a region of interest or to remove trace events associated with particular functions. (This step is typically applied as part of an iterative exploration process.) If there are multiple participating devices, a message map is generated to map each recorded send() event to its corresponding receive() event using message data introduced by the logging probes. Each reconstructed trace can be used to generate a corresponding sequence diagram that describes the local run. Alternatively, a subset of the traces may be used, along with the corresponding message map, to generate a sequence diagram that captures the system’s global behavior. The individual components of the toolkit that enable this process are described in the following subsections. 4.1. nesC Analysis and Instrumentation Library The visualization toolkit is implemented using the nesC Analysis and Instrumentation Library (A&I Library), a general-purpose Java API for parsing, analyzing, instrumenting, and generating nesC source code. 10
Type Traversal Generation Modification
Method Name getNodesOfType(), getParent(), · · · generateExprStmt(), generateEnum(), · · · addComponentToConfig(), instantiateGenerics(), · · ·
Table 1: Analysis and Instrumentation Library Methods (partial)
The full nesC grammar is supported, as implemented by version 1.2.7a of the nesC compiler. Although the visualization toolkit is among the first applications to use the library, the API is designed to enable a broad class of program analysis and instrumentation tools. We believe that the library provides a foundation for expanding software engineering and programming languages research in the context of TinyOS. We present an overview of the library’s functionality, referring the reader to [57] for a more complete treatment. The most fundamental feature provided by the API is the ability to parse a nesC source base. While it is possible to process individual files, many applications benefit from a configuration-based parse: The API provides a method to initiate a parse from a specified configuration. The method accepts the configuration path as argument and a list of search paths used to locate dependent components identified during the parse. The result is a set of abstract syntax trees (ASTs) corresponding to the translation units processed during the parse. The AST classes provide standard accessor methods and are designed according to the Visitor pattern [58]. Hence, the trees can be processed using either mechanism. Alternatively, the API provides a set of convenience methods to simplify the most common tasks. A small sample of the methods provided by the library are included in Table 1. The table is divided into three sections corresponding to the three basic types of methods provided by the API. The first section lists two example traversal methods. getNodesOfType() returns a collection of nodes that satisfy a given type specification based on a full traversal of the AST rooted at the invocation target. This method is useful, for example, in identifying the modules referenced by a configuration. The getParent() method has the obvious meaning and is useful in discovering the containing context associated with nodes returned by getNodesOfType(). The second section lists two example code generation methods (or “partial parsers”). generateExprStmt() accepts an arbitrary nesC expression as argument (in string form) and returns the corresponding AST. This method is useful, for example, in generating the probes inserted to capture runtime trace data. generateEnum() is similar; the method is used to generate enum declarations. The method is used by the toolkit to introduce unique identifiers for instrumented modules. The final section lists two example code modification methods. addComponentToConfig() introduces a new component reference into an existing configuration. This is useful, for example, in injecting the recording service required to capture trace information. The second method, instantiateGenerics(), is among the most complex operations provided by the API. The method transforms a set of ASTs to eliminate generic components and generic configurations. The approach is to duplicate the generic types by substituting actual arguments for formal generic parameters. The instantiated components are automatically renamed to include a unique integer tag to prevent collisions. All component references are updated to reflect the new names. This method has proven extremely valuable in developing the visualization toolkit, where component instances must be differentiated and instrumented separately. 4.2. Probe Selector From a user’s perspective, the Probe Selector —or simply Selector— is the first application in the visualization tool chain. The Selector expects the top-level configuration of the target application to be passed as argument. On startup, the A&I Library is used to parse the input system and to generate a listing of the components it defines, as well as the associated commands, events, tasks, and functions. This list is presented to the user, who then selects the program actions to be included in the visualization. 11
When the desired actions have been selected, the A&I Library is used to apply three system transformations. First, the source base is instantiated to eliminate generic components and generic configurations. This step is required to enable users to differentiate control flow across instances of the same generic component. If, for example, a system includes two instances of TimerMilliC, the instantiation process will create two new components, each suitably renamed, by instantiating TimerMilliC. Metadata describing the program symbols and function calling relationships is stored for later use in generating an annotated call graph. Listing 4: Command dequeue() Prior to Transformation 1 2 3 4
command message_t *MessageQueue.dequeue() { uint8_t size = call Queue.size(); ... return Queue.dequeue(); }
Listing 5: Command dequeue() After Transformation 1 2 3 4 5 6 7 8 9
command message_t *MessageQueue.dequeue() { call Trace.enter(instanceId, 1); { uint8_t size = call Queue.size(); ... return ({ message_t *nesctk_return; nesctk_return = Queue.dequeue(); call Trace.exit(instanceId, 1); nesctk_return; }); } }
The second transformation involves injecting logging probes at the entry and exit points of the selected actions. The basic instrumentation procedure is illustrated by the code fragments shown in Listings 4 and 5. The first listing shows the partial implementation of the dequeue() command declared by the MessageQueue interface. The second shows the corresponding code after the instrumentation procedure has been applied. The body of each instrumented action is wrapped within an anonymous block, and the enter event is recorded before the block. This allows probes to be injected before variable declarations, which may involve function calls if the variables are initialized. Similarly, each exit point is wrapped within a statement-expression to capture exit events before the action terminates. In general, multiple exit points may need to be instrumented. Note that each probe records the instanceId used to identify the containing component. This identifier is introduced as a module-level enumeration constant during the instrumentation process. Also note that a second constant is used to identify the containing action. The generated constants are mapped to the corresponding signatures and exported as a symbol map for later use in reconstructing a recorded trace. It is worth noting that the underlying storage structure used to log program events is generated dynamically. This is done to minimize the number of bits required to uniquely identify the selected modules and actions. The final transformation is only applied when tracing distributed behavior. First, the TinyOS functions used to transmit and receive radio messages are instrumented according to the procedure described above. In addition, a custom version of the TinyOS radio stack is linked into the target application. The modifications introduced in the stack are minimal: First, the radio message structure is augmented to include fields for the address of the sending node and a corresponding message sequence number. These values are added automatically to each message as part of the transmission process. At the point of reception, these values are stored as part of the corresponding trace entry. Later, these values are used to map each transmission event to its corresponding reception event as part of the message map generation process. 4.3. Event Recording Service The Event Recording Service is implemented as a single component, TraceRecorderC, which serves as a thin wrapper over the standard log storage component provided by TinyOS (LogStorageC). The component provides a simple interface, Trace, which defines commands to log entry and exit events. Special commands are provided to log events associated with message transmission and reception. These commands are responsible for storing the source of the transmission and the associated message sequence number. 12
Internally, the component implements a dual buffering strategy: A current buffer is used to cache program events logged to the trace. When the current buffer becomes full, the second buffer is swapped into its place while the first buffer is flushed to persistent storage. This process occurs in parallel with the main application logic, thereby limiting its impact on application performance. This cyclic process repeats to prevent missed events during log storage updates. We note that in our testing of TraceRecorderC, 70 entries of 3 bytes each is close to the maximum buffer size that can be consistently written to log storage without bit errors. While the source of these errors is unconfirmed, they appear to originate due to a flaw in the underlying TinyOS log storage implementation. 4.4. Trace Extractor / Collector After a run, the trace data must be extracted from participating nodes and reconstructed for use in generating the corresponding sequence diagrams. This is achieved by installing a new application image on each device. The installation process may be performed manually or through the use of an automation service. See, for example, the testbed-based approach described in [44]. In either case, the Trace Extractor application retrieves the captured data from log storage and transmits the data to an attached basestation. The Trace Collector is used at the basestation to receive the transmitted data and to reconstruct the trace. Reconstruction involves mapping the module and action identifiers stored within the trace back to the corresponding module names and action signatures. This is done using the symbol map generated by the Selector. Finally, if the user is interested in visualizing distributed behavior, the Trace Collector is responsible for producing the message map used to associate transmission and reception events. It is constructed by locating, for each transmission record, the reception record that contains a source address and sequence number that match those stored in the transmission record. Both the reconstructed traces and the message map are saved for later use in generating sequence diagrams. 4.5. Call Graph Generator The Call Graph Generator is used to visualize an application’s static call graph. The interface is similar to that of the Selector. At startup, the A&I Library is used to perform a full parse of the target application based on the top-level configuration passed as argument. The user is then prompted to select the program actions of interest. This selection step is designed to focus the generated graph on a manageable subset of program actions — introduced after our initial experiences visualizing call graphs with thousands of actions. The generated graph includes the selected actions, actions that invoke the selected actions, and actions invoked by the selected actions. As we will see, this mechanism provides an effective means of limiting the scope of the graph while retaining suitable detail to reason about the actions of interest. 4.6. Local Sequence Diagram Generator The Local Sequence Diagram Generator is used to transform a reconstructed trace into a sequence diagram that captures the associated local behavior. Before applying the tool, however, it may be necessary to filter the reconstructed data. A single trace, even recorded over a short time span, may contain tens or even hundreds of thousands of events. The resulting sequence diagram would be overwhelming. Hence, the toolkit includes a simple filtering tool that allows developers to generate a partial trace by selecting a segment of the total trace and/or removing events associated with particular actions. As we will later see, this tool can be used to support cyclic exploration processes. The diagram generated for a given trace follows standard UML conventions, with minor adaptations to suit the semantics of nesC. The object rectangles that traditionally appear at the top of the diagram are used to represent component instances. The activation rectangles running vertically have the usual meaning; they represent activations of the corresponding component. Solid arrows between activations represent invocations, and dashed arrows represent returns. It is important to note that edges capture transitive invocation relationships. A call chain from action A() to B() to C() will be represented by an edge from A() to C() if B() is outside the instrumentation set of the system under test. To distinguish between commands, events, tasks, and module functions, we use the coloring scheme summarized in Table 2. Orange, purple, blue, and green activation rectangles are associated with commands, events, tasks, and module functions, respectively. Similarly, to enable users to distinguish between 13
Type Activations
Calls / Returns
Color Orange Purple Blue Green Black Red Blue
Meaning Commands Events Tasks Module functions Synchronous Asynchronous Module functions
Table 2: Sequence Diagram Coloring Scheme
synchronous and asynchronous actions, we use an edge coloring scheme. Black and red edges are used to represent calls to synchronous and asynchronous actions, respectively. Blue edges are used to represent calls to local functions, which can be invoked from either a synchronous or asynchronous context. (Note that edge colors are assigned based on static signature data; determining the runtime context of a call typically requires probes outside the system’s instrumentation set.) We will see that this approach improves the utility of the sequence diagram notation in supporting developers’ understanding of system behavior. 4.7. Distributed Sequence Diagram Generator The design of the Distributed Sequence Diagram Generator parallels that of the local version, including the trace filtering mechanism, but includes support for representing behaviors that span multiple input traces. The visualization approach is to project distributed components onto a single local diagram. The generated diagram includes a component rectangle for each of the participating component instances. In each case, the component name is prefixed with the address of the hosting device. Behaviors local to a host are represented using the same conventions described above. Three enhancements are applied to depict distributed interactions and to assist developers in reasoning about the causal connections among events. The first and most basic of these enhancements is the addition of special markers on the activation bars of relevant components to depict transmission and reception events. A transmission event is depicted as a small “closed-envelope” icon. Reception events are similarly depicted, but use “open-envelope” icons. The second enhancement supports interactive exploration of the message exchanges among nodes. When a user clicks a transmission icon, a small popup list of the associated recipients is displayed. The display does not disambiguate unicast versus broadcast; however, only those recipients that actually received a given message are displayed. This provides immediate feedback regarding the impact of packet loss — a common occurrence in low-power wireless networks. Further, by selecting one of the recipients, an orange line is added to the display to connect the transmission event to the corresponding reception event. Traversing this line leads to the corresponding point on the recipient’s activation rectangle. Additional transmission lines can be added to the display using the same process and a simple clear button is used to remove the lines if the display becomes cumbersome. In this way, developers can explore selected interaction sequences across a network without being overwhelmed by all of the interaction sequences. The final enhancement is perhaps the most interesting. The objective is to highlight distributed action sequences that are logically concurrent. We adopt the definition of logical concurrency based on the happens before relation, as developed by Lamport [59]. The relation is intended to represent causal connections among events. In short, an event e1 is said to happen before e2 if e1 precedes e2 in the same local trace, or e1 and e2 are corresponding transmission and reception events; the relation is transitive. Two events are considered to be logically concurrent if there is no causal connection between them. Or more formally, events e1 and e2 are logically concurrent if neither event happened before the other. Highlighting logical concurrency is important for two reasons. First, it limits the set of interaction paths that must be considered to reason faithfully about a distributed computation. Second, if two events are logically concurrent, they need not occur at the same instant in the given run — but they could occur at the same instant in some future run. 14
X()
S()
D()
Y()
P
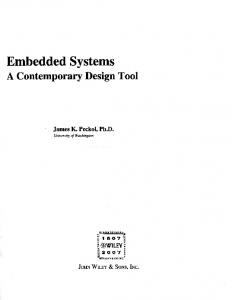
Figure 3: Call Graph for P
The visualization approach is based on a partitioning strategy that collocates, along the vertical axis, activity sequences that are logically concurrent. Collocating these sequences along the same segment of the timeline emphasizes that they may have occurred at the same instant. Consider a computation involving three nodes. Upon termination, three trace sequences will be collected, τ1 , τ2 , and τ3 . The partitioning process segments each trace into an equal number of subsequences such that5 : τ1 = τ11 ∗ τ12 ∗ ... ∗ τ1n τ2 = τ21 ∗ τ22 ∗ ... ∗ τ2n τ3 = τ31 ∗ τ32 ∗ ... ∗ τ3n The sequence partitioning is subject to two key requirements. First, for each subsequence τij , every constituent action must be logically concurrent with respect to the actions contained in the corresponding subsequences τkj for each node k. That is, the set of subsequences at position j must be logically concurrent subsequences6 . Second, the subsequences must be maximal in the sense that no additional actions could be included while preserving the concurrency requirement. In this way, the longest subsequences of activity that are logically concurrent are batched at the same position. Note, however, that the subsequences at position j need not be of uniform length; indeed, some may be empty. When rendering the corresponding diagram, all subsequences at position j span the same vertical space on the timeline. Horizontal bars are also included to demarcate subsequence regions. In this way, if two actions are on either side of a horizontal bar, there may be a causal connection. If they are within the same bounded region, there is no causal connection between them. We will see that this approach highlights interesting distributed phenomenon in a straightforward manner. 4.7.1. Callers, Callees, and Visualization Uncertainty It is useful to consider the rules used to associate callers and callees, and to describe an interesting limitation that arises as a result of these rules. Specifically, the rules inject a degree of uncertainty in the generated sequence diagrams: There are cases in which a sequence diagram may not precisely reflect a system’s runtime behavior. To understand the source of this uncertainty and to gauge its impact on the usability of the toolkit, it is best to consider an example. Consider a program P , for which some subset of the program actions will be instrumented and traced. We refer to this set as the instrumentation set of P . A portion of the call graph for P is shown in Figure 3. 5 We
use the ∗ operator to denote concatenation. subsequences τij and τkj are logically concurrent if and only if there are no transmission events in τij with corresponding receive events in τkj . 6 Two
15
Each circle represents a program action; shaded circles denote actions in the instrumentation set. Without loss of generality, assume that S() is the closest instrumented action between S() and D(). Now consider generating a sequence diagram based on a trace of P . In particular, consider an element of the trace, Db , corresponding to an enter event on action D(). The basic visualization task is to determine which action invoked D() — either directly, or through a call chain outside the instrumentation set of P . It is important to observe that a simple projection of the runtime stack at Db can be constructed by tracing the enter and exit events recorded on the trace. The projection includes (conceptual) activation records only for those actions in the instrumentation set. There are two cases to consider. First assume that D() is a synchronous action. In this case, the visualization assigns the topmost synchronous action on the runtime stack at Db as D()’s caller. Assume that this action is S(). To see why this assignment is correct, recall that TinyOS prohibits asynchronous actions from invoking synchronous actions. Hence, any call chain flowing through D() must have originated from a synchronous context. Similarly, since S() may invoke D() (according to the system call graph), S() must also be synchronous, and the activation of S() on the runtime stack must have originated from a synchronous context. Since a synchronous flow cannot preempt another synchronous flow, the call chain leading to D() must have come from S(). If S() were not active (i.e., there were no synchronous actions on the runtime stack at Db ) the call chain that led to D() did not pass through any of the actions in the instrumentation set. In this case, the generic System action is assigned as the caller. Now assume that D() is asynchronous7 . In this case, the path to D() may have come from either a synchronous or asynchronous context. In assigning a caller to D(), the system again examines the runtime stack at Db , excluding actions that could not have lead to D(). If there are no suitable candidates, the System action is assigned as D()’s caller. Otherwise, the topmost candidate —synchronous or asynchronous— is selected; assume that this action is S(). In some cases, this assignment is incorrect. Under what conditions could S() be the topmost action on the runtime stack (at Db ) according to the captured trace, but not be responsible for the call to D()? There is only one possibility: The execution path through S() must have been interrupted by a new call chain that reached D(). This chain must satisfy two key properties. First, it must have originated from an asynchronous context since synchronous paths are non-preemptive. Second, it must flow along an uninstrumented path in P ; otherwise S() would not be the topmost candidate recorded on the captured trace. Again consider Figure 3. An asynchronous flow through Y() to D() could interrupt a call chain from S() to D(). The visualization system would incorrectly associate the first call to D() with S(), and the second call to D() with Y(). Note that this association error would not occur if a preemptive path through X() reached D() since X() is included in the instrumentation set of P . Hence, in general, an association error will occur if an asynchronous flow reaches an asynchronous action that is reachable from the topmost action reflected on the recorded trace. The frequency of association errors depends on the application under test, as well as the corresponding instrumentation set. In practice, however, the occurrence rate seems likely to be rare. The risk can also be reduced by introducing additional instrumentation points to disambiguate asynchronous call chains. Still, a limited degree of uncertainty exists, and it would be preferable to reduce or eliminate it. We will return to this point in Section 7 when considering future research directions. 5. Use-Case Scenarios At this point it is useful to consider three scenarios that illustrate the use of the toolkit and the benefits that it provides. The first two scenarios involve standard application examples included as part of the TinyOS 2.0 distribution: Blink and RadioCountToLeds. The third example, BarrierSync, involves a custom application involving distributed coordination. As we will see, despite their lack of surface complexity, these applications are rich with interesting behavior. We conclude by examining the representativeness of the use-case scenarios and discuss the scalability of the toolkit.
16
Figure 4: Call Graph Generator
Figure 5: Probe Selector
5.1. Scenario 1: Blink The scenario begins with a developer interested in investigating the timing behavior of Blink, discussed in Section 3.1. As a starting point, she may choose to view the system call graph by invoking the Call Graph Generator, passing the top-level configuration file, BlinkAppC.nc, as argument. After selecting VirtualizeTimerC.fireTimers() as the focal point of the visualization, the view shown in Figure 4 is displayed. At a glance, the developer might take an interest in the fact that all system timers are being dispatched from fireTimers(). To investigate this behavior further, she may choose to visualize the execution of Blink. She first selects the program actions to be traced using the Probe Selector shown in Figure 5, again passing BlinkAppC.nc as argument. In the figure, she has already selected several actions. When the selection process is complete, the instrumented source base is generated and the corresponding symbol map is exported for later use. The system is then compiled and installed. To collect the resulting data, the Trace Extractor is installed on the target device. At the same time, the Trace Collector is executed on the developer’s desktop to receive the data transmitted by the target. After all of the data has been received, the application reconstructs the runtime trace using the symbol map passed as argument. After the complete trace has been assembled, the developer selects a subsequence to be visualized. Finally, the selected subsequence is passed to the Local Sequence Diagram Generator to produce the diagram shown in Figure 68 . The diagram captures a canonical example of device virtualization in TinyOS. The first execution sequence begins with an asynchronous event, Alarm.fired(), signaled on AlarmToTimerC. The event originates from an actual clock source, designated as System since the signaling action is outside the instrumentation set of Blink. This event posts a task, fired(), which is the next action executed in the sequence. The task signals TimerFrom.fired() on VirtualizeTimerC, which in turn invokes a local dispatching function, fireTimers(). The dispatching function signals fired() on all pending virtual timer instances. Finally, these events trigger the main BlinkC module to invoke LED toggle functions on LedsP. In the first series of 7 We 8 All
include module-level functions in this set since they may be invoked from an asynchronous context. figures have been trimmed and condensed for the sake of presentation. Solid horizontal breaks denote event omissions.
17
18 Figure 6: Sequence Diagram for Blink
program actions, all the virtual timers used by Blink are pending, so each fired() event is signaled. In the second series, only two of the virtual timers are pending (i.e., Timer1 and Timer0); hence there are only two fired() events reflected in the diagram. We note that it can be difficult to reason about the behavior of a virtualized device based on manual inspection of the program source code. By contrast, the behavior is clear from the sequence diagram. The third execution sequence is also interesting and reveals a minor modification of Blink introduced for testing purposes. Specifically, Blink was modified to include an asynchronous event triggered when the user button is clicked on the hosting device. As shown in the diagram, this event interrupted the (synchronous) Timer3.fired() event. While the example is obviously contrived, it is representative of a larger class of behaviors — behaviors that can be difficult to understand without a visualization tool. 5.2. Scenario 2: RadioCountToLeds The second scenario is focused on a developer interested in the runtime behavior of RadioCountToLeds. We omit the individual steps in the visualization process and skip to the generated sequence diagram shown in Figure 7. Once again the generated diagram captures interesting behavior that could otherwise be difficult to understand. In particular, the diagram illustrates active message filtering and dispatch in the CC2420 radio stack. Three call chains are captured, each triggered by the receipt of a message. Each chain begins with the execution of receiveDone task(), a task implemented by CC2420ReceiveP. This task is responsible for populating elements of the message header before signaling the SubReceive.receive() event on UniqueReceiveP. Within UniqueReceiveP, hasSeen() is invoked to determine if the message is a duplicate of a previous message. The behavior illustrated in the figure indicates that the received messages were not duplicates; SubReceive.receive() is consequently signaled on CC2420ActiveMessageP in each chain. This event is responsible for filtering messages based on the destination address and performing dispatch based on the active message identifier within the message. AMPacket.isForMe() is invoked to determine whether the message is addressed to the hosting node (or intended for all nodes). In the first call chain, the message is intended for the hosting device, and Receive.receive() is signaled on RadioCountToLedsC, which updates the state of the host’s LEDs based on the content of the message. In the second call chain, AMPacket.isForMe() returns false, and the message is silently discarded. In the final call chain, the message is intended for the hosting device, but the specified active message identifier does not have an associated handler within the application. In this case, the default handler defined in CC2420ActiveMessageP is executed. We note that an earlier version of this diagram helped us to resolve errors in our own understanding of the radio stack’s behavior. Specifically, we were unaware of the automatic address filtering performed by the CC2420 radio chip. This behavior is immediately obvious from the sequence diagram generated when address recognition is enabled on the radio chip. This feature was disabled to generate the diagram shown in Figure 7.
19
Figure 7: Sequence Diagram for RadioCountToLeds
20
5.3. Scenario 3: BarrierSync The third scenario centers on BarrierSync, a custom application that implements a standard distributed coordination protocol — namely, barrier synchronization. Each of the participating nodes periodically block at a barrier point. The critical protocol requirement is that each node must wait at the barrier until all other nodes have reached the same point. The implementation relies on a simple messaging strategy where each node broadcasts its arrival at the barrier and blocks until it has heard from all other network nodes. This process then repeats. For the sake of presentation, the protocol is implemented using a reliable messaging layer that ensures message delivery. The test system consists of five participating nodes, but only three are included in the visualization. We again omit the individual visualization steps and skip to the generated sequence diagram. Due to the height of the diagram, it has been split between Figures 8 and 9. The component labels at the top of the diagram indicate that it captures activity across three nodes (i.e., Mote 0, Mote 1, and Mote 2). The blue horizontal lines at the top and bottom of the diagram denote a subsequence break. Hence, the activity sequences at each node are logically concurrent. Or stated another way, there are no causal connections among the participating nodes at this point in the execution sequence. This pattern of activity is repeated with little variation for the lifetime of the network. A more detailed examination of the display reveals that each subsequence in the diagram begins with the receipt of a message, as indicated by the open-envelope icons. This matches our intuition since the reception of a message demarcates a causal connection between two nodes. When this barrier arrival message is received, the Receive.receive() event is signaled on BarrierSyncP, which in turn updates its message tally and invokes the private function checkAndFireTimer(). This function is responsible for determining whether a node can cross the barrier. At the first node, this function immediately returns true, indicating that the last message received completed the tally; the node may cross the barrier. In response, Receive.receive() starts a new timer to simulate processing before the node again reaches the barrier, as signaled by Timer.fired(). At this point, the node transmits barrier arrival messages in sequence to each of its neighbors, as indicated by the closed-envelope icons. It then repeats the process of waiting to complete its tally. The subsequences corresponding to the second two nodes are similar. The only substantive difference is that each node requires two barrier arrival messages before passing the initial barrier. The remaining details are clear from the figure. This basic pattern of activity repeats indefinitely. The only variation is in the placement of the subsequence breaks, which change in each round due to the non-determinism associated with message transmission and delivery. We note that orange lines are added to the display to connect corresponding transmission and reception events whenever the user clicks an envelope icon. The clear button at the bottom of the frame is used to remove these lines if the display becomes too cumbersome. We omit an additional screenshot for the sake of brevity. While the scenario is focused on a simple application, it illustrates the potential of the toolkit: The local projection approach provides a straightforward view of the network’s global behavior. Demarcating regions of logical concurrency further clarifies network behavior, drawing attention to key system execution points. Finally, the icon-based traversal strategy makes it easy for developers to trace interaction sequences that span distributed nodes and to understand the effects of packet transmission and loss. 5.4. Toolkit Scalability Scalability is a key concern in the design of any program comprehension system. There are two dimensions to consider: Implementation scalability is concerned with the performance of the toolkit as a function of application size. Intellectual scalability is concerned with the comprehension benefits afforded to end-users as a function of application size. Both dimensions are important in assessing the toolkit’s practical utility. Before considering these issues, it is useful to provide a sense of the typical size of a TinyOS application and to place the three examples discussed in this section into context. Unfortunately, a comprehensive treatment is difficult: While the developer community is expanding at a rapid pace, TinyOS is still a fledgling platform compared to, say, C++ or Java. Standard application test suites of the type used to evaluate comprehension tools for those platforms do not yet exist. However, the TinyOS distribution includes 21
Figure 8: Sequence Diagram for BarrierSync (1 of 2)
22
Figure 9: Sequence Diagram for BarrierSync (2 of 2)
a number of application examples, some of which are complex (e.g., a multi-hop sensing system). These examples provide a convenient baseline for comparison. Their respective sizes, as well as that of BarrierSync, are shown in Table 3. The ROM figures represent the memory required to load the respective image — i.e., the size of the compiled code. The RAM figures represent the amount of RAM required to execute the application; they are provided for the sake of completeness. The three applications discussed in the preceding use-case scenarios are highlighted in bold. As the table shows, Blink is among the smallest of the applications, while RadioCountToLeds and BarrierSync are near the median. The largest of the use-case examples, BarrierSync, is approximately one-third the size of MViz, the largest of the applications included with TinyOS. Even if one rejects the claim that these applications are representative, they provide a good sense of how large a “real” application might be. Unlike standard desktop applications, which grow in a seemingly unbounded way, TinyOS applications are highly restricted. Consider again the Tmote Sky platform used throughout this paper, representative of the state-of-the-art in the area. The device provides only 48K of ROM and 10K of RAM. Hence, BarrierSync consumes about one-quarter of the available program space on the device. Or, to state this another way, the largest application that can be installed on the Tmote Sky is 23
Application BarrierSync BaseStation Blink MultihopOscilloscope MultihopOscilloscopeLqi MViz Null Oscilloscope Powerup RadioCountToLeds RadioSenseToLeds Sense
RAM 370 1610 55 3368 2451 1722 4 372 4 286 344 95
ROM 11398 13160 2654 28624 24438 33640 1418 15320 1472 10794 15158 7184
% Max RAM 3.61% 15.72% 0.54% 32.89% 23.94% 16.82% 0.04% 3.63% 0.04% 2.79% 3.36% 0.93%
% Max ROM 23.19% 26.77% 5.40% 58.24% 49.72% 68.44% 2.88% 31.17% 2.99% 21.96% 30.84% 14.62%
Table 3: TinyOS Application Sizes (bytes)
approximately four times larger than BarrierSync. Given this upper-bound on application size, assessing the toolkit’s implementation scalability reduces to determining whether it can reasonably accommodate applications that are four times larger than BarrierSync. There are two sets of implementation components to consider — those that execute on the desktop and those that execute on the embedded device. The limiting factors on the desktop are the memory required to represent an application’s AST set and the time required to process the ASTs. Given the computational resources available on standard desktop machines, analyzing and instrumenting a 48K application is well within the toolkit’s capabilities. The limiting factors on the embedded device include the speed at which program actions can be recorded, the storage space required to record the actions, and the impact of the instrumentation process on an application’s memory usage. These factors require more careful consideration and are the focus of the next section. Unfortunately, the conclusions regarding intellectual scalability are less satisfying: The basic measurement objective is to determine the amount of data that can be represented in a generated diagram while still providing comprehension benefits to end-users. A proper treatment requires a user study across developers with different levels of experience and applications of various degrees of complexity. At present, however, the maturity of the domain makes this task prohibitively difficult to perform at a scale that would yield scientifically valid results. Hence, given that the degree of tolerable diagrammatic complexity will vary from one developer to another, we have provided simple selection and filtering tools that enable developers to customize the diagrams as they wish. As a case in point, consider again the BarrierSync scenario. The test system was executed for approximately one minute, during which time tens of millions of program actions were executed. The action set specified by the user prior to instrumentation reduced the number of actions captured to under 20,000. Selecting a subsequence of the trace reduced the number even further — the portion of the trace displayed in Figures 8 and 9 contains approximately 100 actions. In this way, the toolkit allows developers to visualize the level of detail appropriate to their degree of expertise and the comprehension task at hand. 6. Experimental Analysis We now examine the implementation scalability of the visualization toolkit as it relates to components on the embedded device. Specifically, we evaluate the rate at which program events can be captured and the overhead introduced by the instrumentation process. We also consider the non-volatile storage space required to capture program events, but the analysis is trivial.
24
Bytes 1 2 3 4
Buffer Count 3448 1856 1216 1280
Min 0.008 0.011 0.014 0.014
Time (seconds) Max Avg 1.051 0.009 1.054 0.014 1.058 0.185 1.017 0.018
STD 0.032 0.045 0.058 0.052
Table 4: Event Logging Time
6.1. Capture Rate The capture rate of the event recording service plays an important role in assessing the toolkit’s utility. If the maximum capture rate is low, the toolkit will not be suitable for fine-grained visualization or for systems in which instrumented actions will be executed with high frequency. To evaluate the capture rate, we developed a test application to measure the recording time over a continuous stream of events. The application repeatedly logs a full event buffer and records the duration of each call. The process is repeated for three different event record types ranging in size from 1 byte to 4 bytes. The buffer capacity was set to 70 records for cases 1 to 3, and 50 for case 4. This variation is to account for the fact that event records are dynamically sized based on the instrumentation set to minimize storage requirements. The tests were performed using the Tmote Sky platform9 . A summary of the experimental results is shown in Table 4. Each row corresponds to a single run of the test application using event records of the specified size. Buffer Count indicates the number of buffers written to log storage before the target volume reached capacity. The remaining columns have the obvious meanings. Despite the large variation in recording time, likely due to the underlying buffering strategy implemented by LogStorageC, the results are favorable. In the worst case, it took 1.058 seconds to log 70 records of 3 bytes each. Hence, given the dual-buffer implementation, the recording service can handle approximately 70 events per second, independent of the inter-arrival rate. (The achievable rate can be increased further by adding additional event buffers, but at the expense of increased overhead.) This makes the toolkit especially well-suited to the visualization of bursty execution patterns, in which a node periodically wakes to perform a dense series of actions and then resumes its idle state. Fortunately this pattern is representative of most sensor network applications. Before proceeding, we note that the log storage volume used in the experiments consumed approximately one-quarter of the available storage space. The Tmote Sky provides 1Mb of non-volatile storage for use across one or more volumes. Hence, if the log storage volume is maximized, a single device can capture more than 340,000 actions, assuming a record size of 3 bytes. The capacity is of course increased if a smaller record size is used. This appears to be sufficient for most applications of the toolkit. 6.2. Resource Overhead The resource overhead introduced during the instrumentation process is another important evaluation metric. If the overhead is high, the achievable instrumentation density will be low, resulting in low-fidelity visualizations. This would also limit the potential integration outlets for the toolkit (e.g., existing sensor network diagnostic systems). To evaluate the impact on resource usage, we applied the toolkit to each of the sample applications included as part of the TinyOS 2.0 distribution. The instrumented systems were used to evaluate the base and incremental impact of probe insertion on application memory usage. To distinguish between the overhead introduced by LogStorageC and the overhead introduced by the full recording service, of which LogStorageC is a part, each application was compiled under three configurations. In the first configuration, no source modifications were performed. In the second, LogStorageC was included in the application image, as were calls to erase the log and record a single event. The calls were introduced 9 Recall that the Event Recording Service is implemented as a thin wrapper over the LogStorageC component provided by TinyOS. Given a fixed event record size, assessing the maximum capture rate is equivalent to evaluating the performance of LogStorageC for the target platform.
25
Application BaseStation Blink MultihopOscilloscope MultihopOscilloscopeLqi MViz Null Oscilloscope Powerup RadioCountToLeds RadioSenseToLeds Sense
Baseline RAM ROM 1610 13160 55 2654 3368 28624 2451 24438 1722 33640 4 1418 372 15320 4 1472 286 10794 344 15158 95 7184
EEPROM Logging RAM ROM 1766 18902 216 8490 3498 33410 2589 29286 1854 38402 184 8258 504 20166 186 8272 420 15712 474 20004 256 12762
Full Inst. RAM ROM 1922 19686 360 9276 3650 34284 2729 29808 2003 39258 330 9038 652 21024 330 9060 568 16566 620 20888 400 13600
Table 5: Base Overhead (RAM/ROM) (bytes)
to prevent the compiler from removing LogStorageC as part of its dead code elimination phase. Finally, in the third configuration, the application was modified to include the full recording service, including the necessary calls to prevent elimination. The resource requirements under each configuration are shown in Table 5. The Baseline columns correspond to the first configuration; the EEPROM Logging columns correspond to the second configuration; and the Full Instrumentation columns correspond to the third configuration. The RAM results are summarized in Figure 10, and the ROM results are summarized in Figure 11. The results are consistently favorable. On average, the instrumentation toolkit introduces a base cost of approximately 256 bytes of RAM and 6239 bytes of ROM. Factoring out the overhead introduced by LogStorageC yields the additional cost of the recording service in applications that already include LogStorageC: 147 bytes of RAM and 802 bytes of ROM, on average. We view this overhead as acceptable for most applications. It is also important to consider the incremental cost of each probe. In general, the instrumentation cost of a given action varies based on the number of exit paths it contains, as well as the compiler optimization context in which the probes appear. To give a sense of the typical cost associated with a single probe, we compiled several versions of the Blink application, increasing the number of probes from one version to the next. The first version contained a single entry probe; the second contained an entry probe followed by an exit probe; the third added a second entry probe; etc. The underlying records used to store events were 1 byte each. The resource requirements are summarized in Figure 12. Again, the results are favorable. While there is some variation in incremental cost, a new probe requires approximately 12 additional bytes of ROM on average. There is no incremental RAM expense, assuming that an additional probe does not increase the minimum required size of the underlying event records. Again, the resource requirements appear to be acceptable for most applications. 7. Conclusion Our work began with an interesting observation. The efficiency characteristics that drive the continued adoption of TinyOS [9, 10, 11] stem from the same source responsible for the platform’s disrepute among developers — a programming model based on events and deferred execution. While well-suited to the construction of lightweight, power-efficient systems, the model introduces non-determinism in the execution ordering of program actions. This issue is exacerbated by the application contexts in which TinyOS is applied — embedded network systems are inherently distributed and reactive. The result is an explosive increase in the number of execution paths that must be considered, both locally and network-wide, to reason faithfully about an application’s correctness and performance. In addition to a burgeoning path set, developers must contend with hidden paths that do not follow naturally from manual source inspection. The complexity can 26
4000 Baseline EEPROM Logging Full Instrumentation
3500 3000
Bytes
2500 2000 1500 1000 500 0 Se d Le s
s
ed
op sc
oL
To
e
illo qi
eL
e
op sc
illo
tT
e ns
n ou
Se
io
C
op
sc
up
e ns
ad
R io
ad
R
er
illo
w
sc
Po
O
l sc
n
sc
pO ho
pO ho
ti ul
ul
N
M
ti ul
M z
Vi
M
tio
a St
se
k in
Bl
Ba
Figure 10: Base Overhead (RAM)
40000 Baseline EEPROM Logging Full Instrumentation
35000 30000
Bytes
25000 20000 15000 10000 5000 0 Se e s
ds
ed
Le
qi
eL
e
op sc
oL
eT
To
e
nt
op
llo
op sc
llo
i sc
ns
Se
up
sc
O
ou C
io
ns
ad
R io
ad
R
er
w
illo sc
Po
O
op
n
i sc
io
O
at
op
St
tih
ul
l ul
N
M tih
ul
M z
Vi
M
k
se
in
Bl
Ba
Figure 11: Base Overhead (ROM)
9450
Bytes
9400
9350
9300
9250 1
2
3
4
5
6
7
8
9
10
11
12
Logging Invocations
Figure 12: Incremental Overhead (ROM)
27
13
14
15
16
quickly swamp developers’ ability to understand the path sets underlying their systems and the particular paths chosen during each run. To assist developers in performing these reasoning tasks, we described a program visualization toolkit for TinyOS 2.0. The toolkit is used to generate the annotated call graph corresponding to an input system and UML sequence diagrams corresponding to particular runs of the system. The latter diagrams come in two variants: The first follows standard UML conventions and depicts local runtime behavior. The second introduces several enhancements to capture global runtime behavior across distributed participants. The toolkit architecture consists of five components. First, we described a Java-based static analysis and instrumentation library for TinyOS 2.0. Second, we described a system to automate the insertion of sourcelevel logging probes to capture a desired set of program actions. Third, we described a simple, lightweight logging service for capturing runtime events. Fourth, we described a tool for extracting logged events across a network, reconstructing the associated runtime traces, and correlating transmission and reception events. Finally, we described three visualization front-ends corresponding to the aforementioned views. The application of the toolkit was demonstrated using system examples included as part of the standard TinyOS 2.0 distribution, as well as a custom example involving distributed coordination. A detailed analysis of the toolkit’s resource usage and performance characteristics was also presented. Looking forward, we plan to pursue three avenues of exploration. First, we plan to investigate techniques for reducing the degree of uncertainty associated with the visualization of asynchronous flows. While additional probes and/or instrumentation logic could be used to reduce (or even eliminate) this uncertainty, resource limitations reduce the set of applicable solutions. One approach that we plan to investigate is based on context-sensitive static analysis, as in [60, 61]. The central idea is to exclude the consideration of flows that originate from a disabled interrupt context when determining whether an asynchronous flow was injected between two logged events. Second, we plan to explore the use of sequence diagram abstraction mechanisms, as developed by Cornelissen et al. [36, 37] and discussed in Section 2.1. Finally, we plan to investigate new visualization techniques for embedded networks based on the application of the nesC Analysis and Instrumentation Library. A preliminary version of this work [62] was published in the proceedings of the 16th IEEE International Conference on Program Comprehension. The manuscript also leverages work reported in [57] and significantly extends work reported in [44]. 8. Acknowledgments This work was supported in part by the National Science Foundation through awards CNS[CAREER]0745846, CNS[NeTS-NOSS]-0520222, and CNS[ITR]-0218495. The authors gratefully acknowledge the NSF for its support. References [1] R. Aylward, J. Paradiso, Sensemble: A wireless, compact, multi-user sensor system for interactive dance, in: The 6th International Conference on New Interfaces for Musical Expression, Centre Pompidou, Paris, France, 2006, pp. 134–139. [2] M. Laibowitz, J. Gips, R. Aylward, A. Pentland, J. Paradiso, A sensor network for social dynamics, in: The 5th International Conference on Information Processing in Sensor Networks, ACM Press, New York, NY, USA, 2006, pp. 483–491. [3] N. Ramanathan, T. Schoellhammer, D. Estrin, M. Hansen, T. Harmon, E. Kohler, M. Srivastava, The final frontier: Embedding networked sensors in the soil, Tech. Rep. CENS #68, Center for Embedded Networked Sensing (UCLA), Los Angeles, CA, USA (November 2006). [4] G. Werner-Allen, K. Lorincz, M. Welsh, O. Marcillo, J. Johnson, M. Ruiz, J. Lees, Deploying a wireless sensor network on an active volcano, IEEE Internet Computing 10 (2) (2006) 18–25. [5] W. Hu, V. Tran, N. Bulusu, C. Chou, S. Jha, A. Taylor, The design and evaluation of a hybrid sensor network for canetoad monitoring, in: The 4th International Symposium on Information Processing in Sensor Networks, IEEE Computer Society, Los Alamitos, CA, USA, 2005, pp. 503–508. [6] J. Tolliver, D. Resseguie, M. Parang, M. Gardner, F. Denap, B. Kusy, G. Balogh, A. Nadas, J. Sallai, Y. Xue, T. Wu, P. Volgyesi, M. Maroti, A. Ledeczi, Dirty bomb detection and localization, http://www.isis.vanderbilt.edu/projects/rips/, demonstration (The 5th International Conference on Information Processing in Sensor Networks) (April 2006).
28
[7] A. Arora, R. Ramnath, E. Ertin, P. Sinha, S. Bapat, V. Naik, V. Kulathumani, H. Zhang, H. Cao, M. Sridharan, S. Kumar, N. Seddon, C. Anderson, T. Herman, N. Trivedi, C. Zhang, M. Gouda, Y. Choi, M. Nesterenko, R. Shah, S. Kulkarni, M. Aramugam, L. Wang, D. Culler, P. Dutta, C. Sharp, G. Tolle, M. Grimmer, B. Ferriera, K. Parker, ExScal: Elements of an extreme scale wireless sensor network, in: The 11th IEEE International Conference on Embedded and Real-Time Computing Systems and Applications, IEEE Computer Society, Los Alamitos, CA, USA, 2005, pp. 102–108. [8] G. Simon, M. Mar´ oti, A. L´ edeczi, G. Balogh, B. Kusy, A. N´ adas, G. Pap, J. Sallai, K. Frampton, Sensor network-based countersniper system, in: The 2nd International Conference on Embedded Networked Sensor Systems, ACM Press, New York, NY, USA, 2004, pp. 1–12. [9] J. Hill, R. Szewczyk, A. Woo, S. Hollar, D. Culler, K. Pister, System architecture directions for networked sensors, in: The 9th International Conference on Architectural Support for Programming Languages and Operating Systems, ACM Press, New York, NY, USA, 2000, pp. 93–104. [10] P. Levis, D. Gay, V. Handziski, J. Hauer, B. Greenstein, M. Turon, J. Hui, K. Klues, C. Sharp, R. Szewczyk, J. Polastre, P. Buonadonna, L. Nachman, G. Tolle, D. Culler, A. Wolisz, T2: A second generation OS for embedded sensor networks, Tech. Rep. TKN-05-007, Telecommunication Networks Group, Technische Universit¨ at Berlin, Berlin, Germany (November 2005). [11] UC Berkeley, TinyOS community forum – an open-source OS for the networked sensor regime, http://www.tinyos.net (2004). [12] Moteiv Corporation, Tmote Sky datasheet, http://www.moteiv.com/products/docs/tmote-sky-datasheet.pdf (2006). [13] J. Jones, A. Orso, M. Harrold, Gammatella: Visualizing program-execution data for deployed software, Information Visualization 3 (3) (2004) 173–188. [14] A. Orso, J. Jones, M. Harrold, J. Stasko, Gammatella: Visualization of program-execution data for deployed software, in: The 26th International Conference on Software Engineering, IEEE Computer Society, Washington, DC, USA, 2004, pp. 699–700. [15] S. Eick, J. Steffen, E. Sumner Jr., SeeSoft – a tool for visualizing line oriented software statistics, IEEE Transactions on Software Engineering 18 (11) (1992) 957–968. [16] B. Shneiderman, Tree visualization with tree-maps: 2-d space-filling approach, ACM Transactions on Graphics 11 (1) (1992) 92–99. [17] J. Edwards, Example centric programming, in: The 19th Annual ACM Conference on Object-Oriented Programming, Systems, Languages, and Applications, ACM, New York, NY, USA, 2004, pp. 84–91. [18] L. Voinea, J. Lukkien, A. Telea, Visual assessment of software evolution, Science of Computer Programming 65 (3) (2007) 222–248. [19] L. Voinea, A. Telea, Visual data mining and analysis of software repositories, Computers and Graphics 31 (3) (2007) 410–428. [20] J. Pfeiffer, J. Gurd, Visualisation-based tool support for the development of aspect-oriented programs, in: The 5th International Conference on Aspect-Oriented Software Development, ACM, New York, NY, USA, 2006, pp. 146–157. [21] M. Balzer, O. Deussen, C. Lewerentz, Voronoi treemaps for the visualization of software metrics, in: The ACM 2005 Symposium on Software Visualization, ACM, New York, NY, USA, 2005, pp. 165–172. [22] A. Hamou-Lhadj, T. Lethbridge, L. Fu, SEAT: A usable trace analysis tool, in: The 13th International Workshop on Program Comprehension, IEEE Computer Society, Washington, DC, USA, 2005, pp. 157–160. [23] A. Hamou-Lhadj, The concept of trace summarization, in: The 1st International Workshop on Program Comprehension through Dynamic Analysis, IEEE Computer Society, Los Alamitos, CA, USA, 2005, pp. 38–42. [24] B. Cornelissen, D. Holten, A. Zaidman, L. Moonen, J. van Wijk, A. van Deursen, Understanding execution traces using massive sequence and circular bundle views, in: The 15th IEEE International Conference on Program Comprehension, IEEE Computer Society, Washington, DC, USA, 2007, pp. 49–58. [25] D. Holten, Hierarchical edge bundles: Visualization of adjacency relations in hierarchical data, IEEE Transactions on Visualization and Computer Graphics 12 (5) (2006) 741–748. [26] A. Lienhard, T. Gˆırba, O. Greevy, O. Nierstrasz, Exposing side effects in execution traces, in: The 3rd International Workshop on Program Comprehension through Dynamic Analysis, Delft University of Technology, Delft, Netherlands, 2007, pp. 11–17. [27] A. Lienhard, S. Ducasse, T. Gˆırba, O. Nierstrasz, Capturing how objects flow at runtime, in: The 2nd International Workshop on Program Comprehension through Dynamic Analysis, Universiteit Antwerpen, Antwerpen, Belgium, 2006, pp. 39–43. [28] M. Kleyn, P. Gingrich, GraphTrace – understanding object-oriented systems using concurrently animated views, in: The 3rd Conference on Object-Oriented Programming Systems, Languages, and Applications, ACM Press, New York, NY, USA, 1988, pp. 191–205. [29] W. De Pauw, R. Helm, D. Kimelman, J. Vlissides, Visualizing the behavior of object-oriented systems, in: The 8th Conference on Object-Oriented Programming Systems, Languages, and Applications, ACM, New York, NY, USA, 1993, pp. 326–337. [30] S. P. Reiss, Visualizing java in action, in: The 2003 ACM Symposium on Software visualization, ACM Press, New York, NY, USA, 2003, pp. 57–65. [31] S. Reiss, M. Renieris, Jove: java as it happens, in: The 2005 ACM symposium on Software Visualization, ACM Press, New York, NY, USA, 2005, pp. 115–124. [32] D. Lange, Y. Nakamura, Program Explorer: A program visualizer for C++, in: The USENIX Conference on ObjectOriented Technologies, USENIX Association, Berkeley, CA, USA, 1995, pp. cd–rom. [33] B. Malloy, J. Power, Exploiting UML dynamic object modeling for the visualization of C++ programs, in: The 2005
29
ACM Symposium on Software Visualization, ACM Press, New York, NY, USA, 2005, pp. 105–114. [34] R. Oechsle, T. Schmitt, JAVAVIS: Automatic program visualization with object and sequence diagrams using the Java debug interface (JDI), Software Visualization (LNCS) 2269 (2002) 176–190. [35] L. Briand, Y. Labiche, J. Leduc, Toward the reverse engineering of UML sequence diagrams for distributed Java software, IEEE Transactions on Software Engineering 32 (9) (2006) 642–663. [36] B. Cornelissen, A. van Deursen, L. Moonen, Aiding in the comprehension of testsuites, in: The 2nd Workshop on Program Comprehension through Dynamic Analysis, Universiteit Antwerpen, Antwerpen, Belgium, 2006, pp. 17–20. [37] B. Cornelissen, A. van Deursen, L. Moonen, A. Zaidman, Visualizing testsuites to aid in software understanding, in: The 11th European Conference on Software Maintenance and Reengineering, IEEE Computer Society, Washington, DC, USA, 2007, pp. 213–222. [38] J. Moe, D. Carr, Understanding distributed systems via execution trace data, in: The 9th International Workshop on Program Comprehension, IEEE Computer Society, Los Alamitos, CA, USA, 2001, pp. 60–70. [39] J. Li, Monitoring of component-based systems, Tech. Rep. HPL-2002-25(R.1), Imaging Systems Laboratory, HP Laboratories, Palo Alto, CA, USA (May 2002). [40] W. Nagel, A. Arnold, M. Weber, H. Hoppe, K. Solchenbach, VAMPIR: Visualization and analysis of MPI resources, The Journal of Supercomputing 12 (1) (1996) 69–80. [41] M. Snir, S. Otto, MPI – The Complete Reference: The MPI Core, 2nd Edition, MIT Press, Cambridge, MA, USA, 1998. [42] C. Wu, A. Bolmarcich, M. Snir, D. Wootton, F. Parpia, A. Chan, E. Lusk, W. Gropp, From trace generation to visualization: A performance framework for distributed parallel systems, in: The 2000 ACM/IEEE Conference on Supercomputing, IEEE Computer Society, Los Alamitos, CA, USA, 2000, pp. 10pp., cdrom. [43] B. Topol, J. Stasko, V. Sunderam, PVaniM: A tool for visualization in network computing environments, Concurrency Practice and Experience 10 (14) (1998) 1197–1222. [44] A. Dalton, S. Dandamudi, J. Hallstrom, S. Wahba, A testbed for visualizing sensornet behavior, in: The 17th International Conference on Computer Communications and Networks, IEEE Computer Society, Washington, DC, USA, 2008, pp. cd– rom. [45] N. Ramanathan, K. Chang, R. Kapur, L. Girod, E. Kohler, D. Estrin, Sympathy for the sensor network debugger, in: The 3rd International Conference on Embedded Networked Sensor Systems, ACM Press, New York, NY, USA, 2005, pp. 255–267. [46] V. Krunic, E. Trumpler, R. Han, NodeMD: Diagnosing node-level faults in remote wireless sensor systems, in: The 5th International Conference on Mobile Systems, Applications, and Services, ACM Press, New York, NY, USA, 2007, pp. 43–56. [47] G. Tolle, D. Culler, Design of an application-cooperative management system for wireless sensor networks, in: The 2nd European Workshop on Wireless Sensor Networks, IEEE Computer Society, Los Alamitos, CA, USA, 2005, pp. 121–132. [48] K. Whitehouse, G. Tolle, J. Taneja, C. Sharp, S. Kim, J. Jeong, J. Hui, P. Dutta, D. Culler, Marionette: Using RPC for interactive development and debugging of wireless embedded networks, in: The 5th International Conference on Information Processing in Sensor Networks, ACM Press, New York, NY, USA, 2006, pp. 416–423. [49] A. Dalton, J. Hallstrom, An interactive, source-centric, open testbed for developing and profiling wireless sensor systems, International Journal of Distributed Sensor Networks (2008) (to appear). [50] A. Dalton, J. Hallstrom, A file system abstraction and shell interface for a wireless sensor network testbed, in: The 3rd International Conference on Testbeds and Research Infrastructures for the Development of Networks and Communities, IEEE Computer Society, Washington, DC, USA, 2007, pp. cd–rom. [51] W. McCartney, N. Sridhar, TOSDev: A rapid development environment for TinyOS (demo), in: The 4th International Conference on Embedded Networked Sensor Systems, ACM Press, New York, NY, USA, 2006, pp. 387–388. [52] J. Sallai, G. Balogh, S. Dora, TinyDT: TinyOS plugin for the Eclipse platform, http://www.tinydt.net, (package date) (October 2005). [53] R. Schuler, N. Burri, TinyOS plugin for eclipse, http://www.dcg.ethz.ch/∼rschuler/, (date of last page update) (March 2006). [54] D. Gay, P. Levis, R. von Behren, M. Welsh, E. Brewer, D. Culler, The nesC language: A holistic approach to networked embedded systems, in: ACM SIGPLAN 2003 Conference on Programming Language Design and Implementation, ACM Press, New York, NY, USA, 2003, pp. 1–11. [55] P. Levis, TinyOS programming (manual), http://csl.stanford.edu/∼pal/pubs/tinyos-programming.pdf (June 2006). [56] UC Berkeley, TinyOS tutorial lesson 2: Modules and the TinyOS execution model, http://www.tinyos.net/tinyos-2.x/ doc/html/tutorial/lesson2.html, (date of last page update) (January 2009). [57] A. Dalton, J. Hallstrom, nAIT: A source analysis and instrumentation framework for nesC, Journal of Systems and Software (2009) (to appear). [58] E. Gamma, R. Helm, R. Johnson, J. Vlissides, Design Patterns: Elements of Reusable Object-Oriented Software, AddisonWesley, Reading, MA USA, 1995. [59] L. Lamport, Time, clocks, and the ordering of events in a distributed system, Communications of the ACM 21 (7) (1978) 558–565. [60] J. Regehr, A. Reid, K. Webb, Eliminating stack overflow by abstract interpretation, ACM Transactions on Embedded Computing Systems 4 (4) (2005) 751–778. [61] W. McCartney, N. Sridhar, Abstractions for safe concurrent programming in networked embedded systems, in: The 4th International Conference on Embedded Networked Sensor Systems, ACM Press, New York, NY, USA, 2006, pp. 167–180. [62] A. Dalton, J. Hallstrom, A toolkit for visualizing the runtime behavior of tinyos applications, in: The 16th IEEE International Conference on Program Comprehension, IEEE Computer Society, Washington, DC, USA, 2008, pp. 43–52.
30