Oct 23, 2001 - tion of multi-disciplinary teams located at geographically dispersed sites. VLAM-. G meets .... modules. For each data channel, the module connector selects a communication ..... [7] Rich Wolski, Neil T. Sprin, and Jim Hayes.
VLAM-G: A Grid-Based Virtual Laboratory H. Afsarmanesh1 , R. Belleman1 , A. S. Z. Belloum1 , A. Benabdelkader1 , J. F. J. van den Brand3,3 , G. B. Eijkel5 , A. Frenkel1 , C. Garita1 , D. L. Groep2 , R. M. A. Heeren5 , Z. W. Hendrikse1 , L. O. Hertzberger1 , J. Kaandorp1 , E. C. Kaletas1 , V. Korkhov1 , V. Klos6,3 , C.T.A.M. de Laat1 , P. Sloot1 , D. Vasunin1 , A. Visser4 , H. H. Yakali4 1
University of Amsterdam Computer Science Department, Kruislaan 403, 1098 SJ Amsterdam, The Netherlands 2 NIKHEF, P.O. Box 41882, 1009 DB Amsterdam, The Netherlands 3 Vrije Universiteit, de Boelelaan 1081, 1081 HV Amsterdam, The Netherlands 4 PCC BV., Kruislaan 318, 1098 SJ Amsterdam, The Netherlands 5 FOM Institute AMOLF, Kruislaan 407, 1098 SJ Amsterdam, The Netherlands 23rd October 2001
Abstract The Grid-based Virtual Laboratory AMsterdam (VLAM-G), provides a science portal for distributed analysis in applied scientific research. It offers scientists experiment control, data handling facilities and access to distributed resources by providing cross-institutional integration of information and resources in a familiar environment. Major goal is a unique integration of existing standards and software packages. In this paper the proposed design and prototype implementation of the VLAM-G platform are presented. In the testbed we applied several recent technologies such as the Globus toolkit, enhanced database systems, and visualization and simulation techniques. Several domain specific case studies are described in some detail.
1
1
Introduction
Recent improvements in overall network bandwidth have made it possible to add a new dimension to distributed computing: the Grid [1]. Nowadays, an impressive number of workstations and super computers can be connected in an efficient way, offering users unprecedented computational power. The part of the scientific community that relies on high-performance and/or high-throughput computing machinery needs an ever growing amount of CPU-cycles. Moreover, huge amounts of data are generated from experiments conducted world-wide. It would be desirable for scientists to be able to smoothly connect the data producing equipment to the compute, storage and visualisation centers, which are usually not on the same site. Furthermore, connectivity from Mega science laboratories, such as CERN, to home institutes and universities is a necessity as well. VLAM-G offers such a distributed analysis platform for applied experimental science. It is distinguished by • the development of specialized upper middleware, meant to bridge the gap between the applications and grid-services layer, • unique information management provisions • and means for resource integration & collaboration. Therefore, the VLAM-G is a science portal for remote experiment control and collaborative, Grid-based distributed analysis in applied sciences, using crossinstitutional integration of heterogeneous information and resources . Scientists are not supposed to be acquainted with the low-level Grid and all its computer science related details, nor are they inclined to deal with low-level issues concerning e.g., security, resource management and networking. However, since the Globus toolkit constitutes a low-level middle-tier, an additional layer is needed to open up Grid/Globus technology to scientists, since they form the most important group of Grid users thus far. The importance is underlined by the fact that scientists may benefit from geographically dispersed resources, thereby enhancing their experimentation capabilities considerably. Domain specific application case studies have been developed for physics, bioand food-informatics, and systems engineering. Bearing these application domains in mind, three different science portals are being implemented simultaneously, sharing a common technology.
2
2
The VLAM-G toolkit
The VLAM-G toolkit is positioned between the grid middleware and the application environment. It provides GUIs for users, structures to encapsulate/ interface to experiment specific soft- and hardware, data storage and visualisation systems. It uses the Grid services standardized by the GGF to tie everything together. In these distributed environments advanced networks play an essential role. Access to the better than best effort (QoS) network resources is done via the appropriate Grid services. Portals are envisioned to encompass several organisational domains. Since it is very well possible that competing organisations will be using the same Grid infrastructure using their specific portals, security is essential.
2.1
The concept of a study
The VLAM-G middleware guides a scientist through his experiment by providing a Graphical User Interface (GUI) and an assistant. These components ease the handling of remote data access, resource allocation, security and access to external devices. In addition to resolving domain specific challenges, a Run-Time System (RTS) that is used by all application domains has been designed and implemented. As can be seen from Figure 1 the RTS relays commands from the front-end to the Grid fabric. These commands include amongst others the instantiation of experiment topologies. As we will see later, these topologies are composed of a set of generic modules that can be used by each of the five science portals. A preliminary requirement analysis performed together with various scientists from the aforementioned application domains has led to a classification of three types of modules: Control modules : which serve to control external devices. Processing modules : meant as data filters and visualization modules. Database and mass storage modules : allow a scientist to store and retrieve local and remote data either in raw data files or in databases. A scientist connects these modules 1 using the front-end to compose his experiment(s). The resulting topology is represented by a data-flow graph (DFG). As such, the modules comprising the data-flow have a strong analogy to those used in IRIS explorer2 . A portal is designed in such a way that it can easily be adapted to include either a new application domain or a different user community. The proposed modular 1 2
Separate modules may be grouped together, to form a larger so-called aggregate module. http://www.nag.co.uk/Welcome IEC.html
3
architecture is essential to establish such a flexibility, by integrating modules that may have been developed independently [2, 3]. A first prototype will integrate various filters developed for physics experiments, modules for accessing High Performance Storage Systems (HPSS) and databases, modules for control of external devices and modules specifically geared for visualization tasks.
2.2
The process flow model
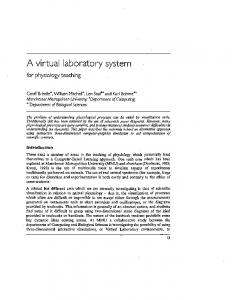
One of the fundamental challenges in experimental science is the extraction of useful information from large data sets. Another requirement is the need for cooperation of multi-disciplinary teams located at geographically dispersed sites. VLAMG meets these challenges by: • providing a collaborative application environment (for which new technology is under development) and • integrating Grid (software) tools and packages in a unique way, resulting in an added value when compared to using these Grid services separately. To achieve these goals, experiments are embedded in the context of a study. A study is defined by a formalized series of steps intended to solve a particular problem in a particular application domain, the so-called process flow. A study includes process steps, descriptions of data elements (meta-data) related to objects, as well as actions performed outside the scope of the RTS (e.g. manually). A Process Flow Template (PFT) is used to represent such a formalized workflow. A user is guided through this process flow using context-sensitive interaction. An example of a process flow is shown in Figure 3. This particular flow describes chemo-physical analysis of samples using space-resolved techniques: Material Analysis of Complex Surfaces (MACS) [4]. A similar process flow exists for bio genetic experiments, called Expressive [5]. The context of the operational steps (represented by ovals) is provided by entity meta data (represented by boxes). For one-time experiments, a trivial process flow should be defined, consisting of one operational step only, and limited contextual meta data associated with the result. A study of the application domains driving the VLAM-G development has enabled us to identify generic aspects. Combining these generic features with those of specific case-studies, it became possible to develop a database model for the Experiment Environment (EE). The EE data model [6] underlies the definition of a PFT and allows for a random ordering of processes and data elements (which enables one to construct an arbitrary process data flow).
4
2.3
The VLAM-G architecture
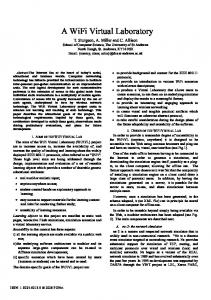
The VLAM-G middleware fits a modular 4-tier architecture, see Figure ??. The four tiers of the VLAM-G consist of the application tier, the application toolkits tier (VLAM-G science portals and the RTS), the grid middleware tier (providing the grid services) and the grid fabric tier (for the access to underlying resources).
End−user End−user
End−user
Collaborative system
Front End
RTS
RTS DB
Assistant
Application Databases
Module Repository
GLOBUS toolkit
Figure 1: The components of the VLAM-G science portal and their relations. The interaction of the various VLAM-G components has been depicted in Figure 1. Four main components may be distinguished: • a front-end, • a run time system (VLAM-G RTS), • a collaboration system and • an assistant. The front-end and the RTS form the core components and constitute the interface to the underlying Grid services. The front end is the only component with which users interact. Once an experiment topology has either been loaded or composed, its associated data-flow graph (DFG) can be dispatched to the RTS in XML. 5
The RTS takes care of scheduling, instantiating and monitoring of the modules comprising the experiment, thereby making extensive use of Globus services such as the gatekeeper and the Grid Information Service (GIS)3 . In the future the Globus scheduling services of DUROC are to be used as well. Possibly tools developed for forecasting the network bandwidth and host load such as the Network Weather Service [7] may be used too. By using these existing components from the Gridservices layer, we take full advantage of many Grid-related developments. More details on the instantiation of the DFG may be found in the next section. The collaboration system and assistant support composing an experiment by providing templates and information about previous experiments and by providing communication mechanisms for collaboration during execution of an experiment. • Collaboration: The collaboration system will offer audio and video communication between participating scientists by supporting amongst others a whiteboard for scientists and an experiment logbook. Therefore, the collaboration system will closely follow the developments in the ACCESS-Grid4 . • The assistant: The assistant is a subsystem that assists users during the design of an experiment, e.g., it may suggest module definitions or PFTs of previous experiments. Decisions of the assistant are supported by knowledge gathered from the RTS database, the application database, and the GIS. The information management system includes the RTS database and application databases. The former stores administration data, such as the topology of experiments, user sessions and module descriptions [8]. The latter database contains a data model for a domain specific PFT.
2.4
The VLAM-G RTS
The RTS executes the topology representing an experiment, which it receives from the front end. It defines the mechanism to transfer data between modules. These data-streams are established between the appropriate modules using typed streams. Not only are modules instantiated, also parameter and state values are changed, cached and or propagated. From case studies it has been shown that at least three types of connectivity have to be supported: • interactions among processing elements located on the same machine, • interactions among two or more machines and 3 4
For information on GIS, the reader is referred to http://www.globus.org/mds/ http://www.accessgrid.org/
6
• interactions with external devices, where some of the processing elements are bound to a specific machine. Moreover, practice has not only shown the need for one-to-one communications, but also for one-to-many (fan-out). Communication is established using uni-directional ports. The sole use of unidirectional, typed streams assures only proper connections can be established and intentionally precludes the possibility for ‘out-of-band’ communication. The latter is only allowed between the RTS and a module as events that can be communicated between the RTS and modules to exchange state and parameter values. The RTS consists of three components: the module launcher, the module connector and module controller, see Figure 2. The module launcher initiates the execution of an experiment, which it receives from the front-end in XML. For the time being it makes use of the globus-job-run utility of the Globus toolkit, where the resources are statically specified The module connector implements the third party arbitration which builds the data communications channels between modules. For each data channel, the module connector selects a communication port (TCP ports) and sends specific commands to the producer and the consumer to initialize the communication. Thereafter, input and output ports may exchange data using the Grid FTP protocol (FIXME: ref). This choice is motivated by the fact that experiments require a reliable and effective and data transfer mechanism (including features for high-performance parallel data transfers). A module acts like a GridFTP server that presents input and output ports as files with appropriate permissions. Consequently, it may be connected by any GridFTP client, such as a GSI enabled HPSS. Finally, the module-controller monitors the state of modules, once they have been instantiated. Changes of state are relayed to the front-end. Parameter changes are communicated between the module-controller and the front-end as well. There are two ways of communicating data among remote processing modules. The first way makes use of the eXternal Data Representation standard (XDR) FIXME: ref to define a typed data stream. The second method uses an external data typing mechanism that supports data types provided by the application programmer. An example is the NetCDF (FIXME ref) format, which we use for visualisation purposes. Here the RTS uses plain GridFTP streams, that are compatible with standard C++ streams. Modules are always active, i.e. once instantiated they enter a continuous processing loop, blocked if waiting for arrival of data on input ports. In the near future performance measurements are planned, as well as optimizations, for example by letting modules on the same machine, executed under the same UID communicate via shared memory. 7
XML topology
RTS manager
module launcher
module connector
module controller
GLOBUS API and TOOLS
module 1
module 2
...
module N
Figure 2: The VLAM-G RTS.
3
The VLAM-G Science Portals
To guide the development of the VLAM-G platform, five application cases have been selected from different domains in applied science: chemo-physical analysis of material surfaces, simulated bio-medical vascular reconstruction using immersive visualisation techniques, correlation of gene expression data from heterogeneous databases, and a simulation/analysis environment for road-traffic measurement data. Finally, we created a small distance learning portal allowing the development group to do proof of concept studies. These case studies each use their own portal, that provides them with a localized set of PFTs and appropriate supportive tooling. Each case study highlights a different aspect of the VLAM-G environment. Steering of remote measurement apparatus and value-adding by combining data sets from different sources is demonstrated by MACS; the simulation and system engineering case shows the interplay between commodity analysis environments and the VLAM-G middleware; the bio-informatics portal stresses the workflow support provided by the PFT; and the surgical planning system proves the usefulness of man-in-the-loop type dynamic data exploration environments. The application cases and science portals are described in detail below.
8
3.1
A Virtual Material Analysis Laboratory
The use of advanced physical methods to study the properties of material surfaces has proven to be a powerful tool, not only for fundamental but also for applied research. In fields as diverse as art conservation, cancer therapy, and cosmology, sub-micron techniques for elemental and molecular analysis lead to better understanding of the processes involved. These methods will henceforth referred to as “Materials Analysis of Complex Surfaces” or ‘MACS’. The MACS center comprises three large devices: an imaging infra-red Fouriertransform spectrometer (FTIR [9]), a 4 MeV Nuclear Microprobe for elemental analysis [10], and an imaging mass spectrometer. These devices produce largely complementary data; FTIR imaging is primarily sensitive to the chemical composition of materials, whereas PIXE and specific nuclear reactions quantitatively identify the elemental composition of the sample. Existence and spatial distribution of (large) macromolecules and polymers may be studied with imaging mass spectrometry. Correlation of these complementary data would significantly add to the scientific merit of these experiments. VLAM-G provides all these experiments with a uniform environment for data analysis, since most if not all experiments share a similar PFT (in this particular case preparation of a sample, surface analysis, visual inspection and possibly reanalysis). A simplified version of such a data flow is shown in Figure 3. The processes in the PFT may represent the data gathering phase of any of the devices mentioned, either by real-time access to these resources or by way of human intervention. The subsequent data analysis can be modelled as a directed data-flow, that may be processed by the VLAM-G RTS. All resulting data, n-dimensional ‘data cubes’, are represented in a common standard format (NetCDF-3 with locally established conventions). Generic visualization modules for such data cubes are provided as part of the core VLAM-G module set.
3.2
Simulation and Systems Engineering
Evaluation of communication systems in various ICT application areas, like traffic management strategies and telematic services, can greatly profit from simulations. Although field tests provide an opportunity to measure the benefits of new applications in real-world environments and convey vital information for system design and evaluation, the scale and the range of the conditions for which the system performance can be tested is severely limited in vivo. Using simulation, both key operations and performance issues may be investigated under a wide range of conditions.
9
Available compute power is the determining factor with respect to the level of detail that can be simulated and, consequently, lack of it leads to more abstract models. With the resources provided on Grid, we can afford more detailed simulations. In addition to simulation, research on traffic management and the subsequent analysis generates significant amount of data. In order to provide a comprehensive environment for data analysis, an interface between VLAM-G and Matlab is being developed in addition to generic traffic analysis and validation tools [11, 12]. In this environment, users will be able to start their VLAM-G applications from Matlab and get their simulation/experimentation results directly back into their Matlab environment, where they may do subsequent analysis.
3.3
Correlating Genome Expression information
The systematic growth of research efforts in biosciences resulted in large amounts of data scattered around the world, stored in different and often incompatible archiving systems. This heterogeneity is partly due to the wide variety of genomic information types but also to the various formats used to store the data. The major problems in this domain are therefore related to the management of this distributed and heterogeneous experimental information set. Moreover, on the single experiment level, all information about the experiment steps and the results must be stored for the analysis and reproducibility of the experiment; while on the higher level, experimental information from one area must be linked to information from other areas (e.g. gene sequences and expression data) since only then additional information be extracted. Therefore, an infrastructure for systematic definition and execution of experiments and federated management of information are required. This expression data and the experiment environment (i.e. the stimuli applied) are stored in an extensible gene expression database called ‘EXPRESSIVE’. Using the primitives defined by the EE data model, it allows to represent any kind of expression pattern. It supports the reproducibility of the experiment and can store both raw and processed experimental results. The visualisation functionality of the PFT editor is then used to present this information to the user. In this case study, we specifically target a ‘DNA micro-array’, for which the necessary experimentation, information management and analysis platform are being developed. DNA micro-arrays allow genome-wide monitoring of changes in gene expressions (typically up to 300 000 data points).
10
3.4
Visualization and Interactive Simulation
In many scientific computing problems, the complexity of both experiment and generated data is too vast to analyze analytically or numerically. For these situations, “exploration environments” provide an essential means to present and explore the data in a way that allows a researcher to comprehend the information it contains. Exploration environments combine visualization and interaction functions into one system to allow exploration of large data spaces. In static exploration environments (SEEs), the data presented to the user is time invariant; once the data is loaded into the environment, the user is presented with a visual representation of this data. If interaction with other processing modules is also allowed, however, we speak of dynamic exploration environments (DEEs). DEEs extend the static model in that the information provided to the user is regenerated periodically by an external process. The environment is then expected to provide a reliable and consistent representation of the results of the simulation at that moment and mechanisms enabling the user to change parameters of the external process. DEEs have additional obligations over SEEs, such as user interaction with other modules and time management which deals with the proper exchange of time-stamped information between components [13]. An exploration environment provides the opportunity to interact with a living simulation. This interaction can take any form; from typed input for simple types of interaction via GUIs to fully immersive virtual environments. The main feature of immersive environments (such as a CAVE) over other GUIs is that user-centered stereoscopic images are presented to a user rather than visualization centered threedimensional (3D) projections and that direct interaction with these presentations is possible. The use of such an environment is critical for the interpretation of the complex datasets that result from the various experiments within the Virtual Laboratory. Integration is achieved by modules run by the RTS, that access data from archives and supply it to dedicated interactive visualisation modules. On the other hand, resources supplied by the Grid layer can be used directly by the simulation kit to improve performance and this interactivity of the visualisation and simulation environment. As a case study to validate the concepts described above, we apply this system to a medical application: simulated abdominal vascular reconstruction. This test case contains all aspects of a DEE that are of consequence in the construction of a generic environment. Our aim is to provide a group of researchers with an environment in which they can try out a number of vascular reconstruction procedures, using patient specific angiographic data, and see the influence of these using flow simulation. 11
3.5
Distance learning proof of concept setup
A small setup consisting of a real mechanics physics experiment controlled by a computer is used to test all concepts of the VLAM-G environment. The setup contains real time control parts, data taking modules, data analysis, visualization and interpretation software and cameras for remotely inspecting the experiment when measurements are ongoing. This setup uses several different computers which have to work together to complete the experiment. Apart from proof of concept in the VLAM-G the portal may be used to provide students in high schools with access to advanced environments. Also security and authentication/authorization issues can be tested in this environment.
4
Conclusions
We have presented the design of a high performance-distributed computing platform for experimental science. The VLAM-G offers scientist easy access to Grid resources, both in software and hardware. The application of this concept has been shown to work very well for five separate scientific domains: bio-informatics, genomics, systems engineering, physics and distance learning. It has also been shown that the VLAM-G promotes reuse of existing components: • It elaborates on existing (Globus) Grid technology • It allows scientists from different disciplines to reuse generic data flow modules . Particular attention has been paid to construct a user friendly environment, using either context sensitive information, automated resource management and assistance during the design process. The latter is established by means of an assistant, which helps users during the design process by offering them pre-defined process flows for typical experiments.
Acknowledgments This work was supported by an ICES/KIS grant from the Dutch ministry of education and sciences (OC&W) and the ministry of economic affairs (EZ). It is also part of the research program of the Foundation for Fundamental Research of Matter
12
(FOM), which is financially supported by the Netherlands Organization for Scientific Research (NWO). This project includes software developed by and/or derived from the Globus project (http://www.globus.org/).
13
References [1] I. Foster and C. Kesselman. Realtime widely distributed instrumentation system. In The Grid: Blueprint for a Future Computing Infrastructure, pages 83–103. MORGAN-KAUFMANN, 1998. [2] A. Abd-Allah and B. Boehm. Reasoning about the composition of heterogeneous architecture. Technical Report UCS-CSE-95-503, University of Southern California, 1995. [3] David Garlan, Robert Allen, and John Ockerbloom. Architectural mismatch: Why reuse is so hard. IEEE software, Vol. 12(No. 6), November 1995. [4] A. Frenkel, H. Afsarmanash, G.B. Eijkel, and L.O. Hertzberger. Information management for physics applications in the virtual laboratory environment. Technical Report CS-2001-03, University of Amsterdam, 2000. [5] E.C. Kaletas H. Afsarmanesh, T.M. Breit, and L.O. Hertzberger. Expressive - a database for micro-array gene expression sutdies. Technical Report CS2001-02, University of Amsterdam, 2000. [6] E.C. Kaletas, H. Afsarmanesh, and L.O. Hertzberger. Virtual laboratory experimentation environment data model. Technical Report CS-2001-01, University of Amsterdam, 2001. [7] Rich Wolski, Neil T. Sprin, and Jim Hayes. The network weather service: A distributed resources preformance forecasting services for the metacomputing. Technical Report TR-CS98-599, UCSD, 1998. [8] E.C. Kaletas, A. Belloum, D. Group, and Z. Hendrikse. Vl-am kernel db: Database model. Technical Report UvA/VL-AM/TN07, 2000. [9] G.B. Eijkel, H. Afsarmanesh, D. Groep, A. Frenkel, and R.M.A. Heeren. Mass spectrometry in the amsterdam virtual laboratory: development of a high-performance platform for meta-data analysis. In Proceedings of the 13th Sanibel Conference on Mass Spectrometry: informatics and mass spectrometry, Sanibel Island, Florida (USA), January 2001. [10] R.D. Vis, J.L.A.M. Kramer, G.H.J. Tros, F. van Langevelde, and L. Mars. The upgraded amsterdam nuclear microprobe. In Proceedings of 3rd Int. Conf. on Microprobes, Uppsala, Sweden, 1992.
14
[11] A. Visser, A.J. van der Wees, and L.O. Hertzberger. Discrete event modelling methodology for intelligent transport systems. In Proceedings of the World congress on Intelligent Transport Systems, page paper 2016, Torino, Italy, 2000. [12] A. Visser, H.H. Yakali, A.J. van der Wees, M. Oud, G.A. van der Spek, and L.O. Hertzberger. An hierarchical view on modelling the reliability of a dsrclink for etc applications. Technical Report (submitted to IEEE Transactions on Intelligent Transportation Systems) CS-99-02, University of Amsterdam, 1999. [13] R.G. Belleman and P.M.A. Sloot. The design of dynamic exploration environments for computational steering simulations. In Proceedings of the SGI Users’ Conference 2000 (SGI’2000), Krakow, Poland, October 2000.
15
�
�
� �
�
� �
�
�
has result
Interpretation
�
�
�
�
�
�
�
�
"
�
�
"
�
�
#
�
�
�
�
�
�
�
�
�
�
�
�
�
�
�
�
�
�
�
�
�
�
�
�
�
�
�
�
�
�
�
�
�
�
�
�
�
�
�
�
�
�
�
�
�
� �
�
QualContrl
" #
�
�
�
�
� �
�
�
� �
�
�
� �
�
�
�
�
�
�
�
�
�
�
�
�
�
�
�
�
�
�
�
�
�
�
�
�
�
�
�
�
�
�
�
�
�
�
�
�
�
�
�
�
�
�
� �
�
� �
�
� �
�
� �
�
� �
�
� �
� �
�
� �
�
Data Cube
" #
�
�
#
�
� �
�
� �
�
� �
�
� �
�
� �
�
� �
� �
�
�
�
�
�
�
�
�
�
�
�
�
�
�
�
�
�
�
�
& '
&
&
�
& '
'
�
'
&
'
�
� �
�
�
�
�
�
�
�
�
�
�
�
�
�
�
� �
�
�
� �
�
�
� �
�
�
� �
�
Extraction
�
referenced by
& '
�
�
�
�
�
�
�
�
�
�
�
�
�
�
�
�
�
�
�
�
�
�
�
�
�
�
�
�
�
�
�
�
�
�
�
&
�
!
'
�
�
�
�
�
�
�
�
�
�
�
�
�
�
�
�
�
!
�
�
!
�
�
�
!
�
�
�
!
�
!
�
�
�
�
�
�
�
�
�
�
�
�
�
�
�
�
�
�
�
�
�
�
�
�
�
�
�
�
�
�
�
�
�
�
�
�
�
�
�
�
�
�
�
�
�
�
�
�
�
�
�
�
�
�
�
�
�
�
�
�
�
�
�
�
�
�
�
�
�
�
�
�
�
�
�
�
�
�
�
�
�
�
�
�
�
�
�
�
�
�
�
� �
� �
� �
�
�
!
�
�
�
�
!
�
�
�
�
!
�
Literature � �
�
�
!
�
� �
�
�
�
�
�
�
�
� �
�
� �
�
� �
�
� �
�
�
� �
�
�
� �
� �
�
�
�
�
�
�
�
�
�
�
�
�
�
�
$
$
$
%
%
%
$
$ %
%
!
�
� �
�
!
�
�
�
�
�
Raw Data File
& '
& '
�
�
�
$
$ %
%
$ %
$
$ %
%
$ %
$
$ %
%
$ %
$
$ %
%
$ %
$ %
reference to mass storage
& '
�
Surface Scan
& '
�
Apparatus
& '
�
treated smpl
has_image
� �
Conversion
� �
Settings
� �
" #
treatment
� �
" #
has source has result
Owner
� �
� �
is owner of
� �
� �
" #
�
�
Entity
� �
" #
Sample
� �
�
" #
is source of
� �
�
" #
� �
�
� �
�
" #
" #
�
� �
�
�
�
" #
" #
� �
� �
Photograph
� �
" #
� �
DC Analys
�
�
"
� �
� �
performed with
�
�
#
�
� �
�
� �
�
�
"
� �
� �
�
�
#
� �
� �
� �
�
�
"
� �
� �
�
�
#
� �
Certf. tool
�
AnalysTool
� �
Data Cube
� �
� �
performed with
� �
�
�
�
�
�
�
�
Figure 3: Typical steps in a surface-analysis study, as represented by the MACS [4] process flow. The hatched rectangles represent meta data associated with objects (either physical objects or bulk data on mass storage). Hatched ovals represent operations: cross-hatched ovals are performed using the VLAM-G Run Time System, the single-hatched ovals represent meta data associated with manually performed process steps.
16