Brain Topography, Volume 17, Number 2, Winter 2004 (© 2004)
109
Voltage-Based Versus Factor Score-Based Source Localization Analyses of Electrophysiological Brain Activity: A Comparison Luis Carretié*, Manuel Tapia*, Francisco Mercado+, Jacobo Albert*, Sara López-Martín*, and Juan M. de la Serna^
Summary: Though, traditionally, electrophysiological recordings have been limited to provide temporal information on neural activity, the development of mathematical algorithms capable of solving the inverse problem is facilitating, in recent years, the access to spatial information (i.e., on the origin of neural activation). This study explored a new strategy in order to increase the reliability of inverse problem solutions: applying these algorithms on factor scores (and not on voltages), a parameter that can be defined as "clean amplitude". Factor scores derive from Principal Component Analysis (PCA) applied to event-related potentials (ERPs). The main advantage of PCA is its capability to extract and quantify ERP components free of the influence of adjacent or subjacent components. The LORETA algorithm for source localization was applied on peak voltage, average voltage and factor scores for the motor potential recorded from 25 subjects, who had to repeatedly press a button with their right hand. The solutions given by LORETA in these three modalities were compared. The motor potential, a negative wave that begins just before any voluntary movement and is centrally distributed in the scalp, is particularly useful to the scope of this study, since its origin is known: contralateral motor cortex. Results show that the three modalities (peak voltage, mean voltage and factor scores) provided the same main focus (left motor cortex), though the "cleanest" solution (i.e., the main focus was more salient with respect to other secondary, noisy foci) was achieved by the factor score-based LORETA. Key words: ERPs; Inverse problem; Source localization algorithms; Principal Component Analysis; LORETA; Motor potential.
Introduction Historically, the information provided by non-invasive electrophysiological recordings has been circumscribed to time: they provide exact information on the precise moment in which neural processes occur (both the latency and the duration of these processes). Though no other cerebral signals exist that provide better time-related information on neural processes, it must be recognized that electrophysiological recordings have
* Facultad de Psicología, Universidad Autónoma de Madrid, Spain. + Facultad de Ciencias de la Salud, Universidad Rey Juan Carlos, Spain. ^ Facultad de Psicología, Universidad de Sevilla, Spain. Accepted for publication: October 29, 2004. This work was supported by the grant BSO2002-01980 from the Ministerio de Ciencia y Tecnología of Spain. A part of the data described in this article was presented at the Fourth Spanish Meeting of Psychophysiology (Seville, Spain, October 2004). Correspondence and reprint requests should be addressed to Luis Carretié, Ph. D., Facultad de Psicología, Universidad Autónoma de Madrid, 28049 Madrid, Spain. E-mail:
[email protected] Copyright © 2004 Springer Science+Business Media, Inc.
traditionally failed in providing precise information on space (i.e., where the neural activity is produced), which is also very important for psychophysiology and cognitive neuroscience. In the last few years, the development of algorithms of increasing mathematical sophistication capable of solving the "inverse problem" is making possible that, along with temporal information, non-invasive electrophysiological recordings provide spatial information on the cerebral origin of the recorded activity. The "inverse problem" refers to the task of deducing from the scalp-recorded electrical activity where in the brain this activity is originated (i.e., deducing the origin from the traces). Algorithms designed to solve the inverse problem are applied on direct (or filtered) voltage values of event-related potential (ERP) components (for definitions of "ERP" and "components" see, e.g., Fabiani et al. 2000). Calculating the solution to the inverse problem has several difficulties. One of them is physical: neural structures surrounding those eliciting the activity, the meninges, the skull, and the scalp, alter the electrical propagation. And some other difficulties are related to the employed methodology. Two strategies are usually employed: introducing the peak voltage in the analyses (i.e., the most positive
110
discrete value of voltage in positive deflections or the most negative discrete value of voltage in negative deflections), or introducing the average voltage value within an interval of time (or "window") that "represents" or includes the most prominent part of the deflection. This second procedure is, a priori, better than the first, since the single peak voltage may be artificially increased or decreased by noise (e.g., spontaneous brain activity, external noise, etc.), and, consequently, solutions given by source localization algorithms may be more deviated. Noise is neutralized, at least partially, when voltages within a representative window are averaged. However, both methods suffer from an important problem that may also alter the inverse problem solutions: the computation of voltage amplitudes (peak or average) made on ERP deflections may not correspond to actual components or neural processes. As recently indicated by a committee of ERP-methodology experts struck by the Society for Psychophysiological Research, "there is no a priori reason to believe that interesting aspects of cerebral processing would be reflected in these positive and negative [voltage] maxima; more complex analyses (e.g., Principal Component Analyses) are often performed in an attempt to obtain some better index of the psychophysiological processes" (Picton et al. 2000, p. 141). The fact that the determination of windows for voltage computation is usually based on the visual inspection of grand averages worsens the problem, since it is a well-known fact that grand averages sometimes "hide" some individual deflections and some others alter their actual latency (e.g., Donchin and Heffley 1978; Chapman and McCrary 1995). Indeed, it has been repeatedly recommended that the detection and quantification of ERP components should be carried out through Principal Components Analysis (PCA): see, for example, Chapman and McCrary (1995); Coles et al. (1986); Donchin and Heffley (1978); Fabiani et al. (1987). The main advantage of PCA, which has often been used in ERP research, is that it presents each component with its "clean" shape, extracting and quantifying it free of the influences of adjacent or subjacent components. The parameter in which components or factors are quantified by PCA is named "factor scores". Factor scores, which may be therefore considered as "clean amplitudes", constitute a transformation of original voltages. Basically, factor scores result from the products of original voltage points by factor coefficients. Factor coefficients reflect the extent of the association of a particular voltage point with a particular component (for details, see Dillon and Goldstein 1984; Cliff 1987; Donchin and Heffley 1978; Chapman and McCrary 1995). Though obviously the introduction of factor scores instead of voltages in source localization procedures should be particularly useful in those ERP components
Carretié et al.
altered or hidden in grand averages but detected by PCA, the best way to demonstrate the suitability of this strategy is to show its advantages even in components that are apparently well reflected in grand averages and in single ERPs. Additionally, there is no way to compare both strategies, voltage- and factor score-based source localization, if the former is not possible because the studied component is not visible in grand averages. We will employ the Low-Resolution Electromagnetic Tomography (LORETA) algorithm (Pascual-Marqui et al. 1994; Pascual-Marqui 1999) to calculate the cerebral origin of scalp-recorded electrical activity, though the proposed methodology is applicable to any other algorithm. Thus, our strategy will be to record the brain activity in response to a simple task (pressing a button) which elicits a known component (motor potential or MP). MP is a part of the complex of ERP components that precede voluntary movements (Deecke and Kornhuber 1977). These components have a known and single origin, the contralateral motor cortex (Lang et al. 1991; Jankelowitz and Colebatch 2002; Kunieda et al. 2002; Zimine et al. 2002). Particularly, the MP is maximal at Cz, over the supplementary motor area, and consists of a negative wave peaking just prior (less than 100 milliseconds) to the movement onset. Solutions given by LORETA to MP peak voltage, MP average voltage and MP factor scores will be compared.
Methods Subjects and Procedure Twenty-five students from the Universidad Autónoma de Madrid took part in this experiment. These 25 subjects (11 women) were aged between 18 and 46 years (mean 25.04; standard deviation 5.67). They took part voluntarily in the experiment and provided their informed consent to participate in it. As just explained, the experimental task was very simple, and its scope was to evoke exclusively (or at least mainly) an MP. Subjects were instructed to press a button with their right hand at "an approximate rhythm of one press every two seconds". An eight-press practice was performed in order to facilitate the achievement of this rhythm. This practice was repeated if necessary and, if not, the experimental phase began. In the experimental phase, ERPs in response to button presses were recorded. When 40 button presses were produced and recorded, subjects were informed that the task had finished. Eyes were maintained open in order to diminish alpha electroencephalographic activity, one of the most prominent noises for ERP recordings. Subjects were instructed to look continuously to a fixed point in front of them and to avoid blinking as much as possible.
Factor Score-Based Source Localization Analysis
Figure 1. Grand average at Cz, where motor potential (MP) is clearly visible (n=25). Vertical axis is located in the moment of button press onset.
Recording Electroencephalographic (EEG) data were recorded using an electrode cap (ElectroCap International) with tin electrodes. Electrodes corresponded to the following scalp locations: Fp1, Fp2, F7, F3, Fz, F4, F8, FC5, FC6, T7, C3, Cz, C4, T8, CP5, CP6, P7, P3, Pz, P4, P8, POz, O1, and O2. All scalp electrodes were referenced to nose tip. Electrooculographic (EOG) data were recorded supraand infraorbitally (vertical EOG) and from the left versus right orbital rim (horizontal EOG). Electrode impedances were always kept below 5 Kohms. A bandpass filter of 0.3 to 40 Hz was employed. The channels were continuously digitizing data at a sampling rate of 300 Hz during the complete recording session. The continuous recording was divided into 600 millisecond epochs for each trial, beginning 200 milliseconds before button press onset. A visual inspection was also carried out, epochs with eye movements or blinks being deleted.
Results Figure 1 shows vertex (Cz) grand average, which corresponds to central scalp, where the MP is clearly visible. As usual, MP is negative, maximal at central sites and it begins just before motor action. Detection and Quantification of MP Firstly, MP was quantified through its peak voltage: the most negative voltage value between –50 ms (i.e., 50 milliseconds before the button press onset) and +33.3 ms was detected for all subjects. Secondly, MP average volt-
111
Figure 2. PCA: Factor loadings after Varimax rotation. Factor 3, which is associated with MP, is drawn in black.
age was computed: the mean amplitude in the –33.3 to +16.7 ms window was calculated for all subjects. Thirdly, components explaining most ERP variance were detected and quantified through a covariancematrix-based temporal principal component analysis (PCA). As indicated in the Introduction, this technique has been repeatedly recommended for these tasks, since the exclusive use of traditional visual inspection of grand averages and voltage computation may lead to several types of misinterpretation. The decision on the number of components to select was based on the scree test (e.g., Cliff 1987). Extracted components were submitted to varimax rotation. Following this selection criterion, four components or factors were extracted from ERPs. Temporal (figure 2) and spatial (figure 3) characteristics associate Factor 3 to the wave labelled as MP in grand averages. This label will be employed hereafter to make results easier to understand. Source Localization Analyses The next step was to three dimensionally localize the cerebral regions that are responsible for the MP. As indicated, the low-resolution brain electromagnetic tomography (LORETA) was applied. LORETA is a 3D, discrete lin e ar so lu t io n f o r t h e E E G in ve r se p r ob l em (Pascual-Marqui 1999; Pascual-Marqui et al. 1994). Though in general solutions provided by EEG-based source-localization algorithms should be interpreted with caution due to their potential error margins, LORETA solutions have shown significant correspondence with those provided by functional magnetic resonance imaging in the same tasks (Vitacco et al. 2002). In its current version, LORETA refers to a three-shell spher-
112
Carretié et al.
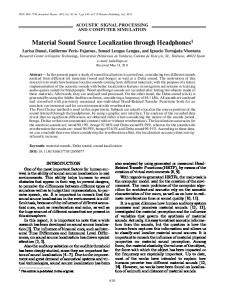
Figure 3 (Top). Scalp maps, after averaging values for MP factor scores (n=25). A=anterior, P=posterior, L=left, R=right. Figure 4 (Bottom). Images of neural activity computed with LORETA for MP peak voltage, MP mean voltage, and MP factor scores (n=25). Intensity scale is exactly the same in the three cases (linearity=30). The main focuses are represented through three orthogonal brain views in Talairach space, sliced through the region of the maximum activity. Left slice: axial, seen from above, nose up; center slice: saggital, seen from the left; right slice: coronal, seen from the rear. Talairach coordinates: x from left (L) to right (R); y from posterior (P) to anterior (A); z from inferior to superior.
Factor Score-Based Source Localization Analysis
113
Table I. Main MP foci according to peak voltage-, mean voltage-, and factor score-based LORETAs (BA=Brodmann Area). Secondary or noisy foci are also shown. Talairach coordinates: x from left to right, y from posterior to anterior, z from inferior to superior. Talairach x, y, z and Anatomical location Main Focus
2nd Focus
3rd Focus
4th Focus
5th Focus
Peak voltage-
-3, -11, 64
4, -74, 8
-52, -67, -6
-3, 52, 1
53, -46, -20
based
Dorsal/Medial BA6 BA23/BA31
BA19/BA37
BA10/BA32
BA37
Mean voltage-
-3, -11, 57
based
Dorsal/Medial BA6 BA5/BA31
Factor score-
-3, -11, 57
based
Dorsal/Medial BA6 BA5/BA31
-3, -32, 50
-3, -32, 50
ical model registered to the Talairach human brain atlas (Talairach and Tournoux, 1988). The solution is given, therefore, in three coordinates: "x" is the distance in millimeters to the right (+) or left (-) of midline, "y" is the distance anterior (+) or posterior (-) to the anterior commissure, and "z" is the distance above (+) or below (-) a horizontal plane through the anterior and posterior commissures. Thus, LORETA solutions were calculated on: a) MP peak voltage, b) MP average voltage, and c) MP factor scores. As may be appreciated in figure 4 and table I, the main focus is the same in the three cases: the dorsal/medial part of BA6, which corresponds to the left motor cortex, concretely to the supplementary motor area (SMA). SMA, which has its own somatotopic organization and intervenes in the planification of movements (e.g., Martin 2003), has been resported to be in the origin of movement-preceding ERP components (including MP): Lang et al. (1991), Jankelowitz and Colebatch (2002), Kunieda et al. (2004), Zimine et al. (2002). The secondary foci are all located out of motor-related areas of the brain, and are clearly variable or random from one method to another, so they must be considered as noisy foci (see table I). Importantly, as may be seen in figures 4 and 5, the salience of the main focus with respect to secondary foci (due to the nature of the task, that should be maximal), is different in each of the three methods. This salience has been calculated on LORETA values, a mathematical value for each focus that reflects its strength or intensity. Concretely, the (LVf1/meanLVf>1) ratio has been computed, where LV= LORETA value, f1= main focus, f>1= secondary foci. A ratio of 1 means that there is not any difference in the intensity (or LORETA value) of focus 1
60, -32, -6
-52, -67, 1
4, 45, 15
BA21
BA37
BA9/BA10
53, -60, 29
39, -53, 50
-45, -67, 15
BA39
BA40
BA39
with respect to the average intensity of secondary foci. As may be seen, the highest salience of the main focus is produced in factor score-based LORETA.
Discussion Our present findings suggest that even when grand averages do not hide or alter the component under study (produced in a very simple, low-processing demanding task), as in the present experiment, basing source localization on factor scores is an advisable strategy. As already indicated, in situations where PCA takes its maximum advantage, such as those in which direct voltages are hiding or altering a component in individual ERPs and/or in grand averages, the advisability of using factor scores in source localization analyses should obviously increase. However, this advantage of factor-score-based source localization is not obvious at first sight. Thus, our first finding is that at least in simple tasks that do not require the involvement of multiple and complex neural systems, voltage-based and factor score-based source localization analyses provide the same main focus, so any of them is valid if the scope of the research is simply to detect the principal source of activity. Secondly, though it was not among present study’s scopes, our results support the reliability of the LORETA algorithm, since it provides, in all the three methodological alternatives (peak voltage, average voltage and factor scores) the correct solution (left SMA, as explained in Results section). In relation to this, it is interesting to indicate that these correct solutions have been provided through a 24-channel recording. In other words, present results suggest that large-density arrays (e.g., 128 channels) are prob-
114
Carretié et al.
Figure 5. Salience of the main focus with respect to secondary foci (top: only the first two secondary foci are taken into account, bottom: four secondary foci are taken into account).
ably unnecessary to reach reliable solutions to the inverse problem, at least with non-complex neural processes. The third and main finding is that, if all the elements of the solutions provided by source localization algorithms are taken into account, the use of factor scores in source localization analyses provided the best result. Indeed, this
methodology better informed on the fact that the exclusive source of activity for MP was motor cortex than voltage-based analyses: this motor cortex focus is "cleaner" (i.e., more salient or distinguishable from other secondary sources) in factor-score based than in voltage-based analyses. In this same sense and at least in the present proce-
Factor Score-Based Source Localization Analysis
dural conditions, data do not show a clear advantage in using mean voltage-based source-localization analyses over using peak voltage-based analyses. It is probable, however, that peak voltage-based analyses lose their reliability, at least partially, in noisy ERP recordings. In other words, the hierarchy of reliability followed the pattern factor scores > (mean amplitude = peak amplitude). Moreover, factor scores may be submitted to spatial PCA (sPCA), a procedure that yields precise and reliable information on the scalp distribution of ERP components, and whose convergence with inverse problem solutions could constitute a valuable tool to assess their validity (see Spencer et al. 1999; Carretié et al. 2003). Our conclusion is therefore, that it is advisable to carry out source localization analyses on factor scores, at least when a complete description of implied foci is pursued. Indeed, according to present data, these solutions better distinguish between sources linked to the neural process of interest and noisy sources due to other processes.
References Carretié, L., Hinojosa, J.A. and Mercado, F. Cerebral patterns of attentional habituation to emotional visual stimuli. Psychophysiology, 2003, 40: 381-388. Chapman, R.M. and McCrary J.W. EP component identification and measurement by Principal Components Analysis. Brain Cogn., 1995, 27, 288-310. Cliff, N. Analyzing multivariate data. Harcourt Brace Jovanovich, New York, NY, 1987. Coles, M.G.H., Gratton, G., Kramer, A.F. and Miller, G.A. Principles of signal acquisition and analysis. In: M.G.H. Coles, E. Donchin and S.W. Porges (Eds.), Psychophysiology: Systems, processes and applications. Elsevier, Amsterdam, 1986: 183-221. Deecke, L. and Kornhuber, H.H. Event-related cerebral potentials and the initiation of voluntary movement. In: J.E. Desmedt (Ed.), Progress in clinical Neurophysiology, Vol. 1. Karger, Basel, 1977: 132-150. Dillon, W.R. and Goldstein, M. Multivariate analysis: Methods and applications. Wiley, Chichester, 1984. Donchin, E. and Heffley, E.F. Multivariate analysis of event-related potential data: A tutorial review. In: D. Otto (Ed.), Multidisciplinary perspectives in event related brain potential research. U.S. Government Printing Office, Washington, DC, 1978: 555-572. Fabiani, M., Gratton, G. and Coles, M.G.H. Event-related potentials: Methods, theory and applications. In: J.T.
115
Cacioppo, L.G. Tassinary, y G.G. Bernston (Eds.), Handbook of Psychophysiology, 2nd Ed. Cambridge University Press, Cambridge, 2000: 53-83. Fabiani, M., Gratton, G., Karis, D. and Donchin, E. Definition, identification, and reliability of measurement of the P300 component of the even-related brain potential. In: P.K. Acles, J.R. Jennings and M.G.H. Coles (Eds.), Advances in Psychophysiology, Vol. 2. JAI Press, London, 1987: 1-78. Jankelowitz, S.K. and Colebatch, J.G. Movement-related potentials associated with self-paced, cued and imagined arm movements. Exp. Brain Res., 2002, 147: 98-107. Kunieda, T., Ikeda, A., Ohara, S., Matsumoto, R., Taki, W., Hashimoto, N., Baba, K., Ioue, Y., Mihara, T., Yagi, K. and Shibasaki, H. Role of lateral non-primary motor cortex in humans as revealed by epicortical recording of Bereitschaftspotentials. Exp. Brain Res., 2004, 156: 135-148. Lang, W., Cheyne, R., Kristeva, R. Beisteiner, R., Lindinger, G. and Deecke, L. Three-dimensional localization of SMA activity preceding voluntary movement: A study of electric and magnetic fields in a patient with infarction of the right supplementary motor area. Exp. Brain Res., 1991, 87: 688-695. Martin, J.H. Neuroanatomy: Text and Atlas. McGraw-Hill, New York, NY, 2003. Pascual-Marqui, R.D. Review of methods for solving the EEG inverse problem. Int. J. Bioelectromag., 1999, 1: 75-86. Pascual-Marqui, R.D., Michel, C.M. and Lehman, D. Low resolution electromagnetic tomography: A new method for localizing electrical activity in the brain. Int. J. Psychophysiol., 1994, 18: 49-65. Picton, T.W., Bentin, S., Berg, P., Donchin, E., Hillyard, S.A., Johnson, R., Miller, G.A., Ritter, W., Ruchkin, D.S., Rugg, M.D. and Taylor, M.J. Guidelines for using human event-related potentials to study cognition: Recording standards and publication criteria. Psychophysiology, 2000, 37: 127– 152. Shibasaki, H., Barrett, G., Halliday, E. and Halliday, A.M. Components of the movement-related cortical potential and their scalp topography. Electroencephalogr. Clin. Neurophysiol., 1980, 49: 213-226. Spencer, K.M., Dien, J. and Donchin, E. A componential analysis of the ERP elicited by novel events using a dense electrode array. Psychophysiology, 1999, 36: 409-414. Vitacco, D., Brandeis, D., Pascual-Marqui, R.D. and Martín, E. Correspondence of event-related potential tomography and functional magnetic resonance imaging during language processing. Hum. Brain Mapp., 2002, 17: 4-12. Zimine, I., Seghier, M.L., Seeck, M. and Lazeyras, F. Brain activation using triggered event-related fMRI. Neuroimage, 2003, 18: 410-415.