Jan 14, 2002 - For Walkabout, we initially use assembly language and we plan to ..... allocate a multiple window array and simply slide the offsets of the ...... The debugger is written in the Java language and makes use of the Swing package.
Walkabout A Framework for Experimental Dynamic Binary Translation
Investigators Cristina Cifuentes Brian Lewis Interns May - Aug 2001: David Ung May - Aug 2001: Bernard Wong Jan - Jun 2001: Nathan Keynes
c 2001-2002, Sun Microsystems, Inc January 2002
2
Abstract Dynamic compilation techniques have found a renaissance in recent years due to their applicability to performance improvements of running Java-based code. Techniques originally developed for object-oriented language virtual machines are now commonly used in Java virtual machines and Java just-in-time compilers. Application of such techniques to the process of binary translation has also been done in recent years, mainly in the form of binary optimizers rather than binary translators. The Walkabout project proposes dynamic binary translation techniques based on properties of retargetability, ease of experimentation, separation of machine-dependent from machine-independent concerns, and good debugging support. Walkabout is a framework for experimenting with dynamic binary translation ideas, as well as ideas in related areas, such as interpreters, instrumentation tools, optimization and more.
Contents 1 Introduction
11
1.1
Goals and Objectives . . . . . . . . . . . . . . . . . . . . . . . . . . . . . . . . .
11
1.2
Architecture . . . . . . . . . . . . . . . . . . . . . . . . . . . . . . . . . . . . . .
12
1.2.1
The Interpreter Generator . . . . . . . . . . . . . . . . . . . . . . . . . .
15
1.2.2
The Instrumented Interpreter Generator . . . . . . . . . . . . . . . . . . .
15
1.2.3
The PathFinder . . . . . . . . . . . . . . . . . . . . . . . . . . . . . . . .
16
1.2.4
Debugging Support . . . . . . . . . . . . . . . . . . . . . . . . . . . . . .
16
Status . . . . . . . . . . . . . . . . . . . . . . . . . . . . . . . . . . . . . . . . .
17
1.3
2 Emulator Generator
19
2.1
Design . . . . . . . . . . . . . . . . . . . . . . . . . . . . . . . . . . . . . . . . .
19
2.2
Using the generator . . . . . . . . . . . . . . . . . . . . . . . . . . . . . . . . . .
19
2.2.1
Invocation . . . . . . . . . . . . . . . . . . . . . . . . . . . . . . . . . . .
20
2.2.2
Interface . . . . . . . . . . . . . . . . . . . . . . . . . . . . . . . . . . .
20
2.2.3
Making the specifications work for you . . . . . . . . . . . . . . . . . . .
20
Inside the generator - Maintainer’s notes . . . . . . . . . . . . . . . . . . . . . . .
21
2.3.1
Roadmap . . . . . . . . . . . . . . . . . . . . . . . . . . . . . . . . . . .
21
2.3.2
Generator code structure . . . . . . . . . . . . . . . . . . . . . . . . . . .
22
2.3.3
Skeleton files . . . . . . . . . . . . . . . . . . . . . . . . . . . . . . . . .
23
2.3.4
Generated code structure . . . . . . . . . . . . . . . . . . . . . . . . . . .
23
Stand-alone emulation . . . . . . . . . . . . . . . . . . . . . . . . . . . . . . . .
24
2.3
2.4
3
4
CONTENTS
2.5
2.4.1
Personality . . . . . . . . . . . . . . . . . . . . . . . . . . . . . . . . . .
24
2.4.2
SysVPersonality . . . . . . . . . . . . . . . . . . . . . . . . . . . . . . .
25
2.4.3
Stubs . . . . . . . . . . . . . . . . . . . . . . . . . . . . . . . . . . . . .
25
Performance Analysis . . . . . . . . . . . . . . . . . . . . . . . . . . . . . . . . .
26
2.5.1
Performance Analysis . . . . . . . . . . . . . . . . . . . . . . . . . . . .
26
2.5.2
Performance Experiments . . . . . . . . . . . . . . . . . . . . . . . . . .
30
3 Instrumentation of an Interpreter via Specifications 3.1
3.2
3.3
39
Instrumentation . . . . . . . . . . . . . . . . . . . . . . . . . . . . . . . . . . . .
39
3.1.1
Existing instrumentation tools . . . . . . . . . . . . . . . . . . . . . . . .
40
Instrumentation specification . . . . . . . . . . . . . . . . . . . . . . . . . . . . .
41
3.2.1
Syntax of the INSTR Language . . . . . . . . . . . . . . . . . . . . . . .
43
Appendix . . . . . . . . . . . . . . . . . . . . . . . . . . . . . . . . . . . . . . .
44
3.3.1
Listing of an Instrumentation File . . . . . . . . . . . . . . . . . . . . . .
44
3.3.2
Listing of Support Code: backbranches.cnt500.cc . . . . . . . . . . . . . .
45
3.3.3
Sample Output . . . . . . . . . . . . . . . . . . . . . . . . . . . . . . . .
47
4 PathFinder
51
4.1
Architecture Overview . . . . . . . . . . . . . . . . . . . . . . . . . . . . . . . .
51
4.2
Relocator . . . . . . . . . . . . . . . . . . . . . . . . . . . . . . . . . . . . . . .
53
4.3
Building . . . . . . . . . . . . . . . . . . . . . . . . . . . . . . . . . . . . . . . .
54
4.4
Future Work . . . . . . . . . . . . . . . . . . . . . . . . . . . . . . . . . . . . . .
54
4.4.1
Fragment Linking
. . . . . . . . . . . . . . . . . . . . . . . . . . . . . .
54
4.4.2
Optimisations for V9 . . . . . . . . . . . . . . . . . . . . . . . . . . . . .
55
5 Debugger 5.1
57
Overview of Design . . . . . . . . . . . . . . . . . . . . . . . . . . . . . . . . . .
57
5.1.1
Graphical Section . . . . . . . . . . . . . . . . . . . . . . . . . . . . . . .
58
5.1.2
Emulator Connection Section . . . . . . . . . . . . . . . . . . . . . . . .
58
5.1.3
Disassembler Section . . . . . . . . . . . . . . . . . . . . . . . . . . . . .
58
CONTENTS 5.1.4 5.2
5 Debugger Preprocessor . . . . . . . . . . . . . . . . . . . . . . . . . . . .
59
Current Status . . . . . . . . . . . . . . . . . . . . . . . . . . . . . . . . . . . . .
59
A Building Walkabout
61
A.1 Compilers and Tools Needed to build Walkabout . . . . . . . . . . . . . . . . . .
61
A.1.1 Special tools needed to build Walkabout . . . . . . . . . . . . . . . . . . .
61
A.2 Configuration Notes . . . . . . . . . . . . . . . . . . . . . . . . . . . . . . . . . .
62
A.3 Configuring Tools from the Walkabout Framework . . . . . . . . . . . . . . . . .
63
A.3.1 Generating Interpreters . . . . . . . . . . . . . . . . . . . . . . . . . . . .
63
A.3.2 Generating PathFinder . . . . . . . . . . . . . . . . . . . . . . . . . . . .
65
A.3.3 Generating the Walkabout Debugger . . . . . . . . . . . . . . . . . . . . .
66
A.3.4 Building without the --with-remote Option . . . . . . . . . . . . . .
66
A.4 How the Configuration Process Works . . . . . . . . . . . . . . . . . . . . . . . .
67
A.4.1 Dependencies and make depend . . . . . . . . . . . . . . . . . . . . .
67
A.4.2 Warnings from make . . . . . . . . . . . . . . . . . . . . . . . . . . . . .
68
A.4.3 Where the Makefile Rules Are . . . . . . . . . . . . . . . . . . . . . . . .
68
A.5 The Walkabout Regression Test Suite . . . . . . . . . . . . . . . . . . . . . . . .
69
A.5.1 Running the Regression Tests . . . . . . . . . . . . . . . . . . . . . . . .
69
A.5.2 Running the Tests in Parallel . . . . . . . . . . . . . . . . . . . . . . . . .
70
Bibliography
75
6
CONTENTS
List of Figures 1.1
The Architecture of the Walkabout Framework . . . . . . . . . . . . . . . . . . .
13
1.2
The 2001 Walkabout Framework . . . . . . . . . . . . . . . . . . . . . . . . . . .
14
1.3
The Interpreter Generator Genemu . . . . . . . . . . . . . . . . . . . . . . . . . .
15
1.4
The Instrumented Interpreter Generator . . . . . . . . . . . . . . . . . . . . . . .
16
1.5
PathFinder: The Implementation of the 2001 Walkabout Framework . . . . . . . .
17
2.1
Previous performance evaluation of the C++ version of the emulator taken from Nathan Keynes’ presentation slides . . . . . . . . . . . . . . . . . . . . . . . . . .
27
2.2
Comparison and evaluation of different profilers for use with the C++ based emulator 27
2.3
Breakdown of cycles spent in functions called from main of the emulator - sieve
28
2.4
Breakdown of cycles spent in functions called from main of the emulator - banner
29
2.5
Ten most time consuming functions of the emulator when running the sieve3000 program . . . . . . . . . . . . . . . . . . . . . . . . . . . . . . . . . . . . . . . .
29
Performance improvements due to inlining of the execute and decode* functions. Test performed on a 4 CPU Sun Ultra-80, with low load . . . . . . . . . . . . . . .
31
Performance difference of JNI and Unsafe based versions of emulator. Test performed on a 4 CPU Sun Ultra-80, with low load . . . . . . . . . . . . . . . . . . .
33
PathFinder: The Implementation of the 2001 Walkabout Framework . . . . . . . .
52
A.1 Names of Machines and Versions Supported by the Walkabout Framework . . . . .
62
A.2 Configure Options . . . . . . . . . . . . . . . . . . . . . . . . . . . . . . . . . . .
63
2.6 2.7
4.1
7
8
LIST OF FIGURES
Preface The Walkabout project was an initial investigation conducted in 2001 at Sun Labs in relation to dynamic binary translation. The project ran for 9 months and was led by Cristina Cifuentes, with input from 3 different interns; Nathan Keynes, David Ung and Bernard Wong, and one other researcher, Brian Lewis. Walkabout was built based on ideas from the UQBT project (see http://www.itee.uq.edu. au/csm/uqbt.html, and as such aimed at retargetable experimentation through specification of features of machines. In fact, the New Jersey Machine Code SLED specifications and the UQBT SSL specifications were reused to automatically generate disassemblers and interpreters for the SPARC and x86 architectures. We hope that others will make use of the framework; many types of experimentation can be done with the current design and its partial implementation. Cristina Cifuentes Mountain View, California 14 Jan 2002
9
10
LIST OF FIGURES
Chapter 1
Introduction Design: Cristina [2001]; Documentation: Cristina, Brian [Jan 2002]
Binary translation, the process of translating binary executables1 makes it possible to run code compiled for source platform Ms on destination platform Md . Unlike an interpreter or emulator, a binary translator makes it possible to approach the speed of native code on machine Md . Translated code may run more slowly than native code because low-level properties of machine Ms must often be modeled on machine Md . For example, the Digital Freeport Express translator [8] simulates the byte order of SPARC architecture, and the FX!32 translator [24, 15] simulates the calling sequence of the source x86 machine, even though neither of these is native to the target Alpha architecture. The Walkabout framework is a retargetable, dynamic binary translation framework for experimentation with dynamic translations of binary code. The framework grew out of the UQBT framework [4, 3, 5], by taking what we had learned in the areas of retargetability of binary code and separation of machine-dependent from machine-independent concerns, and applying such techniques to the new dynamic framework. Clearly, the choice of transformations on the code would need to be different due to the differences between dynamic and static translations.
1.1 Goals and Objectives Binary translation requires machine-level analyses to transform source binary code onto target binary code, either by emulating features of the source machine or by identifying such features and transforming them into equivalent target machine features. In the Walkabout system we plan to 1 In this document, the terms binary executable, executable, and binary are used as synonyms to refer to the binary image file generated by a compiler or assembler to run on a particular computer.
11
12
Introduction
make use of both types of transformations, determining when it is safe to make use of native target features. One question that is hard to answer before experimenting in a system is that of the choice of intermediate representation. In the UQBT system we made use of RTLs and HRTLs; the former being a register transfer language that made explicit every transfer of control, and the latter being a high-level register transfer language that resembled simple imperative languages, where control transfers are made explicit. It is unusual for a binary translation system to make use of two different representations for instructions. Other binary translation systems have made use of the assembly language as the intermediate representation, mainly due to the fact that such systems were generating code for the same machine (i.e. they were optimizers of binary code rather than binary translators per se). Such systems include Dynamo [1], Wiggins/Redstone [19], and Mojo [2]. For Walkabout, we initially use assembly language and we plan to use RTL as the next step, though we would like to experiment with its suitability and ease of translation into a target representation, after all, RTLs are still machine-dependent. The goals of the project are: � to derive components of binary translators from machine descriptions, � to understand how to instrument interpreters in a retargetable way, � to determine whether an RTL representation is best suited for machine translation, and how to best map Ms -RTLs to Mt -RTLs, � to understand how debugging support needs to be integrated in a dynamic binary translation system, and � to develop a framework for quick experimentation with ideas in the dynamic binarymanipulation area .
We limit binary translation to user-level code and to multiplatform operating systems such as Solaris and Linux.
1.2 Architecture The architecture of the Walkabout framework borrows from the architecture of most existing dynamic compilation systems such as those for the object-oriented languages Smalltalk [11, 6], SELF [26, 14] and Java [13, 12, 18]. The idea is simple. Based on the premise that most programs
1.2 Architecture
13
spend 90% of the time in 10% of the code, the dynamic compilation system should only consider compiling that 10% of the code and interpret the rest of the code base, as it is not executed too often.
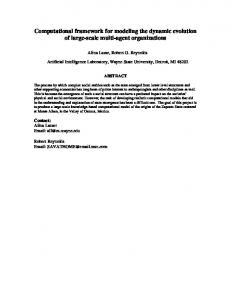
M s -> M t Translator
M t Code Generator
M t F$ M s Interpreter
M t Optimizer Dispatcher
Ms binary file
Figure 1.1: The Architecture of the Walkabout Framework
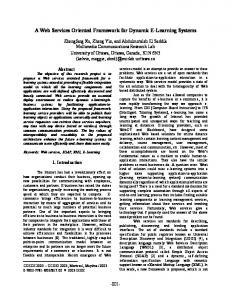
Figure 1.1 illustrates the architecture of the system. The source binary program is initially interpreted until a hot path is found. Code is generated for that hot path and placed into a (translated) instruction cache (called fragment cache or F$ in our notation). Once the generated code is executed, control transfers to the interpreter to interpret more code, and the process repeats for pieces of code that have not been interpreted or translated as yet. For pieces of code that have been translated, the translated version in the instruction cache is executed instead. Further, if a particular piece of translated code is executed too often, the code can be reoptimized and new, efficient code can be generated. The 2001 Walkabout implementation does not implement the complete framework. This document and the present open source release are the results of a 9-month experiment conducted with interns, hence, only parts of the system are in place. Figure 1.2 illustrates the 2001 Walkabout implementation. As can be seen, code generation was for the same family of machines, the SPARC architecture in this case, where SPARC V9 code was generated for SPARC V8 source binaries.
14
Introduction
M s Code Generator
M s F$
M s Interpreter
Dispatcher
Ms binary file
Figure 1.2: The 2001 Walkabout Framework
Applications of the Walkabout Framework The Walkabout framework can be used to build dynamic translators having a wide range of uses. For example, it supports the construction of analysis and instrumentation tools that insert code during translation in order to understand the behavior of running programs. These tools can do basic block counting and profiling. They can also record dynamic memory accesses, branches taken or not, and instruction traces. The data they collect can be used to drive related tools such as pipeline and memory system simulators. Systems using dynamic translation for instrumentation include ATOM [23] and Vulcan [22]. Walkabout can also be used to build optimizers: dynamic translators that improve the performance of programs. Several examples of program optimizers were given above. Also, Schnarr and Larus [20] describe how rescheduling legacy code for newer processors with different pipelines can significantly improve performance. Other applications of Walkabout include machine emulators and program checkers. Machine emulators give executing programs the illusion that they are running on a different machine. They can be used to run legacy programs on newer hardware and to simulate new machines on existing hardware. An example of the latter is the Daisy [9] system. Program checkers execute programs while continuously checking that they operate correctly or safely: for example, that they reference only allowed memory locations, or execute only allowed system calls.
1.2 Architecture
15
As an example of the latter, the STRATA [21] dynamic translation system has been used to enforce a number of different software security policies.
1.2.1 The Interpreter Generator We always thought that the UQBT machine descriptions for syntax and semantics of machine instructions were complete enough to support the generation of interpreters for user-level code. The user-level code restriction is imposed by the SSL descriptions, which only describe user-level instruction semantics. This decision was inline with the goals of the UQBT project. We took the syntactic (SLED) and semantic (SSL) descriptions for the SPARC and x86 architectures and experimented with the automatic generation of interpreters for these two machines. Figure 1.3 illustrates the process. M s SLED
Interpreter Generator M s SSL
M s Interpreter (C)
M s Interpreter (Java)
Figure 1.3: The Interpreter Generator Genemu The interpreter generator, genemu, parses SLED and SSL specifications for a machine, knows how to decode ELF binary files, and generates an interpreter for that machine in the C or Java language. As reported in Chapter 2, the C-based interpreters were tested against the SPEC95 integer benchmarks, whereas the Java-based interpreters were tested against smaller benchmarks as they took so long to run. More explanation about this subsystem is given in Chapter 2. Note that the documentation makes use of the term “emulator” to refer to the “interpreter”.
1.2.2 The Instrumented Interpreter Generator We were interested in experimenting with different ways in which we could determine hot paths within an interpreter, hence we designed an instrumentation language, INSTR, which was used in conjunction with the emulator generator in order to generate interpreters that instrumented the code
16
Introduction
in the way specified in our INSTR spec. In this way, we could quickly specify different ways of instrumenting code and automatically generate interpreters instrumenting in the scheme of choice. Figure 1.4 illustrates the process. M s SLED
Instrumented Interpreter Generator
M s SSL
M s Instrumented Interpreter
INSTR i
Figure 1.4: The Instrumented Interpreter Generator The instrumented interpreter generator, genemu i, is an extension of genemu, which parses SLED and SSL machine descriptions, as well as the INSTR instrumentation description, and generates an interpreter for that machine which would instrument instructions in the way specified in the INSTR spec. The instrumented interpreter was generated in the C language. More explanation about this subsystem is given in Chapter 3.
1.2.3 The PathFinder The 2001 Walkabout implementation is what is referred to as the pathfinder. The PathFinder implements Figure 1.5, which interprets SPARC V8 (and a few V9?) instructions, uses one of four different instrumentation schemes to determine hot paths, and generates SPARC V9 code for those hot paths into a fragment cache. The PathFinder was tested against some SPEC95 and SPEC2000 benchmarks. More explanation about this subsystem is given in Chapter 4.
1.2.4 Debugging Support One of the goals of the Walkabout project was to provide for better debugging support than its UQBT counterpart. A debugger was built to integrate with the other components of the Walkabout system, relying on the automatic generation of the disassembler and the interpreter. The Walkabout debugger is a Java language GUI tool that provides several windows to display the assembly instructions of the program, as well as its state (i.e. register contents). Users can set breakpoints and run the program to a given state.
1.3 Status
17
SPARC V9 Code Generator
SPARC V8 Interpreter
SPARC V9 F$
Dispatcher
SPARC V8 binary file
Figure 1.5: PathFinder: The Implementation of the 2001 Walkabout Framework More information about debugging support is given in Chapter 5.
1.3 Status The 2001 Walkabout implementation consisted of 16 man-months over a period of 9 months. The project was led by Cristina Cifuentes, and several interns worked on the implementation of different components; namely, Nathan Keynes worked on the emulator generator, Bernard Wong worked on the debugger and disassemblers, and David Ung worked on the hot path instrumentation and code generator. Brian Lewis investigated its debugging and testing support, framework applications, and helped design portions of the emulator generator.
18
Introduction
Chapter 2
Emulator Generator Design: Nathan, Cristina; Implementation: Nathan; Documentation: Nathan [Apr 01]
This chapter documents the inner-workings of the emulator generator for the Walkabout framework. It describes design issues and concentrates on interfaces and usage of the emulator generator tool. This chapter documents the initial version of the emulator generator rather than the release version (i.e. it has not been fully updated) [Cristina, Jan 2002].
2.1 Design The main design goals of building an emulator for Walkabout, were retargetability, reuse of existing specifications, and efficiency. This has been achieved by making use of an emulator generator, which accepts the SLED and SSL specifications, and outputs source code for an emulator core, in either the C or Java language. With the addition of some simple scaffolding, the result is an easily retargetable emulation system. Another goal for the emulator generator was to allow users to create emulators without needing to write them in assembler language or even know the assembler of the machine where the emulator is to be run.
2.2 Using the generator This section explains the way an emulator can be generated, what its interface is and what to know in order to make changes to the code generation module. 19
20
Emulator Generator
2.2.1 Invocation The emulator generator is called genemu and it is invoked in the following way: genemu [options] [outputfile] Recognized options: -c output C code [default] -d disassembler only (do not generate emulator core) -j output Java code
2.2.2 Interface The generated code exports one fundamental function, void executeOneInstruction(), which completely executes the instruction pointed to by the current PC. The emulator expects a pointer mem to have been set up to refer to the start of the emulated program’s address space. The CPU registers are exported as regs, which is a RegisterFile structure (defined in the generated header file). Note that right now it’s not always simple to know a-priori how to access a given register from outside the core, although %pc should always be regs.r pc. If the SSL specification makes use of traps, the calling code must also define a callback, of the form void doTrap( bool cond, int trapNumber ); where cond indicates whether the trap should execute, and trapNumber gives the trap id. A minimal use might look something like char *mem; int main() { mem = loadBinary(); regs.r_pc = getStartAddress(); run(); /* Supplied by generated emulator */ }
2.2.3 Making the specifications work for you In order to do what it’s supposed to do, the emulator generator relies on certain correlations between the SLED and SSL files that it’s using. This section documents those requirements.
2.3 Inside the generator - Maintainer’s notes
21
The primary requirement is that in general all names must be the same (modulo case). This means instruction names are the same, and register names are the same. Additionally operand names which appear in the SSL file must be defined as fields in the SLED file, but need not necessarily appear in the actual instruction constructor. Also, an operand which is used as a register index (i.e. appears inside an r[] expression), must be defined in the SLED as a field with register names. Limitations: Assigning to an operand is not currently supported in Java.
2.3 Inside the generator - Maintainer’s notes 2.3.1 Roadmap The directory structure for the emulator generator code is as follows. include/ codegen.h codegenemu.h codegen c.h codegen java.h sledtree.h
Abstract class declarations for CodeGenApp and CodeGenLanguage Main header for emulator generation Header file for C language support Ditto for Java (inherits from C) Declaration of the SLED AST classes
tools/
emu/
codegen.cc codegen c.cc codegen java.cc
Generic methods for CodeGenApp and CodeGenLanguage Methods for C language support Ditto for Java
gendasm.cc gendecode.cc genemu.cc genregs.cc genss.cc
Methods for generating disassembly functions Methods for generating instruction decoders (via NJMC) Main function, and initialization Register structure computations Semantic String / instruction handling
sledscanner.l sledparser.y sledtree.cc sledtest.cc match.cc
Lexical specification for SLED files (lex) Syntax specification and ast construction for SLED files (yacc) Methods for SLED AST, and some tree construction support Main function for testing SLED routines Simple code to generate NJMC-style matching statements
22
Emulator Generator emumain.cc sparcmain.java
The emulator’s main The emulator’s main for Java-based version
personality.h personality.cc linux.cc solaris.cc
Base class for the OS Personality Implementation of the base Personality class Linux personality implementation Solaris personality implementation
sparcemu.h sparcemu.m sparcemu.cc
Emulator interface file for the SPARC architecture Emulator implementation file for the SPARC Generated file from sparcemu.m
instrsparcstub c.cc sparcstub c.cc sparcstub java.cc x86stub c.cc
C language stub methods for the SPARC architecture C language SPARC stub methods Java language SPARC stub methods C language x86 stub methods
sysv.cc
SysV loader and process initializer
tools/runtime/ emuskel.c emuskel.h emuskel.java
Emulator implementation file skeleton for C Emulator interface file skeleton for C Emulator implementation file skeleton for Java
2.3.2 Generator code structure Conceptually, the generator is separated out into the following pieces: � Language neutral, abstract application base class (CodeGenApp) � Main emulator implementation (CodeGenEmu) � Application neutral language support classes (CodeGenC, CodeGenJava) � Skeleton files (emuskel.c, emuskel.h, emuskel.java, etc)
After parsing it’s input, the generator reads in the specification files given to it, and computes the register structures. Then it reads and processes each skeleton file in turn, writing to the given output file and substituting in the actual code as it goes.
2.3 Inside the generator - Maintainer’s notes
23
All actual code is generated by calls through lang, which is an instantiation of CodeGenLanguage1 The skeleton logic is all generic, and so is implemented in CodeGenApp.
2.3.3 Skeleton files The skeleton files are processed by reading them line by line, substituting for any variables found, and writing out again. Variables are implemented similarly to the Unix shell, and can be specified as either $VARNAME or $fVARNAMEg. Variable names may only contain alphanumeric or underscore characters. There is also a simple built-in conditional generation mechanism @SECTION ... @SECTION will be generated if and only if the SECTION section is active, whereas @!SECTION ... @!SECTION will be generated if and only if the SECTION section is inactive. In either case the conditional directives themselves will not be copied to the output.
2.3.4 Generated code structure The emulator generator normally creates 2 files - interface (ie .h) and implementation (.c). (In the case of the Java language, it obviously only generates a single output file). The interface file contains some basic typedefs and function prototypes, along with the declaration of the main register structure (RegisterFile). The guts are of course in the implementation file - This is roughly divided into prologue (general macros), disassembler, parameter decoding (mapping register parameters to registers, and breaking up complex operands), instruction routines (one execute routine per instruction), the main execute() function (essentially instruction decode and dispatch), and finally the exported executeOneInstruction() routine, which handles the main fetch-execute cycle (1 cycle’s worth). 1 At least, all code should be generated in this way. Currently there are still quite a few places where operators are inserted directly, which would need to be fixed to support less C-like languages.
24
Emulator Generator
The disassembler and decoder both depend heavily on the New-Jersey Machine Code toolkit (NJMCTK) to generate the real decoders – the generator itself just produces (long) match statements for these parts, in the form of .m (matching) files which NJMCTK translates into .cc files.
2.4 Stand-alone emulation In order to test the emulator properly (and transitively the specifications), it’s useful to be able to run it in isolation from the rest of Walkabout, ie to completely emulate a binary application. The emulator source generated from this tool is obviously not capable of doing this by itself - it needs support to load binary files, handle operating system calls, etc. Included in the emu/ directory is a small set of files to provide the needed infrastructure. Currently it contains support for Solaris and Linux platforms (at least partially, more work is needed for completeness), and stubs for SPARC and x86. In order to support a new CPU core with these platforms, it is only necessary to generate an emulator with the toolkit, and write a small stub file. The task of the latter is to supply routines to set the stack pointer, setup the program counter, and most importantly handle parameter passing to and from system calls. (We currently make the unsupported assumption that there is a standard for this on each CPU architecture - when adding more platforms these stub files will undoubtedly need to handle multiple conventions). In the case of a Java-based CPU core, the stub file is also responsible for thunking certain calls through to the Java runtime environment.
2.4.1 Personality The Personality class (and subclasses thereof) is responsible for the loading of binary files, initial stack setup, and syscall handling—in other words for imitating the normal behaviour of the kernel on a real system. Personality in itself only supplies a few utility and factory methods; each subclass is responsible for implementing two key methods: � bool execve( const char *filename, const char **argv, const char **envp ) � int handleSyscall( int callno, int *parms )
execve behaves exactly as the POSIX standard execve function, except that the caller retains control, and it does not actually start running the process (which can be done by executing run() as described later). handleSyscall is called from the relevant stub file whenever the CPU core encounters the architectural equivalent of a SYSCALL instruction, with the number of the syscall,
2.4 Stand-alone emulation
25
and an array of up to 6 parameters. The handleSyscall function should return the result of the call in the first parameter, possibly setting the carry flag via setReg CF().2 Note that this is indeed somewhat biased towards Unix and Unix-like systems, however at least currently that includes all systems of interest. It also seems likely that most other systems could be mapped to make use of this interface. In addition to being a base class for OS-specific behaviour, Personality supplies some basic functions for dealing with the process memory image - in particular all memory accesses from subclasses should be routed through the putUser* / getUser* functions, as they ensure correct byte ordering.
2.4.2 SysVPersonality As a convenience, due to the large amount of overlap between modern Unix-like systems, the class SysVPersonality (sysv.cc) was introduced to contain the common parts. This is primarily an implementation of execve, which is a largely standard (and rather non-trivial) process on systems supporting the ELF file format. Note that the BinaryFile API used in UQBT is not used here, as rather lower-level information is needed by the loader. SysVPersonality also creates one new abstract method int handleAuxv( AUXV_T *auxv ) which permits subclasses to add additional items to the process image’s auxiliary vector (is passed pointer to first free vector, returns number of items added ). Note that there are some small machine dependencies which have to do with the exact stack layout. Adding a new architecture to the emulator may require adding an entry to the switch here (unfortunately this seems unavoidable).
2.4.3 Stubs As previously mentioned, a stub file needs to be written for each CPU architecture (and for each language, for that matter). A list of these functions is at the top of personality.h, but a quick description may be useful � setReg pc(int) Set the program counter to the given value, so that execution resumes from that point. 2 On architectures which expect the parameters to be returned unchanged, the stub file is responsible for making a copy of them.
26
Emulator Generator � setReg sp(int) Set the stack pointer to the given value � setReg CF(int) Set the carry flag to true/false if the value is non-zero/zero � initCore() Initialize the processor core (normally a no-op for C cores) � setMem(char *) Set the memory base for the emulator core � run() Begin execution - run until told to stop � stop(int) Terminate execute with the given exit value � getArchitecture() Return an ID code corresponding to the CPU architecture being emulated � getDefaultPersona() Return a personality ID representing the “default” platform for a given architecture (ie Solaris for SPARC, Linux for x86) � dumpMainRegisters(FILE *) Dump the main CPU registers to the given stream.
2.5 Performance Analysis Implementation: Bernard; Documentation: Bernard [May 2001]
This section documents the performance analysis that was done on the emulators generated by the emulator generator, with emphasis on the SPARC emulator. Descriptions of performance analysis tools and results using different tools and techniques are given. Note that these experiments were run in May 2001, prior to completion of the emulator generator’s final form.
2.5.1 Performance Analysis From previous performance evaluation work that had been done by Nathan Keynes, the approximate performance of the emulator is known (see Figure 2.1). From this work, we know that the current emulator is approximately 77 times slower than a natively executed program. Profiler Breakdown To get a better understanding of where the extra time is spent, profiling of the emulator need to be done. First an appropriate profiler need to be chosen for the task.
2.5 Performance Analysis
27
Emulated Program 099.go 124.m88ksim 129.compress95 130.li 132.ijpeg 134.perl 147.vortex Mean
Slow down from native 66.85x 96.51x 77.32x 70.1x 112.49x 63.67x 68.82x 77.79x
Figure 2.1: Previous performance evaluation of the C++ version of the emulator taken from Nathan Keynes’ presentation slides
Gprof
Quantify
Shade
Pros � Easy to setup and use � Gives information of time spent in each function � Shows function trace of the application
Pros � Gives a nice graphical call graph � Very detail breakdown of function usage
Pros � Poweful tool for creating custom profilers � Can be used to analyse specific instructions or instruction sets
Cons � Groups time spent in each function with time spent in function’s children � Text based function trace very hard to follow
Cons � Proprietary tool where the data gathered can only easily be viewed within the program
Cons � Very large amount of work required to create custom profiler
Figure 2.2: Comparison and evaluation of different profilers for use with the C++ based emulator
Three different profilers were evaluated - gprof, quantify and Shade. A brief summary of each tool can be found in Figure 2.2. From the limited profiling requirements of the project, a tool such as Shade is far more complex and time consuming than necessary. Most of the important information from profiling are given by much easier to use tools such as gprof and quantify.
28
Emulator Generator
Although gprof gives enough information to meet most of the profiling needs for the emulator, quantify can give the same information as gprof but in greater detail and in a graphical environment. The proprietary nature of the quantify tool is not a large concern as the data set gathered does not need to be further analysed by other tools. Therefore, quantify was used to perform the remainder of the profiling for the C++ version of the emulator.
VM Overhead The first data set that needs to be gathered is relationship between the time spent in the actual emulation of the code and the overhead in creating the environment necessary for the emulation. Figure 2.3 is a profile of the functions called from main in the emulator and the amount of cycles spent in each of these functions and their descendents. The program that the emulator is running is the sieve program, generating the first 3000 primes. The sieve program is compiled with an optimization of O4 with gcc 2.81. Functions Called from Main executeOneInstruction BinaryFile::Load runDynamicLinker initVM atexit Total Cycles
Cycles (w/descendants) 851,395,870,815 21,582,646 68,794 22,423 398 851,417,545,076
Figure 2.3: Breakdown of cycles spent in functions called from main of the emulator - sieve
From this data, it can be seen that more than 99% of the time is spent executing the actual emulation code. However, sieve is a relative small program with a size of only 24,452 bytes and requires a relatively large amount of CPU cycles. A larger program that requires a smaller amount of CPU cycles will not fare as well. Figure 2.4 shows the cycle breakdown of the banner program displaying the word “yo”, an example of a program that requires much fewer CPU cycles. The size of the banner executable is 6,084 bytes compared to the size of the sieve executable which is 24,548 bytes. With the analysis of the banner program, we see that only 73% of the time is spent executing the actual emulation code. However, much of this time is spent in loading the executable which is unavoidable as even a natively executing program must spend time loading itself into memory. However, the efficiency of the loader compared to the native OS loader is currently unknown and requires further analysis.
2.5 Performance Analysis
29
Functions Called from Main executeOneInstruction BinaryFile::Load runDynamicLinker initVM atexit Total Cycles
Cycles (w/descendants) 6,515,532 2,350,321 70,200 22,821 398 8,959,272
Figure 2.4: Breakdown of cycles spent in functions called from main of the emulator - banner
A reasonable conclusion can be made that, although the efficiency of the emulator’s binary loader is not known, it cannot account for much of the overall performance slowdown of the emulator.
Child Functions Breakdown In order to further analyse the performance of the emulator, a list of the most time consuming functions were generated to see where the emulator is spending most of its time. Figure 2.5 is a list of the ten most time consuming functions as seen from running the sieve3000 program. Functions execute executeOneInstruction executeSUBCC decodereg or imm executeADDCC decodeeaddr executeRESTORE executeSAVE executeORCC executeOR executeBL
% Time 40.16 16.86 10.57 8.62 5.09 2.86 2.39 2.32 2.10 1.12 0.94
# of times called 6,010,495,867 6,010,495,867 737,516,466 3,139,748,631 342,876,189 660,334,656 94,237,151 94,237,151 383,153,136 565,495,820 401,856,672
Figure 2.5: Ten most time consuming functions of the emulator when running the sieve3000 program
A few noticeable patterns can be seen from the function breakdown in Figure 2.5.
30
Emulator Generator 1. Most of the time is spent in the execute function. This function is used to match the instruction bit patterns to the assembly equivalent for the source machine. For every instruction that needs to be executed, one iteration of the execute function is required. Since the matching of the bit patterns requires significant amount of branches and also because of the frequency of this function call, it is not surprising that this function takes a significant amount of the processing time. 2. The function executeOneInstruction also required a significant amount of time. Again, this is because this function is called once for every instruction that must be executed. 3. The amount of function calls of the top ten functions alone is staggering as the same functions are called over and over again. Since each function itself requires very little time to execute, all of these functions are good potential targets for inlining. 4. Functions that require the manipulation of conditions codes such as executeSUBCC, executeADDCC, and executeORCC require a significant amount of execution time even though the frequency of these instructions are relatively low for the SPARC architecture. This indicates that each of these instructions require a significant more time to execute than their counterparts that do not require condition codes. 5. The two decoding functions decodereg_or_imm and decodeaddr both are called a significant amount of time and take up more than 10% of the total execution time. These decode the compound matchining statments reg_or_imm and eaddr from the SPARC spec. 6. The two functions executeRESTORE and executeSAVE are called very infrequently as they are only needed on function calls and returns in the original source program. However, they both take up a significant amount of time which indicates that they both are very time consuming functions and perhaps an area that can be optimized.
2.5.2 Performance Experiments Inlining Functions In order to reduce the amount of function calls, all the execute* and decode* functions were inlined. This will in effect cause the bulk of the emulator to be compiled and executed and one large function. The benefits of this is the elimination of saving and restoring registers and also allows the compiler to perform greater amount of optimizations. As can be seen from Figure 2.6, the effects of inlining is a noticeable increase in performance in the range of 10%.
2.5 Performance Analysis Program Executed SPEC95 130.li sieve-3000 fibonacci-32
31 Original Emulator 3h 22m 49s 19m 29s 14.4s
Modified Emulator 2h 47m 52s 16m 45s 13.2s
% Time Saved 17% 14% 8%
Figure 2.6: Performance improvements due to inlining of the execute and decode* functions. Test performed on a 4 CPU Sun Ultra-80, with low load
Bitwise Operation Simplification To address the issue of time consuming condition code manipulating functions, much of the condition code addressing areas have been analysed and redundancies have been removed. For example, many of the condition code manipulation required accessing a particular bit in a variable. The majority of this bit access is to the same bit. However, in order to access this bit, a very cumbersome but generic operation is used. #define BITSLICE(x,lo,hi) (((x) & ((1LLlo) where hi and lo are both 31. This was replaced with the following #define BITPICK(x,lo,hi) (((uint32)x) >> 31) However, later analyse of the assembly code shows that the compiler when set at a reasonable level of optimization will already perform this type of conversion. Register Window Modifications The executeSAVE and executeRESTORE operations contributed a significant amount of execution time yet were called only a small amount of times. This can be due to the register window implementation of the emulator where there only exist one window. Therefore, every save and restore operation will require spilling out and reading from the stack, which results in a significant amount of memory operations. A true sliding register window would require far less memory operations. However, due to the SSL and SLED based nature of the emulator, a true sliding register window implementation can not be easily accomplished. Currently, the global registers are stored in the same array as the window registers. Therefore, attempts to allocate a multiple window array and simply slide the offsets of the array would cause references to the global registers to be incorrect.
32
Emulator Generator
Logic can be added to every register operation to determine whether the register in question is a global register. However, the performance hit of this was considered to be too significant and further experimentation in an overlapping sliding register windows was not investigated. A non-overlapping sliding register windows implementation was implemented as the work required is significantly less. In this implementation, the in and out registers are not overlapped. The window actually slides by 32 registers and the values of the global and the in/out registers are copied to the new position. Therefore, all registers are in the correct position and no additional logic is required to determine whether a register is global. However, in performance evaluation, the performance had actually decreased by roughly 10%. The reason is due to the signal handlers, which save and restore the CPU context at every signal. When this occurs, the whole register window is saved, and since the register window is now signficantly bigger, the context save and restore time is significantly slower and therefore there exists a performance decrease with this implementation.
Java Emulator Analysis The current performance of the Java-based emulator is approximately 15 times slower than the C++ version of the emulator3 . In order to investigate the reason for the additional performance slow down, profiling of the Java emulator needs to be done. The Java version of the emulator was original written with a C++ front end that loads a JVM and then calls the Java code. In order to profile the Java code, the emulator must be modified to start as a Java program. Re-implementing the emulator only required approximately one working day and allowed the use of a Java profiler on the code. It is also a cleaner implementation as it only uses JNI to use C++ binary loading libraries instead of relying on C++ code much more as in the original version. Performance comparison shows that this new version performed comparably to the original version. The profiler built into the JDK 1.4 was used to analyse the emulator. However, the profiler was not initially working correctly as no data was produced by the profiler. After investigation, it was found that the reason behind the profiling problems was due to an incorrect interpretation of the system call exit. Normally, the emulator will trap the exit system call and then will perform an exit. Unfortunately, this action will also kill the profiler process before it has a chance to output the data it gathered. To remedy this, the emulator will perform a Java System.exit call instead of the normal exit system call. This will gracefully shut down the profiler and allow the profiler to operate correctly. 3
From previous performance evaluation by Nathan Keynes
2.5 Performance Analysis
33
#ifdef JAVA cls = env->FindClass("java/lang/System"); func = env->GetStaticMethodID( cls, "exit", "(I)V"); env->CallStaticVoidMethod(cls, func, o0); break; #else exit( o0 ); err = 0; break; The above is the code segment inside the system call handler that was changed in order to exit the Java version of the emulator correctly. Performance of JNI vs. Unsafe A JNI version of the emulator was developed that did not require the use of Unsafe classes. The Unsafe classes, introduced in JDK 1.4, were used to allow the Java emulator to directly access memory addresses and also make type cast that Java would normally not allow. Creating a JNI version of the emulator allowed comparison in performance between the Unsafe classes to the JNI equivalent. Program Executed sieve-3000 fibonacci-32
Unsafe-based 288m 12s 3m 42s
JNI-based 333m 4s 4m 28s
% Extra Time JNI requires 16% 21%
Figure 2.7: Performance difference of JNI and Unsafe based versions of emulator. Test performed on a 4 CPU Sun Ultra-80, with low load This data clearly show the overhead introduced by using JNI over using Unsafe. The advantage of the JNI version is that it does not require the use of JDK 1.4, which is still in beta testing. Profile of Java Emulator Using the Java profiler, the following data was gathered from executing the sieve program through the Java version of the emulator. The data gathered was very similar to the ones gathered from the C++ version of the emulator. The methods execute and executeOneInstruction still dominate the total time spent by the emulator. rank self accum count trace method 1 27.64% 27.64% 1432686509 133 sparcemu.execute
34 2 20.15% 47.79% 1432686509 3 9.46% 57.25% 1432686510 4 6.90% 64.15% 3421444300 5 5.60% 69.75% 3421444300 6 5.35% 75.11% 1432686510 7 2.98% 78.09% 3421444300 8 2.50% 80.59% 1507734608 9 2.41% 83.00% 1507734608 10 1.80% 84.80% 737504371 11 1.80% 86.61% 848237913 12 1.60% 88.21% 1507734608 13 1.43% 89.63% 94233413 14 1.39% 91.02% 94233413 15 1.30% 92.33% 1507734608 16 0.93% 93.25% 401879787 17 0.85% 94.10% 376998205 18 0.83% 94.93% 383153738 19 0.55% 95.48% 401864307 20 0.46% 95.95% 342881000 21 0.45% 96.40% 200981367 22 0.39% 96.79% 189104847 23 0.38% 97.18% 188499799 24 0.37% 97.55% 282667911 25 0.32% 97.87% 189104847 26 0.29% 98.16% 188499257 27 0.28% 98.44% 223767090 28 0.26% 98.70% 188445153 29 0.24% 98.95% 194702191 30 0.22% 99.17% 94282993 31 0.17% 99.34% 189104847 32 0.14% 99.48% 100492772 33 0.13% 99.61% 94242481 34 0.13% 99.75% 100487320 35 0.13% 99.87% 94280252 36 0.12% 100.00% 94321671 CPU TIME (ms) END
Emulator Generator 31 98 36 52 46 110 56 149 34 153 26 65 138 42 156 20 127 27 78 145 49 23 121 96 43 7 151 61 66 118 79 137 120 41 69
sparcemu.executeOneInstruction sparcemu.getMemint sparcemu.decodereg_or_imm sparcemu.getMemint sun.misc.Unsafe.getInt sun.misc.Unsafe.getInt sparcemu.setMemint sparcemu.getMemint sparcemu.executeSUBCC sparcemu.executeOR sun.misc.Unsafe.putInt sparcemu.executeRESTORE sparcemu.executeSAVE sun.misc.Unsafe.getInt sparcemu.executeSRL sparcemu.executeSETHI sparcemu.executeORCC sparcemu.executeBL sparcemu.executeADDCC sparcemu.executeSLL sparcemu.decodeeaddr sparcemu.executeJMPL sparcemu.executeBCS sparcemu.getMemint sparcemu.executeCALL sparcemu.executeADD sparcemu.executeBLA sparcemu.executeBA sparcemu.executeSUB sun.misc.Unsafe.getInt sparcemu.executeBLEU sparcemu.executeBNE sparcemu.executeBGE sparcemu.executeBEA sparcemu.executeBE
An interesting discrepancy between the Java and C++ versions of the emulator is the amount of times the execute and executeOneInstruction functions are called. However, that is probably
2.5 Performance Analysis
35
due to the difference in profilers only and is not alone enough to discount the accuracy of the data gathered. From the profiling results, it can be seen that the Java version of the emulator has the additional overhead of using functions such as getMemint, Unsafe.getInt, and Unsafe.putInt. These functions in total account for more than 31% of the total time spent. Although 31% extra overhead is significant, it does not account for the approximate 15 times slowdown of the Java emulator when compared to the C++ emulator.
Dynamic Behaviour of Java VM An area that can perhaps account for the 15 times slowdown is the dynamic behaviour of the Java virtual machine. If the Java VM (Hotspot 1.4) was able to discover all the hot paths and make them into compiled code, then the performance of the Java version should be very close to a natively compiled C++ version. Further more, the Java VM could even be smart enough to recognize the nature of the code and realize that most of the functions are good candidates for inlining further improving performance. The following is a breakdown of the dynamic behaviour of the Java VM. Flat profile of 17670.26 secs (879033 total ticks): main Interpreted 75.7% 663823 0.0% 0 0.0% 0 0.0% 0 0.0% 0 0.0% 0 0.0% 1 0.0% 1 0.0% 1 0.0% 0 0.0% 1 0.0% 1 0.0% 0 0.0% 1 0.0% 0 0.0% 1 0.0% 1 75.7% 663831
+ native + 1335 + 7 + 2 + 1 + 1 + 1 + 0 + 0 + 0 + 1 + 0 + 0 + 1 + 0 + 1 + 0 + 0 + 1350
Method sparcemu.execute emumain.main sparcemu.doTrap sparcemu.decodereg_or_imm java.util.zip.ZipFile.getEntry java.lang.String.charAt sparcemu.executeBL sparcemu.executeSLL sparcemu.executeADDCC java.util.zip.ZipFile.open sparcemu.setMemdouble sparcemu.executeBGU java.lang.Shutdown.halt sparcemu.executeSAVE java.io.FilePermission.newPermissionCollection sparcemu.executeRESTORE sparcemu.getMemdouble Total interpreted
36
Emulator Generator
Compiled 4.6% 40134 3.1% 27390 2.8% 24458 1.6% 14220 1.5% 12769 0.8% 7368 0.8% 6753 0.7% 6113 0.6% 5025 0.6% 5001 0.5% 4444 0.3% 2470 0.3% 2352 0.3% 2250 0.2% 2007 0.2% 1806 0.2% 1708 0.2% 1460 0.1% 1198 0.1% 1146 0.1% 1084 0.1% 1030 0.1% 908 0.1% 891 0.1% 693 20.1% 176577
0.0% 0.0%
+ native + 0 + 0 + 0 + 0 + 0 + 0 + 0 + 0 + 0 + 0 + 0 + 0 + 0 + 0 + 0 + 0 + 0 + 0 + 0 + 0 + 0 + 0 + 0 + 0 + 0 + 3
Stub + native 0 + 12 0 + 12
Method sparcemu.getMemint sparcemu.executeOneInstruction sparcemu.decodereg_or_imm sparcemu.executeSUBCC sparcemu.run sparcemu.executeRESTORE sparcemu.executeADDCC sparcemu.executeSAVE sparcemu.setMemint sparcemu.executeOR sparcemu.executeORCC sparcemu.executeSETHI sparcemu.executeSRL sparcemu.executeBL sparcemu.decodeeaddr sparcemu.executeBCS sparcemu.executeBLA sparcemu.executeADD sparcemu.executeCALL sparcemu.executeJMPL sparcemu.executeSLL sparcemu.executeBA sparcemu.executeBNE sparcemu.executeBEA sparcemu.executeSUB Total compiled (including elided) Method sparcemu.doTrap Total stub
Runtime stub + native 2.0% 17440 + 0 2.0% 17440 + 0
Method interpreter_entries Total runtime stubs
Thread-local ticks: 0.0% 1 0.0% 2
Blocked (of total) Class loader
2.5 Performance Analysis 2.2% 19706 0.0% 9 0.0% 68 0.0% 1 0.0% 1 0.0% 32
37 Interpreter Compilation Unknown: running frame Unknown: calling frame Unknown: no last frame Unknown: thread_state
Global summary of 17670.26 seconds: 100.0% 879033 Received ticks 0.0% 8 Compilation 0.0% 2 Class loader 2.2% 19706 Interpreter 0.0% 102 Unknown code
The above data shows that the majority of the time was spent interpreting code instead of executing compiled code. The function sparcemu.execute, which when interpreted, accounts for 75.7% of the execution time. However, it was not found to be hot by the VM and thus was not compiled. This interpretation probably accounts for a significant portion of the slowdown of the Java version of the emulator compared to the C++ version. Also, many of the functions that the VM decided to compile such as sparcemu.executeSLL and sparcemu.executeBEA are really not executed that frequently and the compilation overhead for these functions may not be justified. Further investigation with fully compiled Java code would be useful to prove or disprove these theories.
38
Emulator Generator
Chapter 3
Instrumentation of an Interpreter via Specifications Design: Cristina, David; Implementation: David; Documentation: David Ung [May 2001], Cristina [Jan 2002]
This chapter describes the specification file format used to automatically add instrumentation code to the Walkabout based emulator (described in Chapter 2). Example instrumentation files are also given to demonstrate the type of instrumentation that it can create and how it is integrated into the emulator.
3.1 Instrumentation The goal of this research is to determine an inexpensive and easy to use way to add instrumentation to the emulator. The type of instrumentation to be added describes ways to identify what sections of the source program are hot (i.e. frequently executed), so that code generation can be done to improve the overall performance of the execution. Existing tools such as EEL [17] and ATOM [10] provide an interface to add code by specifying the level where instrumentation should take place and what to instrument. Such tools reconstructs the application to be instrumented to an intermediate representation in memory and then modifies its structure (through CFGs and basic blocks) to add the instrumentation into the application. Finally, the binary is rebuilt and an instrumented version is emitted. There are two fundamental problems with the approach described above when trying to add instrumentation to the Walkabout emulator: 39
40
Instrumentation of an Interpreter via Specifications 1. When the emulator is running, it is emulating the behaviour of a program. The execution of the program determines which paths to take during runtime and hence indirectly affects which part of the emulator is invoked. Adding instrumentation to the emulator will instrument the emulator. Although this can indirectly give information about the runtime behaviour of the source program, the information gathered will be more in the scope of the emulator, thus losing emphasis on the source program. In particular to the attempt to find hot traces, instrumentating the emulator may tell us that the function executeBNE() is hot, but the information about which instruction cause this in the source program is not revealed. It is possible to obtain information about the source program through the instrumenting the emulator, but the task is not an easy one. It requires knowledge about the internal workings of the emulator and makes the works of instrumentation difficult to use. 2. The emulator is a very low level data processor. Instead of multiple level of abstractions found in existing tools, the only abstraction of the emulator is at the instruction level. This low level abstraction greatly limits the amount of calls that can be made to predefined functions provided by high level instrumentation tools. For example, high level functions such as FOREACH EDGE() and FOREACH BB().
To provide a flexible and powerful instrumentation at the instruction level, the emulator itself should provide the instrumentation. Since the emulator is automatically generated, this motivates the idea of automatically adding instrumentation code as part of the emulator. Being part of the emulator code, the instrumentation has access to variable and locations internal to the emulator. This approach allows direct control over what to instrument. The goal is to instrument the source program, not the emulator.
3.1.1 Existing instrumentation tools The use of instrumentation provides opportunities in binary editing, emulation, observation, program comprehension and optimization. Although many tools exist that can modify binaries, the implementation of the actual code modification are typically fused in detail with the application or executable itself. But several tools exist that provide a high level interface (typically through a set of libraries) to easily access its instrumentation facilities. The following are some examples of such tools: 1. Srivastava and Wall’s OM system [7], a library for binary modification. It requires relocation from object files to analyse control structure and to relocate edited code. 2. ATOM [10] provide an interface to the OM system. Very high level of abstraction, simplifies the writing of tools.
3.2 Instrumentation specification
41
3. QPT [16] by Larus and Ball, a profiling and tracing tool. 4. EEL [17], also a library for building tools to analyze and modify binaries. Both EEL and ATOM are large libraries that provide a rich set of routines for instrumentation. Different levels of the abstraction in these tools allows control over what level the tool wants to instrument through calls to those library rountines. The following example EEL code shows the use of the library: executable* exec = new executable("test_program"); exec->read_contents(); rountine* r; FOREACH_ROUTINE (r, exec->rountines()) { cfg* g = r->get_control_graph(); bb* b; FOREACH_BB(b, g->blocks()) { edge* e; FOREACH_edge(e, b->succ()) { count_branch(e); } } } The types executable, rountine, cfg, bb and edge are data structures provided by the library for different level of abstraction of the binary. The tools simply make calls to library routines such as read contents(), FOREACH BB and get control graph(). The only function that needs to be written by the tool builder is count branch(). The concept in ATOM is similar to EEL in that the tool builder make uses of library rountine to access the different levels of abstraction in the binary.
3.2 Instrumentation specification The instrumentation code is written in a separate specification file that is linked as part of the emulator at the time of generating the New Jersey Machine Code (NJMC) matching file. Code can be added at the instruction level under the DEFINITION section. The list of instructions that you wish to act on is specified as a table. Instrumentation code is then specified for a table by adding relevant code with respect to the main body of their emulation rountines. For example, if you want
42
Instrumentation of an Interpreter via Specifications
to count the number of times a particular set of branches is taken in an X86 program, the instructions to be monitored are specified in a table as follows: DEFINITION jump32s [ "JVA", "JVNBE", "JVAE", "JVNA", "JVC", "JVCXZ", "JVNL", "JVL", "JVNGE", "JVNO", "JVNP", "JVPO", "JMPJVOD" ]
"JVNB", "JVB", "JVNAE", "JVBE", "JVE", "JVZ", "JVG", "JVNLE", "JVGE", "JVLE", "JVNG", "JVNC", "JVNE", "JVNZ", "JVNS", "JVO", "JVP", "JVPE", "JVS",
In order to count occurrences of the branch instructions listed in the jump32s table, the semantics of the branch instructions is extended to increment a counter. This is expressed in the INSTR language as follows: jump32s label { increment_counter(SSL(%pc), PARAM(label)); SSL_INST_SEMANTICS } where the function increment counter is defined in the IMPLEMENTATION ROUTINES section of the specification file, and SSL INST SEMANTICS refers to the semantics of the instruction as specified in the semantic description file SSL. For illustration purposes, we show the section IMPLEMENTATION ROUTINES, where the function increment counter is implemented. IMPLEMENTATION_ROUTINES #include #include // map edge to execution counts map< pair, int > edge_cnt; // increments the branch count for edge (addr1, addr2) void increment_counter(int addr1, int addr2) { // construct the edge. pair edge = pair(addr1, addr2); map< pair, int >::iterator i;
3.2 Instrumentation specification
43
if ((i = edge_cnt.find(edge)) == edge_cnt.end()) { // not found in map, add it and set count to 1 backedge_cnt[edge] = 1; } else { (*i).second ++; // increment counter by 1 } }
To build the instrumented SPARC emulator, the SLED, SSL and the instrumentation file (INSTR) are included as part of the build to generate the matching .m file: tools/genemu -i sparc.backbranches.inst machine/sparc/sparccore.spec machine/sparc/sparc.ssl sparcemu.m The -i option includes the instrumentation file sparc.backbranches.inst into the build of the SPARC emulator. The contents of sparc.backbranches.cnt500.inst is found in the Appendix to this Chapter.
3.2.1 Syntax of the INSTR Language The instrumentation file consists of two main sections: 1. Definition, 2. Fetch-execute cycle, and 3. Support code. The definition section specifies which instructions are to be instrumented and their corresponding instrumentation code. The fetch-execute cycle section specifies what, if any, commands need to be executed at each iteration of the loop. The support code section contains additional code that the program may call as part of instrumentation. This code is expressed in the C language. The EBNF for the language is:
specification:
parts+
44
Instrumentation of an Interpreter via Specifications
parts:
definition | support_code
definition:
DEFINITION instrm+
instrm:
table | semantics
table:
STRING [ SLED_names ]
semantics:
(STRING parameter_list instrument_code)+ (FETCHEXECUTE instrument_code)*
parameter_list:
STRING (, STRING)*
instrument_code:
{ (action)* SSL_INSTR_SEM }
support_code:
IMPLEMENTATION_ROUTINES c_code
where action contains any valid C/C++ code written by the user. This piece of code is attached to the instructions specified in the table along with the instruction’s semantics. The following special symbols may be inserted into action: 1. SSL INST SEMANTICS: stands for the semantics of the instruction, as described in the SSL specification file, 2. PARAM(string): indicates the value of the operand string of the current instruction. E.g. PARAM(label) of the BA instruction is the instruction’s first operand. 3. SSL(%register name): indicates one of the machine registers specified in the SSL file. E.g. SSL(%pc) is the location holding the value of the emulated PC register.
3.3 Appendix 3.3.1 Listing of an Instrumentation File # File: sparc.backbranches.cnt50.inst # Desc: This file contains the list of instructions and actions # used for instrumentation. # The file instruments backbranches and invokes the trace
3.3 Appendix #
builder to build hot traces used for optimisation.
DEFINITION branch [ "BA", "BN", "BNE", "BE", "BG", "BLE", "BGE", "BL", "BGU", "BLEU", "BCC", "BCS", "BPOS", "BNEG", "BVC", "BVS", "BNEA", "BEA", "BGA", "BLEA", "BGEA", "BLA", "BGUA", "BLEUA", "BCCA", "BCSA", "BPOSA", "BNEGA", "BVCA", "BVSA" ] branch label { int oldpc = SSL(%pc) SSL_INST_SEMANTICS // check back branches if (oldpc > PARAM(label)) { if (trace_mode) { end_build_trace(); } else { // branch is taken if (SSL(%npc) == PARAM(label)) { increment_counter(oldpc, PARAM(label)); } } } } FETCHEXECUTE { if (trace_mode) { add_to_trace(SSL(%pc)); } SSL_INST_SEMANTICS } INSTRUMENTATION_ROUTINES #include "emu/backbranches.cnt500.cc"
3.3.2 Listing of Support Code: backbranches.cnt500.cc #include #include #include
45
46
Instrumentation of an Interpreter via Specifications
// an edge is made up by a pair of addresses (branch_inst, target_inst) // the upper value that an edge must reach to trigger the building of traces. // this is value is incremented by 500 each time start_trace is called. int trigger = 500; // map edge to execution counts map< pair, int > backedge_cnt; // informs the emulator whethere it is in trace mode. If so, // it will add the current instruction at %pc to the trace. int trace_mode = 0; // holds the list of instructions in the current trace list trace;
// *************************************************************************** // Function definitions // *************************************************************************** // prints the trace to stderr and exit void print_trace() { cerr
Description don’t try to regenerate generated files enable debugging support, < what > is one of *** translate from < arch > architecture, one of sparc, pent add instrumentation to emulator using files in < dir >
Figure A.2: Configure Options
A.3
Configuring Tools from the Walkabout Framework
At present (Aug 2001), you can generate disassemblers, interpreters and a PathFinder program using the Walkabout framework. In order to generate these tools, the framework has to be configured using different options. These notes describe how to configure Walkabout for different purposes. More information about how configure works is available in Section A.4. Note that in order to build a different tool you always need to reconfigure your system.
A.3.1 Generating Interpreters In order to generate interpreters, you need to first build the tool that generates interpreters, genemu: configure --with-source=sparc --enable-remote make dynamic/tools/genemu This generates the file genemu in the ./dynamic/tools directory. The genemu tool will create an interpreter based on the syntax (SLED) and semantic (SSL) specifications for a machine. Both a C-based interpreter and a Java-based interpreter can be generated using genemu, although the Java-based interpreter has only been tested with the SPARC specifications. The options available in genemu are: Usage: genemu [options] Recognized options:
64
Building Walkabout -c output C code [default] -d disassembler only (do not generate emulator core) -j output Java code -i inst-filename: use inst-filename to instrument code. -t test only, no code output -m additionally generate a Makefile to go with the core -o write output to the given file
Note that one or more SLED files can be given as input, SLED files have the extension .spec and SSL files have the extension .ssl. Also, some options have not been maintained, it is best to use the configure options (see next sections) or see the configuration files for examples of usage. C-based Interpreters To generate a C-based interpreter for a particular machine, use the make rule for that machine (normally the name of the machine followed by “emu”). For the SPARC, you would run: make sparcemu This will generate sparcemu in the ./dynamic/emu directory, if you had configured for the SPARC machine. To run: cd dynamic/emu sparcemu ../../test/sparc/hello sparcemu /bin/banner Hi
Java-based Interpreters To generate a Java-based interpreter for the SPARC machine, use the following make rule: make dynamic/emuj You can then run the generated interpreter using a Java VM: cd dynamic/emu java -cp . sparcmain ../../test/sparc/hello
A.3 Configuring Tools from the Walkabout Framework
65
A.3.2 Generating PathFinder To build a virtual machine that finds hot paths and generates native code for those paths while interpreting other cold paths, you need to configure Walkabout to generate the pathfinder virtual machine (VM) by configuring for a particular instrumentation method to determine hot paths within the interpreter. For example, if you want to use Dynamo’s next executing tail (NET) method, run the following configure command: configure --with-source=sparc --enable-remote \ --withinstrm=dynamic/pathfinder/sparc.NET.direct/pathfinder Then make the tool by building a target with the name formed by adding a single-character prefix to the word “pathfinder”. This prefix character is the first letter of the name of the machine on which the genberated pathfinder will run. For example, for SPARC you would run: make spathfinder This generates the instrumented VM spathfinder in the ./dynamic/emu directory. This instrumented VM uses code profiling as well as code generation to execute code for SPARC V8. Note, however, that the source code for the code generator relies on some SPARC V9 instructions. To run: cd dynamic/emu spathfinder ../../test/sparc/hello spathfinder ../../test/sparc/fibo-O0 spathfinder /bin/banner Hello A word of caution when building interpreters and VMs. Some of the files used by these tools are the same and some get patched, therefore, it is wise to remove object files before building a new tool. We therefore recommend you do a make dynclean before you build your tool. If you are getting strange errors, most likely you need to make dynclean. Since you need to run configure, you can do this at the same time: make dynclean configure --with-source=sparc ...
[whatever other options]
You can generate other pathfinder tools for the SPARC architecture by using some of the other instrumentation files. The above example made use
66
Building Walkabout
of the dynamic/pathfinder/sparc.NET.direct/pathfinder/profile.inst instrumentation file. Other instrumentation files can be used, the ones in the Walkabout distribution are in the following locations: dynamic/pathfinder/sparc.NET.direct/pathfindercall/profile.inst dynamic/pathfinder/sparc.NET.direct/pathfinderrecursive/profile.inst dynamic/pathfinder/sparc.NET.direct/pathfinder.v9/profile.inst dynamic/pathfinder/sparc.NET.relocate/profile.inst
A.3.3 Generating the Walkabout Debugger The Walkabout debugger is a GUI debugger written in the Java language. The debugger was only ever tested with the SPARC architecture, other extensions would be needed to support the display of state information for other architectures. To configure the debugger, emit the following commands: make dynclean configure --with-source=sparc --enable-dynamic --enable-remote make dynamic/emuDebug The make builds the disassembler and the interpreter for the configured machine, and then generates emuDebug.class in the ./dynamic/emuDebug/bin directory. To run the debugger, execute the bash script emuDebug in the ./dynamic/emuDebug directory (this is a shell script file; make sure the first line refers to the location of your bash tool): cd dynamic/emuDebug emuDebug ../../test/sparc/hello
A.3.4 Building without the --with-remote Option When configuring the system without use of the remote option (i.e. without --with-remote), the system will recreate .m and .cc files from the machine specifications and .c files from .y files. It is recommended that you do a make realdynclean before configuring without the remote option, in order to remove all generated files that have already been stored in the distribution.
A.4 How the Configuration Process Works
A.4
67
How the Configuration Process Works
A complete description of the autoconfigure process is beyond the scope of this document; the interested reader can get more information from publicly available documentation such as http://www.gnu.org/manual/autoconf/index.html. In brief, the developer writes a file called configure.in. The program autoconf processes this file, and produces a script file called configure that users run to configure their system. We have already done that, so unless you need to change the configuration, you only need to run ./configure. If you do make a change to configure.in, then you should run autoconf; autoheader When ./configure is run, various files are read, including a file specific to the source machine. For example, if you configure with --with-source=sparc, the file machine/sparc/sparc.rules is read for SPARC-specific information. It also reads the file Makefile.in. Using this information and the command line options, ./configure creates the file Makefile. As a result, the Makefile isn’t even booked in. That’s the main reason you need to run ./configure as the very first thing, before even make. It also means that you should not make changes (at least, changes that are meant to be permanent) to Makefile; they should be made to Makefile.in. Another important file created by ./configure is include/config.h. This file is included by include/global.h, which in turn is included by almost every source file. Therefore, configure goes to some trouble not to touch include/config.h if there is no change to it (and it says so at the end of the configure run). A significant change to the configuration (e.g., choosing a new source or target machine) will change include/config.h, and therefore almost everything will have to be recompiled. A note about the version of autoconf; we have found that version 2.9 does not work properly but version 2.13 works fine with our configure files.
A.4.1 Dependencies and make depend Building Walkaboutrequires a file called .depend that contains file dependencies for the system. The first time you make Walkabout, this file won’t exist and it will be created automatically for you. The .depend file contains entries similar to this: coverage.o: ./coverage.cc include/coverage.h include/global.h \ include/config.h
68
Building Walkabout
which says that the coverage.o file depends on the files ./coverage.cc, include/coverage.h, and so on. There can be dozens of dependencies; the above is one of the smallest. This information takes a minute or two to generate, and so is only generated (a) by make itself if .depend does not exist, and (b) if the user types make depend. It is easy to change the dependencies, e.g. by adding a #include line to a source file. If you do this, and forget to run make depend, then you can end up with very subtle make problems that are very hard to track down. For example, suppose you add “#include "foo.h"” to the worker.cc source file, so that worker.cc can use the last virtual method in class foo. Everything compiles and works fine. A week later, you add a virtual method to the middle of class foo. The .depend file doesn’t have the dependency for worker.cc on foo.h, and so worker.o isn’t remade. The code in worker.o now calls the second last method in class foo, instead of the correct final method! However, you are not thinking about worker.cc now, since your latest changes are elsewhere. This sort of problem can take a long time to diagnose. One solution is to “make clean” as soon as you get unexpected results. However, you can save a lot of time if instead you just make depend; make instead. In fact, it’s a good idea to run make depend regularly, or after any significant change to the source files.
A.4.2 Warnings from make During the making of Walkabout, it is normal to see quite a lot of output. We try to ensure that ordinary warnings from gcc are prevented, but some warnings are much harder to suppress, and some warnings are quite normal. For example: typeAnalysis/typeAnalysis.y contains 2 shift/reduce conflicts. These are normal, and the bison++ parser automatically resolves these conflicts in a sensible way.
A.4.3 Where the Makefile Rules Are The Makefile is composed of make rules that come from a variety of different sources: � The core rules are in the top level Makefile.in file, � Machine-specific rules are in the respective machine directory with the extension .rules; e.g., machine/sparc/sparc.rules,
A.5 The Walkabout Regression Test Suite
69
� Instrumentation rules are in a subdirectory pathfinder/make.rules under the respective instrumentation directory; e.g., pathfinder/sparc.NET.direct/pathfinder/make.rules.
A.5
The Walkabout Regression Test Suite
The Walkabout framework includes a set of regression tests for generated interpreters. Tests have been written for the SPARC emulator only. The script that is used for testing an interpreter is called dynamic/test/interpregression.tcl. This is a Tcl script that allows new tests to be added easily. Existing tests can also be modified easily. Each test includes the test’s name and expected result. The script runs each test and compares its output against that expected. If these are not the same, it reports the failure and gives the actual result. The default is to run all tests, but you can specify which tests to run, or which to skip, by giving a regular expression pattern that is matched against test names. At the end of all the tests, there is a report on the number of tests run, and how many passed, failed, or were skipped. The tests each run one of the SPEC95 benchmark programs. Up to four regression tests can be run for each SPEC95 program. Both optimized (-O4) and unoptimized (-O) versions of each program are run. It is also possible to run each version of the program using both the SPEC95 “test” and “reference” data sets. By default, only the “test” data set is used since it requires less time. The other tests that use the “reference” data set are marked as having the “refInput” contraint; they are only run if you specify -constraints refInput on the command line that runs the regression tests (see below). The expected output of each test is the total number of instructions executed. This count is sensitive to the specific versions of the shared libraries that are used. As a result, you can expect the tests to fail if they are run on a machine other than that used to get the original expected instruction count. We used a Sun 420R with 4 CPUs and 4GB of memory, running Solaris 8.
A.5.1 Running the Regression Tests Tests can be run sequentially (one after another) or in parallel. This section discusses how to run the tests sequentially. Section A.5.2 describes how to run the tests concurrently. To run all SPARC interpreter tests using the “test” data sets (the default): $ cd $ cd dynamic/test
70
Building Walkabout $ tclsh interp-regression.test sparc
To run only the SPARC interpreter tests that run the SPEC95 “go” program, you can specify a pattern on the command line. Only tests (“test” data sets only) with names that match the pattern are run: cd dynamic/test tclsh interp-regression.test sparc -match ’go*’ To skip all SPARC interpreter tests whose names match a pattern (again “test” data sets only), run: cd dynamic/test tclsh interp-regression.test sparc -skip ’go* ijpeg*’ To run all SPARC interpreter tests including those that use the “reference” data sets: cd dynamic/test tclsh interp-regression.test sparc -constraints refInput
A.5.2 Running the Tests in Parallel To run the tests in parallel, the two scripts dynamic/test/mt-tests.tcl and dynamic/test/summarize-mt-tests.tcl are used. mt-tests.tcl takes the same command line arguments as interp-regression.tcl and forks processes to do the various tests in parallel. It creates a directory under dynamic/test with a name like walktest-Oct24-2001-19:15:06 that contains an “*.out” file holding the output from each of the forked tests. One such file, for example, might be go.v8.base.test.out. The second script summarize-mt-tests.tcl creates a file that summarizes the results of all the tests. It takes one command line argument, the name of the directory created by mttests.tcl, and creates a file summary.txt in that directory with the concatenated results of the various tests. For example, to run all SPARC interpreter tests except for “go” using the default “test” data sets, do the following. $ cd /dynamic/test $ tclsh mt-tests.tcl sparc -skip ’go*’ Parallel Walkabout tests Writing results into directory walktest-Oct-24-2001-16:10:44
A.5 The Walkabout Regression Test Suite
71
Forked process 7952 to execute test compress.v8.peak.test Forked process 7953 to execute test compress.v8.base.test Forked process 7954 to execute test perl.v8.peak.test Forked process 7955 to execute test perl.v8.base.test Forked process 7956 to execute test go.v8.peak.test Forked process 7957 to execute test go.v8.base.test Forked process 7958 to execute test ijpeg.v8.peak.test Forked process 7964 to execute test ijpeg.v8.base.test $ tclsh summarize-mt-tests.tcl walktest-Oct-24-2001-16:10:44 Summarizing parallel Walkabout test results into walktest-Oct24-2001-16:10:44/summary.txt appending file compress.v8.base.test.out ... $ vi walktest-Oct-24-2001-16:10:44/summary.txt
72
Building Walkabout
Bibliography [1] V. Bala, E. Duesterwald, and S. Banerjia. Dynamo: A transparent dynamic optimization system. In Proceedings of the ACM SIGPLAN’00 Conference on Programming Language Design and Implementation, pages 1–12, Vancouver, Canada, June 2000. ACM Press. [2] W. Chen, S. Lerner, R. Chaiken, and D. Gillies. Mojo: A dynamic optimization system. In Proceedings of the Third ACM Workshop on Feedback-Directed and Dynamic Optimization, Monterey, California, December 2000. [3] C. Cifuentes, , M. Van Emmerik, N. Ramsey, and B. Lewis. Experience in the design, implementation and use of a retargetable static binary translation framework. Technical report, Sun Microsytems Laboratories, Palo Alto, CA 94303, December 2001. [4] C. Cifuentes and M. Van Emmerik. Computer, 33(3):60–66, March 2000.
UQBT: Adaptable binary translation at low cost.
[5] C. Cifuentes, M. Van Emmerik, N. Ramsey, and B. Lewis. The University of Queensland Binary Translator (UQBT) framework, December 2001. Documentation book of the UQBT distribution, available from http://www.itee.uq.edu.au/csm/uqbt.html. [6] Peter Deutsch and Alan M. Schiffman. Efficient implementation of the smalltalk-80 system. In Conference Record of the 11th Annual ACM Symposium on Principles of Programming Languages, pages 297–302. ACM, ACM, January 1984. [7] Digital. OM and ATOM. http://www.research.digital.com/wrl/projects/ om/om.html, 1994. Digital Western Research Labs. [8] Digital. Freeport Express. http://www.novalink.com/freeport-express, 1995. [9] K. Ebcioglu and E. Altman. DAISY: Dynamic compilation for 100% architectural compatibility. Technical Report RC 20538, IBM, IBM T.J. Watson Research Center, Yorktown Heights, New York, August 1996. 73
74
BIBLIOGRAPHY
[10] A. Eustace and A. Srivastava. ATOM a flexible interface for building high performance program analysis tools. In Proceedings USENIX Technical Conference, pages 303–314, January 1995. Also as Digital Western Research Laboratory Technical Note TN-44, July 1994. [11] Adele Goldberg and David Robson. Smalltalk-80: The Language and Its Implementation. Addison-Wesley, Reading, MA, 1983. [12] Robert Griesemer and Srdjan Mitrovic. A compiler for the Java HotSpot virtual machine. In L´aszl´o B¨osz¨orm´enyi, Jurg Gutknecht, and Gustav Pomberger, editors, The School of Niklaus Wirth: The Art of Simplicity, pages ??–?? Morgan Kaufmann Publishers, Los Altos, CA 94022, USA, 2000. [13] U. Holzle, L. Bak, S. Grarup, R. Griesemer, and S. Mitrovic. Java on steroids: Sun’s highperformance java implementation, August 1997. [14] Urs Holzle. Adaptive optimization for SELF: Reconciling high performance with exploratory programming. Thesis CS-TR-94-1520, Stanford University, Department of Computer Science, August 1994. [15] R.J. Hookway and M.A. Herdeg. Digital FX!32: Combining emulation and binary translation. Digital Technical Journal, 9(1):3–12, 1997. [16] J.R. Larus and T. Ball. Rewriting executable files to measure program behavior. Software – Practice and Experience, 24(2):197–218, February 1994. [17] J.R. Larus and E. Schnarr. EEL: Machine-independent executable editing. In SIGPLAN Conference on Programming Languages, Design and Implementation, pages 291–300, June 1995. [18] Michael Paleczny, Chnstopher Vick, and Cliff Click. The javaHotSpotTM server compiler. In Proceedings of the JavaTM Virtual Machine Research and Technology Symposium (JVM-01), pages 1–12, Berkeley, USA, April 23–24 2001. USENIX Association. [19] C. Reeve, D. Deaver, R. Gorton, and B. Yadavalli. Wiggins/redstone (wr): A dynamic optimization and specialization tool. Unpublished manuscript, 2000. [20] E. Schnarr and J.R. Larus. Instruction scheduling and executable editing. In Workshop on Compiler Support for System Software (WCSSS), pages 288–297, Tucson, AZ, February 1996. [21] K. Scott and J.W. Davidson. Software security using software dynamic translation. Technical Report CS-2001-29, University of Virginia, Department of Computer Science, Charlotesville, VA, November 2001.
BIBLIOGRAPHY
75
[22] A. Srivastava, A. Edwards, and H. Vo. Vulcan: Binary transformation in a distributed environment. Technical Report MSR-TR-2001-50, Microsoft Research, One Microsoft Way, Redmond, WA 98052, April 2001. [23] A. Srivastava and A. Eustace. ATOM: A system for building customized program analysis tools. Technical Report 94/2, Digital Western Research Laboratory, 250 University Avenue, Palo Alto, CA 94301, March 1994. [24] T. Thompson. An Alpha in PC clothing. Byte, pages 195–196, February 1996. [25] D. Ung and C. Cifuentes. Optimising hot paths in a dynamic binary translator. In Proceedings of the Second Workshop on Binary Translation, Philadelphia, Pennsylvania, October 19 2000. [26] D. Ungar and R.B. Smith. SELF: The power of simplicity. In Conference on Object-Oriented Programming Systems, Languages and Applications, pages 227–241. ACM Press, October 1987.