Watershed Deconvolution for Cell Segmentation. Nezamoddin N. Kachouie 1, Paul Fieguth 1, and Eric Jervis 2. 1Department of Systems Design Engineering.
30th Annual International IEEE EMBS Conference Vancouver, British Columbia, Canada, August 20-24, 2008
Watershed Deconvolution for Cell Segmentation Nezamoddin N. Kachouie 1 , Paul Fieguth 1 , and Eric Jervis 1 Department of Systems Design Engineering 2 Department of Chemical Engineeribg University of Waterloo, Waterloo, Canada
Abstract— Cell segmentation and/or localization is the first stage of a (semi)automatic tracking system. We addressed the cell localization problem in our previous work where we characterized a typical blood stem cell in a microscopic image as an approximately circular object with dark interior and bright boundary. We also addressed the modelling of adjacent and dividing cells in our previous work as a deconvolution method to model individual blood stem cell as well as adjacent and dividing blood stem cells where an optimization algorithm was combined with a template matching method to segment cell regions and locate the cell centers. Our previous cell deconvolution method is capable of modelling different cell types with changes in the model parameters. However in cases where either a complex parameterized shape is needed to model a specific cell type, or in place of cell center localization, an exact cell segmentation is needed, this method will not be effective. In this paper we propose a method to achieve cell boundary segmentation. Considering cell segmentation as an inverse problem, we assume that cell centers are located in advance. Then, the cell segmentation will be solved by finding cell regions for optimal representation of cell centers while a template matching method is effectively employed to localize cell centres.
I. INTRODUCTION Hematopoietic Stem Cells (HSCs) form blood and immune cells and are responsible for the constant renewal of blood. To produce new blood cells, HSCs proliferate and differentiate to different blood cell types continuously during their lifetime. Hence they are of substantial interest in stem cell therapy and cancer research. To classify HSCs to different groups, they must be observed/tracked over time and their key features including cell size, shape, and motility must be extracted. Manual tracking of such data is an onerous task and automated methods are in high demand. Advanced techniques in digital image processing and pattern recognition must be applied to a huge number of bio-cellular images in digital cytometry systems to improve our understanding of cellular and inter-cellular events and to achieve significant progress and new discoveries in biological and medical research. Cell segmentation in microscopic images as an object segmentation problem remains an attractive and challenging task due to the often corrupted or blurred images, high noise, the presence of clutter, and the difficulties of adapting and extending available image segmentation approaches [1], [2], [3], [4]. A variety of semi-automatic or automatic methods This research has been funded by the Natural Science and Engineering Research Council of Canada (NSERC).
978-1-4244-1815-2/08/$25.00 ©2008 IEEE.
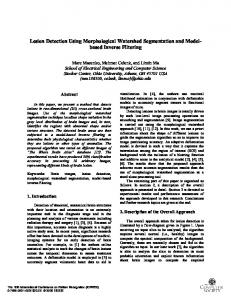
Fig. 1.
2
Unprocessed microscopic cell image.
have been proposed for cell segmentation. Geusebroek et al [5] introduced a method based on Nearest Neighbor Graphs to segment the cell clusters. Meas-Yedid et al [6] proposed a method to quantify the deformation of cells using snakes. Kittler [7], Otsu [8] and Wu [9] have used thresholding methods. The mean shift procedure method was proposed by Comaniciu et al [2] for cell image segmentation for diagnostic pathology. Watershed has been used by Markiewicz et al [10] for segmentation of bone marrow cells. In this paper, the cell segmentation problem is formulated as an inverse problem and a watershed deconvolution algorithm is proposed to segment the individual FDPC1 Cells. The proposed method has been successfully applied for modelling HSCs and identifying their locations in phase contrast microscopic images. To produce the data for this study, cell samples are first extracted from mouse bone marrow and cultured in custom arrays having up to forty wells. The cells are then imaged through a 40X DIC using a digital camera (Sony XCD900). Images were sampled every three minutes over the course of several days. A small fraction of a typical FDPC1 microscopic image is depicted in Fig. 1. II. T HE P ROPOSED M ETHOD In our previous work [11] we characterized a typical HSC in a microscopic image as an approximately circular object with a darker interior and a bright boundary. The proposed
375
groups of cells are segmented in advance. Then, the cell center localization was solved by finding a set of cell shape parameters for optimal representation of cell segmented areas. In contrast, in the proposed method herein • We assume that cell centers are located in advance. • Then, the cell segmentation will be solved by finding cell regions for optimal representation of cell centers. The proposed method consists of cell template generation, template matching, cell center localization, and watershed segmentation. •
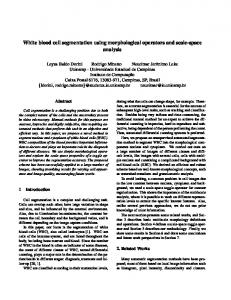
Fig. 2.
Sample cell template.
cell model works well to localize a specific HSC phenotype, however the performance of the algorithm drops if there is significant illumination variations during phase contrast imaging. Moreover, [11] is developed for a specific HSC phenotype and performs poorly for the phenotypes that do not maintain a uniform bright boundary and dark interior. Thus it performs poorly where DIC microscopic imaging that causes non-uniform contrast over the cell boundary is employed for visualization. In [12] we introduced a more general model which is robust against noise and can be applied to the different HSC phenotypes. Although our previous methods [11], [12] perform satisfactory for locating non-dividing and dividing cells, they are not capable of accurately modelling dividing or crowded cells. As a result they might fail to precisely locate the adjacent cells and in turn are prone to generate erroneous results in such cases. In [13] we show that locating the cell centres is essentially an inverse problem which can be addressed in the form of a deconvolution approach. To solve the problem, we proposed to find a set of cell shape parameters for optimal representation of cell segmented areas. Thus the inverse problem was solved using an optimized ellipse fitting method and considering each ellipse centroid as a cell center. The proposed method effectively models dividing and crowded cells, and it can potentially be used for modelling different cell types by changing the model parameters. However in the following cases this method will not be effective: • A complex parameterized shape is needed to model a cell, • In place of cell center localization an accurate segmentation of cell boundary is required. In this paper we propose a method to achieve cell boundary segmentation. Considering cell segmentation as an inverse problem, here again we address the solution in the form of a deconvolution approach. The key differences between this method and the method presented in [13] is that in the previous approach in [13] • We assumed that cell areas containing individual or
III. C ELL T EMPLATE G ENERATION AND T EMPLATE M ATCHING In contrast with our proposed mathematical cell template in [11] that was introduced based on attributes of a specific HSC phenotype such as uniform bright boundary and dark inside, here using user interactions a more general cell template applicable to different cell types will be generated. In this way user selects some cells in a few frames of the video clip by clicking on the upper-left and lower-right corners of a rectangular box that the cell is surrounded in. The selected cells are averaged to generate the cell template: Mtpl =
Nc 1 � Mn Nc n=1 rect
(1)
n where Mtpl and Mrect are 2-Dimensional matrices. Then the cell template is convolved with unprocessed image frame Ik to generate a correlation map
Cmap = Ik ∗ Mtpl
(2)
Cell template and the correlation map obtained by applying the cell template are depicted in Fig. 2 and 3(a) respectively. The brighter pixels in the correlation map show the highly correlated points which are more likely to be a cell centre. To locate the cell centres and remove the unlikely cell centre, we find the local maxima in the correlation map LM axmap = localmaxima(Cmap , Wd )
(3)
where Wd is the window size to be locally searched for the local maxima. The cell centre map as depicted in Fig. 3(b) is finally generated by theresholding the local maxima map CCmap = T (LM axmap , τ )
(4)
where T is thresholding function and τ is the threshold. IV. E DGE D ETECTION AND C OARSE S EGMENTATION An edge image as depicted in Fig. 4(a) will be obtained applying Canny edge detector to the original image G = Canny(Ik )
(5)
Cell areas then are coarsely segmented using morphological operators. This is accomplished by dilating a disk as morphological mask over the edge map � IS = G⊕M ≡ {Gi +Mj : Gi ∈ G, Mj ∈ M } = G+Mj
376
Mj ∈M
(6)
Fig. 3. (Left) Correlation map that is obtained by convolving the cell template depicted in Fig. 2 and original image in Fig. 1. (Right) Located cell centers obtained by finding local maxima in (Left) and thresholding the local maxima map.
where G is the edge image, M is the mask, and G+Mj ≡ {Gi + Mj : Gi ∈ G}
(7)
is the translation of G along the Mj . Very small regions that are not likely to be a cell region will be removed after dilation. A coarse segmented image is depicted in Fig. 4(b). V. WATERSHED D ECONVOLUTION As can be observed in Fig. 4(c), for the exact segmentation of cell boundaries, cell centers obtained by template matching are superimposed on a coarsely segmented binary image as global minima. The watershed method, as a hybrid region-boundary based segmentation approach, will then be used to partition the coarse segmented image by filling up the local minima, superimposed located cell centers, into disjoint homogeneous regions associated to individual cells. Therefore catchment basins represent cell regions, whereas watershed lines demonstrate the cell boundaries. Let IS = (D, g) be the coarsely segmented image, where D is a digital grid and function g : D −→ N assigns an integer value to each d ∈ D, and g(d) is gray level of d corresponds to altitude in topographic context. Let Mc = {mt | t ∈ [1, TMc ]} be the set of cell centers in cell centre map CCmap consisting of TMc centers which are superimposed as local minima on coarse segmented image. The set of points d ∈ D which are topographically closer to a cell center mi than to any other cell center mj construct the cell region C(mi ) which is associated with the cell center mi . � C(mi ) = d ∈ D| ∀j ∈ I\{i} : g(mi ) + S(d, mi ) < � g(mj ) + S(d, mj ) (8) where S(d, mt ) is the topographical distance between d and mt . The watershed of g is a set of points which do not belong to any cell region and represents the cell boundaries W : � � (9) W (g) = D \ ∪i∈[1,TMc ] C(mi )
The exact segmentation applying the watershed is depicted in Fig. 4(d). Fig. 4(e) shows superimposed cell centers and cell boundaries on the original image. As we can observe, cell boundaries are perfectly segmented for individual and dividing cells. VI. R ESULTS In this section we show a visual representation of different stages of the application of the proposed watershed deconvolution method to a typical cell image for cell segmentation. The proposed watershed deconvolution method is applied to the original image sequence. A typical FDPC1 cell image and a cell template generated by user interactions are depicted in Figs. 1 and 2 respectively. The correlation map and thresholded local maxima map representing cell centre locations are depicted in Figs. 3(Left) and (Right) respectively. In the next step, cell boundaries are detected by applying Canny edge detector to the original image as depicted in Fig. 4(a). A coarse segmentation of cell regions is shown in Fig. 4(b). Superposition of cell centres on coarsely segmented image is depicted in Fig. 4(c). Boundaries of labelled cell regions (Fig. 4(d)) and located cell centres (Fig. 3(Right)) are superimposed on the original cell image as depicted in Fig 4(e). As we can observe, not only the cell centres are precisely located but cell boundaries with arbitrary different shapes are accurately segmented. The proposed method is applied to different FDPC1 image sequences with arbitrary shapes and generated promising results. As can be observed in Fig. 4, the proposed watershed deconvolution method is able to identify both non-dividing and the challenging dividing cells so that the cell centres and boundaries are precisely located for each case. VII. C ONCLUSIONS AND D ISCUSSIONS Detection and boundary segmentation of adjacent and dividing cells are very difficult and challenging tasks. In our
377
(a)
(b)
(c)
(d)
(e)
Fig. 4. (a) Edge detection applying Canny edge detector to the original image in Fig. 1. (b) Dilating the edge image in (a) by a disk shape morphological operator. (c) Superimposing the cell centers in Fig. 3(b) on the dilated image in (b) as global minima. (d) Segmented cell regions applying the watershed segmentation to (c). (e) Segmented cell boundaries in (d) and cell centers in Fig. 3(b) are superimposed on the original image in Fig. 1.
previous work we explained cell localization in the form of an inverse problem. In this paper cell boundary segmentation was addressed as an inverse problem represented in the form of a deconvolution problem. Our proposed method solves the segmentation problem by optimally constructing cell regions associated with cell centres using an optimized watershed method. This is a generic method, capable of segmenting different cell types having arbitrary shapes. R EFERENCES [1] D. Comaniciu, D. Foran, and P. Meer, “Shape-based image indexing and retrieval for diagnostic pathology,” International Conference on Pattern Recognition, pp. 902–904, 1998. [2] D. Comaniciu and P. Meer, “Cell image segmentation for diagnostic pathology,” Advanced algorithmic approaches to medical image segmentation: State-of-the-art applications in cardiology, neurology, mammography and pathology, pp. 541–558, 2002. [3] E. Campo and E. Jaffe E, “Mantle cell lymphoma,” Arch. Pathology Lab. Med., vol. 120, no. 1, pp. 12–14, 1996. [4] I. Bauman, R. Nenninger, H. Harms, H. Zwierzina, K.Wilms, A.C. Feller, V.T. Meulen, and H.K. Muller-Hermelink, “Image analysis detects lineage-specific morphologic markers in leukemia blast cells,” American Journal of Clinical Pathology, vol. 105, no. 1, pp. 23–30, 1995. [5] J.M. Geusebroek, A.W.M. Smeulders, and F. Cornelissen, “Segmentation of cell clusters by nearest neighbour graphs,” in Proceedings of the third annual conference of the Advanced School for Computing and Imaging, 1997, pp. 248–252.
[6] V. Meas-Yedid, F. Cloppet, A. Roumier, A. Alcover, J-C Olivo-Marin, and G. Stamon, “Quantitative microscopic image analysis by active contours,” in Vision Interface Annual Conference 2001 - Medical Applications, 2001. [7] J. Kittler and J. Illingworth, “Minimum error thresholding,” Pattern Recognition, vol. 19, no. 1, pp. 41–47, 1986. [8] N. Otsu, “A threshold selection method from gray-level histograms,” IEEE Transactions on Systems, Man, and Cybernetics, vol. 9, no. 1, pp. 62–66, 1979. [9] K. Wu, D. Gauthier, and M. Levine, “Live cell image segmentation,” IEEE Transactions on Biomedical Engineering, vol. 42, no. 1, pp. 1–12, 1995. [10] T. Markiewicz, S. Osowski, L. Moszczyski, and R. Satat1, “Myelogenous leukemia cell image preprocessing for feature generation,” in 5th International Workshop on Computational Methods in Electrical Engineering, 2003, pp. 70–73. [11] N. N. Kachouie, P. Fieguth, J. Ramunas, and E. Jervis, “Probabilistic model-based cell tracking,” International Journal of Biomedical Imaging, vol. 2006, pp. 1–10, 2006. [12] N. N. Kachouie, P. Fieguth, J. Ramunas, and E. Jervis, “A statistical thresholding method for cell tracking,” in IEEE International Symposium on Signal Processing and Information Technology, 2006, pp. 222–227. [13] N. N. Kachouie, P. Fieguth, and E. Jervis, “Stem-cell localization: A deconvolution problem,” in Annual International Conference of the IEEE Engineering in Medicine and Biology Society, 2007, pp. 222– 227.
378