Recent Researches in Circuits, Systems, Communications and Computers
Wavelet features selection approach for nondestructive Fusarium corn kernels recognition using spectral data processing PLAMEN DASKALOV, TSVETELINA DRAGANOVA, VIOLETA MANCHEVA, RUSIN TSONEV Department of “Automatics, information and control engineering” University of Rousse 8 Studentska Str., 7017 Rousse, BULGARIA
[email protected] http://www.uni-ruse.bg/faculties/ef/automation/site/index_en.htm Abstract: An approach for Fusarium diseased corn kernels recognition based on wavelet continuous transformation and probabilistic neural network (PNN) classification is presented in the paper. The near infrared diffuse reflectance characteristics are used as base for features extraction. The spectral data are fitted using continuous wavelet mexican hat transformations and their parameters are used for classification features. The range of the wavelet parameters “scale” and “time” are defined for seven most popular corn kernels variety in Bulgaria. A PNN classifier is created using wavelet coefficient Ca,b. The range of the PNN classifier smoothing parameter σ is determined experimentally. The classification accuracy is in the range of 75 to 100%. Key-Words: Wavelet, Corn kernels, Fusarium disease, NIR spectral data, Recognition near infrared spectroscopy (NIR) is used for assessment the corn kernels into two classes – healthy and diseased. The power of near infrared spectroscopy includes nondestructive qualitative and quantitative analysis [4,6,8]. In many cases, the most distinguished information is hidden in the frequency content of the signal. Fourier transform is a reversible transform, which goes back and forward between the raw and processed (transformed) signals. However, either of them is available at any given time. That is, no frequency information is available in the time-domain signal, and no time information is available in the Fourier transformed signal. The natural question that comes to mind is that is it necessary to have both the time and the frequency information at the same time. Fortunately, wavelet transform is capable of providing the time and frequency information simultaneously. Especially, the width of the window is changed as the transform is computed for every single spectral component, which is probably the most significant feature of the wavelet transform. Wavelet analysis generates an estimate of the local frequency content of a signal by representing the data using a family of wavelet functions that vary in scale and position. By using wavelet analysis, we can identify locally periodic trends in the signal. Therefore, this method is applied to analyze signals more and more [7,11]. In this paper we describe the use of wavelet transformation and NIR reflectance spectral data processing for recognition of healthy and Fusarium diseased corn kernels. Quality of maize seeds is determined by a number of quality indicators, regulated in Bulgarian Standards [1].
1 Introduction Fusarium disease, caused by several Fusarium spp., is one of the major fungal diseases of cereals worldwide [9]. Fusarium verticillioides is the most significant, damaging and common pathogen in Bulgaria. Three traditional diagnostics methods for identification of Fusarium spp. are used in Bulgaria. The first is based on visual assessment by expert. The second one is based on chemical analysis and the third is based on biology analysis of micro- and macro-morphological features of the fungal. Some other methods like fluorometric analysis, gas and liquid chromatography are reliable and accurately. The basic disadvantages of these destructive and non-destructive methods of detection are time consuming, requires highly skilled experts and each method varies in the requirements for technical investments. The comparative analysis indicate that the computer systems using image processing and spectral characteristics processing are the most common applied methods in precision farming and agriculture. The Fusarium disease causes not only external but also internal changes in the corn kernels. The external changes are alterations in the shape (underdeveloped, wizened) and colors of the corns. Usually the diseased corns have grayish-white or normal color with spots and coatings with rose-red nuance. The internal changes in the Fusarium diseased corn kernels are connected with the amount and form of moisture in the kernels. The computer systems using image processing assess only the visible corn kernels changes. It is not enough to evaluate the internal quality of the kernels. Therefore
ISBN: 978-1-61804-056-5
172
Recent Researches in Circuits, Systems, Communications and Computers
diseased corn kernels of each corn variety was used to obtain the classification features. The test set (20 spectra from 20 healthy and 20 spectra from 20 diseased corn kernels of each corn variety) was used to test the accuracy of Fusarium verticillioides corn kernels recognition by NIR spectroscopy and wavelet transformation. All procedures are repeated for each side of the corn kernels – the side of the germ and the other side.
According to Bulgarian Standards [2] allowed percentage of infected seeds in a sample is up to 5%. The purpose of this article is to propose a method for effective classification of healthy and Fusarium infected corn kernels, which cover requirements of the Bulgarian quality standards and to determine the values of wavelet parameters “scale - a”, “time - b”, coefficient Ca,b and probabilistic network smoothing factor for all corn variety.
2.2. Instrumentation and NIR reflectance spectra Spectral characteristics were obtained by spectrophotometer Ocean Optics in the visible and near infrared spectral area of 456 to 1140 nm. For each of the varieties have taken the spectral characteristics of intensity (Intensity) of 50 healthy and 50 infected grains for both sides – germ side and the other side. Total of 100 characteristics of healthy grains (50 - of the germ side and 50 of the other side) and 100 characteristics of contaminated grains (50 - of the germ side and 50 of the other side). The spectral characteristics of two corn kernels varieties are shown in Fig. 2. The characteristics of the other five varieties look similar.
2 Materials and methods 2.1 Corn samples Images of healthy and Fusarium verticillioides diseased corn kernels are shown in Fig. 1.
а)corn variety Ruse 424 Fig. 1. Images of corn kernels: a) healthy, b) Fusarium verticillioides diseased Seven varieties of corn kernels were examined – Knezha 308, Knezha 436, Knezha 613, Knezha 620, 26A, XM87/136 and Ruse 424. They have been certified by the Maize Institute in the town of Knezha, Bulgaria since 2008. The corn kernels samples include Fusarium diseased and healthy corn kernels from the most popular variety corn kernels in Bulgaria. The expert assesses the variety of corn kernel – healthy or diseased and determines the variety of Fusarium species - Fusarium verticillioides. The set of samples was split into two subsets – train and test sets. The train set which includes 30 spectra from 30 healthy and 30 spectra from 30
ISBN: 978-1-61804-056-5
b) corn variety Knezha 613 Fig. 2 Spectral characteristics of intensity of 50 healthy and 50 Fusarium diseased corn kernels
173
Recent Researches in Circuits, Systems, Communications and Computers
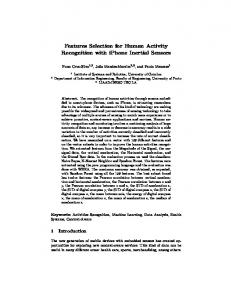
kernels, in the left side. The red line shows the values of mean coefficients Cab in the right side. Fig. 5 and Fig. 6 are for the corn variety Kneja 308, germ side and respectively for b = 81 and for b = 95.
2.3. Wavelets transformations A wavelet is a mathematical function that can decompose a signal with a series of averaging and differencing calculations. They are able to differentiate and preserve details at various scales or resolutions. Continuous wavelet transform (CWT) of a time-signal f(t) is defined by [12]. 1 ∞ t −b dt ∫ f (t )ψ a −∞ a ψ
(1) scales a
Fψ (a ,b ) =
Absolute Values of Ca,b Coefficients for a = 1 2 3 4 5 ...
(t )
The quantity a ,b given in the definition is referred to as the wavelet function. The mexican hat family was used as a wavelet function. This function:
(
)
2 2 −1 / 4 1 − x 2 e − x / 2 ψ (x ) = π 3
(2) is proportional to the second derivative function of the Gaussian probability density function.
248 235 222 209 196 183 170 157 144 131 118 105 92 79 66 53 40 27 14 1
100
scales a
equivalent to the inverse of the frequency. The definition Fψ (a ,b )
is the correlation coefficient
between the wavelet function f (t )
ψ a ,b (t )
and the timeψ
600
700
Absolute Values of Ca,b Coefficients for a = 1 2 3 4 5 ...
while the scale variable
a expands or compresses the wavelet function ψ a ,b (t ) . Compared to Fourier transform, the scale variable a is
also suggests that
300 400 500 time (or space) b
Fig. 3. CWT coefficients – healthy corn kernels.
The position variable b shifts the wavelet function along
the time axis t of f (t )
200
(t )
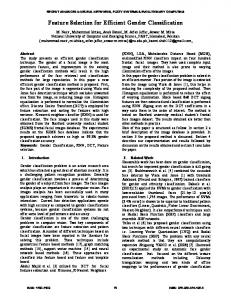
signal at the scale a and position b of a ,b . The continuous wavelet transform was applied to the spectral reflectance data from healthy and Fusarium diseased corn kernels. A Matlab program was developed using Matlab R2007 (The MathWorksInc., Natick, MA, USA) for wavelet mathematically realization. CWT was applied to these signals to calculate the
248 235 222 209 196 183 170 157 144 131 118 105 92 79 66 53 40 27 14 1
100
200
300 400 500 time (or space) b
600
700
Fig. 4. CWT coefficients – Fusarium diseased corn kernels.
F (a ,b )
, which were then displayed as a coefficients ψ grey-scale map with the vertical and horizontal axes denoting respectively the scale a and position b , which is equivalent to time t , as shown in Fig. 3 and Fig. 4. Although there is general similarity between them, subtle differences are clearly visible at scale a in range of 14 to 80 and in time range from 40 to 250. It is very important to define the values of a and b in which a maximum of the classification accuracy is achieved. The values of b are obtained from Discriminating power, parameter in SIMCA [5]. For these values of b and for all range of scale a the percentage of correct recognition is achieved for both training samples – healthy and Fusarium diseased. This is shown on Fig. 5 and Fig. 6, where with green line are the values of correct percentage for healthy and with blue line – for diseased
Разпознати царевични семена, %
60
80
40
60
20
∆ C a ,b
ISBN: 978-1-61804-056-5
Резултати за правилно разпознат и ц аревични семена при b=... 100
40
0 0
50 50
100 100
150 150 scale а
200 200
250 250
0 300 300
Fig. 5 The percentage of correct recognition for training samples – healthy and Fusarium diseased, and mean coefficients Cab for the corn variety Kneja 308, germ side and b = 81
174
Recent Researches in Circuits, Systems, Communications and Computers
Резулт ати за правилно разпознати ц аревични семена при b=...
Table 1
100
b
50
50
∆C
67 81 95 301
a ,b
Разпознати царевични семена, %
100
0 00
50
100 100
150 150 scale а
200 200
0 300 300
250 250
Range of scale a for fixed value of b Corn variety Kneja 308 Range of scale a Other side of the Germ side of the kernel kernel healthy diseased healthy diseased
328
9÷11 7÷18 24÷41 64÷175 10÷141
607
14÷47
For all corn varieties the results are similar. The obtained results show that the maximum of the coefficients Cab does not match to the maximum of the correct recognition in the range of scale a. Therefore the range of scale a where the percent correct recognition for the kernels from the training samples is 100 are used to define the value of a. This is shown in Table 1. The empty cells in the columns for diseased kernels means that there the percent correct recognition is less than 100 and this range it is not used. From these ranges we determine the value of “scale a” for each value of parameter “time b”. The coefficients Cab are calculated for each corn kernel (germ and the other side) for determined values of a and b for all corn varieties.
18÷211
-
18
-
21÷48
-
21
2÷8
3
-
92
326
7÷27 43÷84 92÷123
-
3÷25 1÷25
1÷24
133÷256
222
-
2÷17
117÷236
8
300
5÷106
7÷9
5÷186
5÷16
330
6÷140
-
3÷6
360
48÷136
-
5÷11 66÷174 76÷162
3 1 8 7 6
3÷20
76
340
46÷95
-
-
75
47
45÷64
45
307
14÷15 29÷41
-
11÷26 30÷44 -
66 297
5÷25 39÷151 77÷129 17÷59
2
182 1
4
6
Corn variety Kneja 613 3÷13 3÷21
63
3
2
3÷29 88÷102 85÷92
196
84
8
Cab
246
a) Germ side of corn kernel Fig.7. Cab coefficients for corn variety Kneja 308, b=67 and a=13
ISBN: 978-1-61804-056-5
-
-
4
0
13 8 33 24
-
5
-2
13÷18 23÷26 33 -
38
332 597
6
-4
12÷20 8÷27 23÷34 6÷213
-
Corn variety Kneja 620
7
-6
-
Corn variety Kneja 436
Fig. 6. The percentage of correct recognition for training samples – healthy and Fusarium diseased, and mean coefficients Cab for the corn variety Kneja 308, germ side and b = 95
0 -8
Defined value of a
175
14÷20 37÷56 78÷79 97÷125 148÷25 2 6÷35 72÷88
75÷149 Corn variety 26A 22÷50
6÷8 11÷43 Corn variety Ruse 424 5÷22 17÷20 5÷189 -
65÷174 25÷54 Corn variety XM87/136
29
17 5
-
77 25
-
7÷19
4÷28
14
-
49÷52 59÷256
73÷76
148
31÷60 -
105÷239
3 107÷115 122÷179
31
Recent Researches in Circuits, Systems, Communications and Computers
(
)(
− x − x(i ) t x − x(i ) j j p(x | si ) = ∑ exp m/ 2 m 2 2σi (2π) σi | si | j =1 1
7
6
5
where
p(x | si )
ni
2
1
-2
0
2
4
6
8
10
12
Cab
x (i )
pr (si | x ) =
b) Other side of corn kernel Fig.7. Cab coefficients for corn variety Kneja 308, b=67 and a=13
where Red line is for diseased corn kernels and green – for healthy corn kernels. Two classes of corn kernels – healthy and diseased are not clearly separated. The results for the others corn kernel varieties are similarly.
p(x | si ) pr (s i ) p (x )
pr (si | x )
(4)
, i=1,2,…..k is the priori PDF of the
pattern in classes to be separated; p (x )
pr (s i )
is priori
probabilities of the classes; is assumed to be constant. The decision rule is to select class Si of the fault type, for
which pr (Si | x ) is maximum. The variable σ is a smoothing factor that, in effect, determines the Gaussian window width. For the two– dimensional input case, a small value of σ gives distinct modes corresponding to the locations of training samples [10]. A smoothing factor value σ=5 was selected using the criterion of percent classification of the training dataset in range from 0.05 to 10.
2.4. Classification procedure The coefficients Ca,b have overlapped values therefore probabilistic classifiers are appropriate for this classification procedure. One of these classifiers is a probabilistic neural network (PNN) which is used for classification of the corn kernels. The most important advantage of PNN is the simple structure, training manner and only one free parameter, the smoothing factor, which have to be adjusted by the user and this factor can be adjusted at run time without the requirement of network retraining. The PNN has three layers. When an input is presented, the first layer computes distances from the input vector to the training input vectors, and produces a vector whose elements indicate how close the input is to a training input. The second layer sums these contributions for each class of inputs to produce a vector of probabilities as its net output. Finally, an compete transfer function on the output of the second layer picks the maximum of these probabilities, and produces a 1 for that class and 0 for the other classes. The neural network has 1 hidden layer, 3 input nodes, and 2 outputs. The input node corresponds to the mean wavelet coeffient for both of classes – healthy and Fusarium diseased corn kernels. The outputs correspond to the two classes healthy and diseased corn kernels. A winner – take – all decision rule (largest output wins) gave the expected classification. The activation function of a neuron, in the case of the PNN, is statistically derived from estimates of probability density functions (PDFs) based on training parameters [3]. Estimator for the PDF is:
ISBN: 978-1-61804-056-5
(3)
set si, corresponding to the type of fault; j =jth exemplar pattern or training pattern belonging to class si, type of fault; ni is the cardinality of the set of patterns in class si; m is total number of training patterns; σi is smoothing parameter. The summation layer is used to compute the sum from the previous layer:
3
-4
is the probability of vector x occurring in
4
0 -6
)
3. Results Summary of classification results are presented in Table 2. The Nc is the number of corn kernels which are correct recognized, Total_class_samples – the total number of corn kernels in the sample and True Positive (TP) is calculated based on the following equations:
TruePositive =
Nc .100,% Total _ class _ samples . (5)
This parameter TruePositive is calculated for each of the corn kernels varieties, for each side of the kernel (germ and the other side), for each class – healthy and diseased, for determined values of wavelet parameters “scale a” and “time b” and for PNN smoothing factor value σ=5. The achieved percentage of correct recognition is in range from 75 to 100%. The grey rows in Table 2 show the values of the parameters a and b which allowed to achieve the percentage of correct recognition covered the requirements of the Bulgarian standards.
176
Recent Researches in Circuits, Systems, Communications and Computers
XM87/136
Ruse 424
26А
Kneja 620
Kneja 613
Kneja 436
Kneja 308
corn variety
Table 2
Summary of classification results
4 Conclusion
TruePositive for the test samples, % Value of a and b b=67 a=13 b=81 a=8 b=95 a=33 b=301 a=24 b=328 a=18 b=607 a=21 b=38 a=3 b=326 a=92 b=63 a=3 b=196 a=1 b=222 a=8 b=300 a=7 b=330 a=6 b=360 a=76 b=340 a=75
Other side of the kernel healthy diseased 100 85
The results show that the proposed method is effective for classification of healthy and Fusarium infected corn kernels. The proposed approach based on wavelet continuous transformation and probabilistic neural network (PNN) classification classifies the corn kernels with classification accuracy in the range from 75 to 100. The wavelet parameters “scale - a”, “time - b” and coefficient Ca,b influence of the corn variety. The probabilistic network smoothing factor σ=5 is the optimal value for all corn variety. Determined wavelet parameters “scale - a” and “time - b” and probabilistic network smoothing factor σ cover requirements of the Bulgarian quality standards.
Germ side of the kernel healthy diseased 95 100
75
80
100
90
90
80
100
100
100
85
100
95
100
80
95
80
100
75
100
75
85
95
100
100
95
95
100
85
100
90
100
95
100
100
60
45
90
100
95
100
100
100
100
100
95
95
100
100
100
100
100
85
95
95
100
90
b=47 a=45
100
55
100
100
b=307 a=29 b=66 a=17 b=297 a=5 b=332 a=77 b=597 a=25 b=84 a=14 b=182 a=148 b=246 a=31
100
80
100
85
100
85
100
100
95
90
100
95
100
100
100
95
100
80
100
85
95
75
100
100
100
80
100
100
100
90
95
100
ACKNOWLEDGEMENT The study was supported by contract № BG051PO0013.3.04/28, "Support for the scientific staff development in the field of engineering research and innovation”. The project is funded with support from the Operational Program "Human Resources Development" 2007-2013, financed by the European Social Fund of the European Union. References:
The results show that the linear classifier do not recognized the corn kernels from class Fusarium diseased with not so high classification accuracy 93,3%. The PNN classifier recognized all corn kernels (healthy and Fusarium diseased) better than the linear.
ISBN: 978-1-61804-056-5
177
[1.] BDS 529-84. Cereal grains, 1985. [2.] BDS 14852-79. Methods for determining the damage from pests and diseases. 1980. [3.] Bose, N.K., Liang P. (1998). Neural network fundamentals with graphs, algorithms and applications. Tata – McGraw Hill. [4.] Cassells J.A., Reuss R., Osborne B.G., Wesley I.J., (2007). Near infrared spectroscopic studies of changes in stored grain. J. Near Infrared Spectrosc., 15, 161 – 167. [5.] Daskalov P., Ts. Draganova, V. Mancheva, R. Tsonev, Assessment of corn variety influence to Fusarium disease diagnostic using spectral analysis and statistical approach. Proceedings of University of Rousse, Vol 49, 3.1, 2010, pp.119124. [6.] Delwiche S. R., Gaines C. S., (2005). Wavelength selection for monochromatic and bichromatic sorting of fusarium-damaged wheat. Applied Engineering in Agriculture, Vol. 21(4), 681−688 [7.] Koger,C., Bruce,L., Shaw,D., and Reddy,K. (2003). Wavelet analysis of hyperspectral reflectance data for detecting pitted morning glory (Ipomoealacunosa) in soybean (Glycinemax). Remote Sensing of Environment, 86,108–119. [8.] Mahesh, S., Manickavasagan A., Jayas D.S., Paliwal J., White N.D.G., (2008). Feasibility of near-infrared hypespectral imaging to differentiate Canadian wheat classes. Biosystem Engineering, 101, 50-57. [9.] Munkvold, G.P., Desjardins A.E.. (1997). Fumonisins in maize. Can we reduce their occurrence? Plant disease, 81, 556 – 564. [10.] Specht, D. F., (1996). Probabilistic neural networks and general regression neural networks. Fuzzy Logic and Neural network Handbook, ed. C.H. Chen, ch. 3. New York: McGraw–Hill, Inc. [11.] Vetterli M., (2001). Wavelets, Approximation, and Compression, IEEE Signal Processing Magazine, 59-73 [12.] Xu,G., Hon-fu Y., and Wa-zhen L., (2000). Development of modern near infrared spectroscopic techniques and its applications. Spectroscopy and Spectral Analysis, 20, 134–142.