MDSS-UELPA is an online system and allows for more physiological, psychological ... Web-based, Biometric Mouse, Decision Support System for User's Emotional and ..... software. The scroll wheel is a rather specific mouse element, and its use can illustrate the actions of a ... http://ivanlef0u.free.fr/repo/windoz/hooking/.
WEB-BASED BIOMETRIC MOUSE DECISION SUPPORT SYSTEM FOR USER’S EMOTIONAL AND LABOUR PRODUCTIVITY ANALYSIS A. Kaklauskas, E. K. Zavadskas, M. Seniut, M. Krutinis
G. Dzemyda, S. Ivanikovas, Institute of Mathematics and Informatics, Lithuania
Institute of Internet and Intelligent Technologies, Vilnius Gediminas Technical University, Vilnius, Lithuania
V. Stankevič, Č. Šimkevičius, A. Jaruševičius Semiconductor Physics Institute, Vilnius, Lithuania ABSTRACT In order to increase the efficiency of employees’ activities, a Web-based Biometric Mouse Decision Support System for User’s Emotional and Labour Productivity Analysis (MDSS-UELPA) was developed by the authors. MDSS-UELPA consists of seven subsystems: Data Capture and Collection Subsystem, Feature Extraction Subsystem, Database Management Subsystem, Model-base Management Subsystem, Equipment Subsystem, e-Self-Reports Subsystem and Graphical Interface. MDSS-UELPA is an online system and allows for more physiological, psychological and behavioural data to be generated from a larger pool of users for further analysis and research. Data is accumulated in individual user modules based on the user’s mouse movements, palm state and e-self-reports. The basic assumption was that MDSS-UELPA could successfully model user behaviours on the basis of the above-mentioned physiological, psychological and behavioural data. MDSSUELPA is briefly analysed in this paper.
KEYWORDS Web-based, Biometric Mouse, Decision Support System for User’s Emotional and Labour Productivity Analysis, Subsystems, Historical Information
1.
between humans in social situations. There has been increasing interest in human-computer interaction research in building emotionally intelligent interactive systems that can express and respond to human emotions [8]. One of the challenges in building emotionally intelligent systems is the automatic recognition of affective states. Humans use different sources
INTRODUCTION
The ability to recognize, interpret and express emotions plays a key role in human communication and increasingly in human-computer interaction [15]. Recent research could demonstrate [10] that humans have an inherent tendency to interact with computers in a natural and social way, mirroring interactions 69
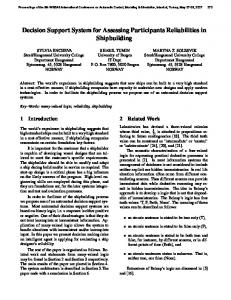
of information to assess a person’s emotions, including causal information context and individual traits, as well as information on the person’s recognizable bodily reactions [16]. There exists a broad field of behavioural methods for the measurement of affect: facial expressions, voice modulation, gestures, posture, cognitive performance, cognitive strategy, motor behaviour (e.g. hand muscles, head movement), etc. Behavioural measurement methods are based on the fact that the body usually responds physically to an emotion (e.g. changes in muscle tension, coordination, strength, frequency) and that the motor system acts as a carrier for communicating affective state. Especially promising for these methods is that humans also use many of these signals in everyday life to judge the affective state of other people. Existing methods for measuring affect all have a number of drawbacks or are not applicable in the field of human-computer interaction [15]. Biometric mouse is used in various human activities (Figure 1). However, the most emphasised is user identification. User identification using mouse movement parameters is developed by different researchers [1–6, 9, 11–13].
Analysis (MDSS-UELPA) has been developed to capture and analyse parameters useful for the evaluation of user’s emotional and labour productivity state. To track mouse events the global system hook was used. A reusable class library developed by Michael Kennedy [7] was used for mouse event tracking.
Figure 1. The biometric mouse developed by the authors MDSS-UELPA consists of seven subsystems:
In our research, we develop a Web-based Biometric Mouse Decision Support System for User’s Emotional and Labour Productivity Analysis (MDSSUELPA) able to analyse data from biometric mouse usage and e-self-reports. We believe that different biometric parameters, including physiological (skin conductance, amplitude of hand trembles, skin temperature), psychological (e-self-reports) and behavioural/motor-behavioural (mouse pressure, speed of mouse pointer movement, acceleration of mouse pointer movement, scroll wheel use, right- and leftclick frequency), correlate with the user’s emotional state and labour productivity.
2.
•
Data Capture and Collection Subsystem;
•
Feature Extraction Subsystem
•
Database Management Subsystem;
•
Model-base Management Subsystem;
•
Equipment Subsystem;
•
e-Self-Reports Subsystem;
•
Graphic Interface.
The subsystems are briefly analysed below. The collection of data by the Data Capture and Collection (DCC) Subsystem is handled by a background process and therefore hidden from the user. The DCC Subsystem is enables the remote visualization of a user activity and record this information for capture of user’s real time behavioural information. When a user works with a computer, all measured parameters are captured and stored in a CSV format in an excel file as raw data. Raw data consists of mouse clicks and movements, as well as moments when a palm simply rests on the mouse. Each time the user clicks and moves the mouse or holds his/her palm on the mouse, the DCC Subsystem collects and stores the raw data respectively in a .csv file. Any event of mouse use is recorded, whether it is a move,
WEB-BASED BIOMETRIC MOUSE DECISION SUPPORT SYSTEM FOR USER’S EMOTIONAL AND LABOUR PRODUCTIVITY ANALYSIS
Using a biometric mouse and its tracking, e-selfreports, it is possible to determine user’s labour productivity and emotional state. Different biometric mouse tracking and palm parameters can be used for this purpose. Web-based Biometric Mouse Decision Support System for User’s Emotional and Labour Productivity
70
With biometric mouse movement, there are several features that are stored for later comparison and analysis and which can be used to develop a user’s labour productivity and emotional state model. Currently, the DCC Subsystem collects data on the following parameters for correlations with user’s emotional and labour productivity state: • mouse pressure when a user presses his/her mouse and a button (power sensors); • electrogalvanic skin conductance (electrogalvanic skin response sensors); • skin temperature (thermester); • speed of mouse pointer’s movement; • the acceleration speed of mouse pointer’s movement; • amplitude of hand tremble; • scroll wheel use; • right- and left-click frequency; • idle time.
drag and drop, a click (pressed or released) or simply palm held on the mouse. Time of the event in milliseconds is recorded. X and Y coordinates of the mouse pointer on the screen are recorded. A text file is being generated in a CSV format continually. When the raw data is already captured, it is then processed and displayed in various graphs. Each curve is described by the following set of features: size, length, speed of acceleration, curvature, etc. Tracking the mouse events it is possible to determine the coordinates of mouse pointer on screen when the mouse is moving, the coordinates of mouse clicks and the parameters of scrolling. These are the basic mouse events, but these parameters are not informative enough to determine peculiarities of mouse motion. The speed of mouse pointer is the distance covered by the pointer during a fixed period of time. It is possible to use Euclidean or Minkowski distance. The acceleration is calculated as difference between the current speed, and the speed measured during the previous time period. Hand shaking parameter indicates the oscillation of the mouse pointer. This parameter is calculated as follows: •
Ten values of mouse pointer’s coordinates are stored.
•
The differences between neighbouring coordinate values are calculated.
•
The minimum and the maximum differences are estimated.
•
If the minimum and the maximum differences are of different signs, then the average value of stored coordinate values is calculated and the maximum deviation from the average is estimated.
•
If the deviation is small enough, then we treat the movement of the pointer as shaking.
•
The value of shaking parameter can be changed according to the user and the type of mouse.
Combination of this method with other methods (e. g. voice stress analysis, eye tracking) can provide very precise tool for evaluation of user’s emotional state and labour productivity. Another possible way to use MDSS-UELPA is to recommend a user to take a break or to have a rest when he/she is tired or nervous and when the work is not efficient. Also, it is possible to analyse the emotional state of students during tests or examinations. It is especially important in e-learning and during remote e-examinations. The Feature Extraction (FE) Subsystem receives the raw data from the DCC Subsystem and extracts the characteristics that signify a user’s emotional and labour productivity behaviour. The Database Management Subsystem consists of nine databases: mouse pressure, electrogalvanic skin conductance, skin temperature, speed of mouse pointer’s movement, acceleration speed of mouse pointer’s movement, amplitude of hand trembles, scroll wheel use, right- and left-click frequency, idle time.
The biometric mouse is designed to enlarge the number of analysed parameters and to improve the accuracy. This biometric mouse is able to measure the temperature and humidity of user’s palm and intensity of pressing. These additional parameters give more information about the user and will help to evaluate the general emotional state and labour productivity.
The Model-base Management Subsystem consists of the following subsystems: the module for determination of the initial weight of the data and user characteristics, the module for establishment of the criteria weight, the module for development of user produc-
71
tivity and emotional state model and the module of recommendations.
amount of tracking results and hand characteristics which can be analysed by the user any time (see Fig. 4-7). This database also provides information about e-self-reports, which define self-assessment parameters of a user, such as emotional state, productivity, desire to work, temperament (choleric, sanguine, phlegmatic) and stress.
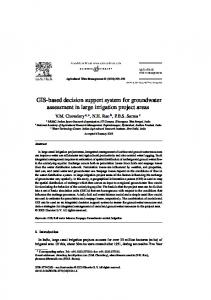
Before the biometric mouse tracking, a user should evaluate his/her emotional state, stress, desire to work and productivity on a ten-point scale and temperament (choleric, sanguine, phlegmatic) through eSelf-Report Subsystem (see Fig. 2).
When the mouse tracking start, all mouse events are recorded and mouse activity diagrams are drawn (Fig. 4-7). The refresh rate of the diagrams is 1 second. If a user does not want to see the program window, it is possible to keep the process in the background by pressing the F9 key: program window becomes invisible. F10 displays the program window again. Thus a user or a researcher can analyse the recorded data.
Monitoring of all mouse actions, hand characteristics and e-self-report produced by the user during interaction with the Graphical Interface allows generation of a unique profile, which can be used for analysis of user’s emotional state and labour productivity.
3.
CASE STUDY
Before starting the work, a user must assess his/her emotional state, productivity, stress, temperament (choleric, sanguine, phlegmatic) and must select the expected mark if it is an examination or to assess the desire to work if it is a job (see Fig. 2). It is also possible to set suitable trembling parameter. Then, biometric mouse tracking can be initiated.
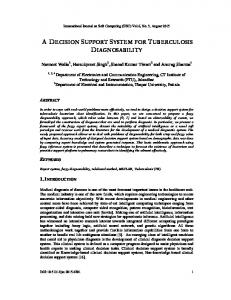
Figure 4 graphically displays the results of tracking the distance travelled by the mouse every minute within a period of one hour. This parameter can depend on the type of job or the work performed during a certain period. The X-axis shows the period, which is equal to one hour. The Y-axis shows the distance measured in pixels and covered by the mouse during a certain period. The chart shows zero mouse movement at certain times, which means that the user did not need the mouse during this period or was away from the computer. Figure 5 shows the chart of left-clicks within one hour. Here, the X-axis shows the time in minutes (the total time is one hour). The Y-axis shows the number of left-clicks within one minute. Frequent mouse clicks could mean that the user was anxious, for instance, when the query results are not displayed for long time, he/she can start clicking the button to run a certain programme or to open a file. Even while having a conversation, a user can be clicking the mouse button though not working with any particular programme. The number of mouse-clicks considerably increases playing certain computer games. Thus the analysis of mouse-clicks can provide information about programmes used, work performed and, most importantly, together with other parameters it can define the emotional state or labour productivity of a user during a certain period.
Figure 2. Before the biometric mouse tracking, the user should evaluate his/her emotional state, stress, desire to work and labour productivity on a ten-point scale and temperament A single online database records the information obtained from movement tracking, hand characteristics and e-self-report. Each user can view above information. Figure 3 shows one of such reports. Users can use MDSS-UELPA for longer periods. Therefore, the database accumulates sufficient 72
Figure 3. A typical report on user tracking, hand characteristics and e-self-report
Figure 4. The results of tracking the distance travelled by the mouse in one hour
Figure 5. The diagram of left-click tracking within one hour 73
Figure 6. The results of tracking the scroll wheel use
Figure 7. The results of tracking the palm trembling when a computer mouse is held Most mouses have a scroll wheel, which allows fast and convenient navigation depending on the selected software. The scroll wheel is a rather specific mouse element, and its use can illustrate the actions of a user. The scroll wheel is the most useful in web browsing or document viewing. The chart in Figure 6 shows the results of tracking the scroll wheel use. The X-axis shows the one-hour period by minutes. The Y-axis shows the number of scroll wheel turns at a certain moment. The scroll wheel is not used frequently if the job does not require its use. This chart shows increased scrolling during a few intervals, because the user was viewing documents. Few wheel turns at certain periods could show that, for example, the user was thinking; more turns could mean that the user was simply turning the wheel pointlessly. Factors that can make a normal human hand tremble more noticeable include stress, anxiety, fatigue, with-
drawal of alcohol or certain other drugs (such as opioids), an overactive thyroid gland (hyperthyroidism), consumption of caffeine, and use of certain drugs [14]. Minor hand tremble can also be registered when someone moves the mouse automatically in small area or due to any factor different from the listed above. Figure 7 shows the results of tracking the hand tremble when a computer mouse is held. The X-axis of the chart shows a one-hour period by minutes, during which the hand tremble was tracked. The Y-axis shows the number of palm trembles at a certain moment. In the first part of research, mouse movement parameters, hand characteristics and e-self-report of different users with different emotional states and labour productivity are collected in the database. Above information should be tested for correlations with user’s emotional state and productivity. Besides,
74
some additional parameters could be added based on the accumulated data.
4.
[5] Eusebi, C.; Gilga, C.; John, D.; Maisonave, A. A Data Mining Study of Mouse Movement, Stylometry, and Keystroke Biometric Data, Proc. CSIS Research Day, Pace Univ., May 2008. [6] Gunetti, D.; Picardi, C. Keystroke Analysis of Free Text, University of Torino. [7] Kennedy, M. Global System Hooks in .NET. http://ivanlef0u.free.fr/repo/windoz/hooking/ globalsystemhook.asp.html [8] Picard, R. W. (1997): Affective Computing. The MIT Press, Cambridge, Massachusetts. [9] Kumar, S.; Rajkumar, T. S.; Zhang, J. S. Using Continuous Biometric Verification to Protect Interactive Login Sessions, School of Computing, National University of Singapore 3 Science Drive 2, Singapore 117543. [10] Reeves, B.; Nass, C. (1996). The Media Equation. How People Treat Computers, Television, and New Media Like Real People and Places. Cambridge University Press, New York. [11] Schulz, D. A. Mouse Curve Biometrics, Pacific Northwest National Laboratory, U.S. Department of Energy. [12] Villani, M.; Curtin, M.; Simone, Ngo J.; Fort, H. St.; Tappert, C. Cha, S. –H. Keystroke Biometric Recognition Studies on Long Text Input over the Internet, CSIS Pace University, Pleasantville, New York 10570. [13] Weiss, A.; Ramapanikar, A.; Shah, P.; Nobel, S.; Immohr, L. Mouse Movements Biometric Identification: A Feasibility Study, Proc. Student/Faculty Research Day CSIS, Pace University, White Plains, NY, May 2007. [14] Why does the human hand tremble? http://wiki.answers.com/Q/Why_does_the_ human_hand_tremble. [15] Zimmermann, P.; Guttormsen, S.; Danuser, B.; Gomez, P. Affective Computing. A Rationale for Measuring Mood with Mouse and Keyboard. International journal of occupational safety and ergonomics. Vol. 9 No. 4, 2003. [16] Zimmermann, P.; Guttormsen, S.; Danuser, B.; Gomez, P. Affective Computing – A Rationale for Measuring Mood with Mouse and Keyboard. Swiss Federal Institute of Technology, Zürich, Switzerland.
CONCLUSIONS
The Web-based Biometric Mouse Decision Support System for User’s Emotional and Labour Productivity Analysis (MDSS-UELPA) is under development in order to evaluate user’s emotional state (such as anger, fear, sadness, disgust, happiness, surprise, etc.) and labour productivity when he/she is using a computer. The initial stage of system development involves analysis of user’s emotional state and labour productivity only. The authors suggest improvement of validity, efficiency and usefulness of biometric mouse intelligent systems in several aspects: namely, a sufficient sample of people should participate in the research; historical experience in a specific area should be used; intelligent systems should be used for thorough analysis; and intelligent systems should be integrated with other biometric data measurement and analysis methods and tools. The aforementioned aspects to improve validity, efficiency and usefulness of biometric mouse intelligent systems were implemented in practice when developing the Web-based Biometric Mouse Decision Support System for User’s Emotional and Labour Productivity Analysis.
REFERENCES [1] Ahmed, A. A. E.; Traore, I. Detecting Computer Intrusions Using Behavioral Biometrics, Department of Electrical and Computer Engineering, University of Victoria, P.O. Box 3055 STN CSC Victoria, B.C. V8W 3P6 CANADA. [2] Bharati, S.; Haseem, R.; Khan, R.; Ritzmann, M.; Wong, A. Biometric Authentication System using the Dichotomy Model, Proc. CSIS Research Day, Pace Univ., May 2008. [3] Brodley, C. E.; Pusara, M. User ReAuthentication via Mouse Movements, Department of Computer Science, Tufts University, Medford, MA 02155 and School of Electrical and Computer Engineering Purdue University, West Lafayette, IN 47906-2035. [4] Buch, T.; Cotoranu, A.; Jeskey, E.; Tihon, F.; Villani, M. An Enhanced Keystroke Biometric System and Associated Studies, Proc. CSIS Research Day, Pace Univ., May 2008.
75