2009 Fifth International Conference on Wireless and Mobile Communications
Web Interface for Habitat Monitoring using Wireless Sensor Network
Biljana Stojkoska, Danco Davcev Faculty of Electrical Engineering and Information Technologies, University “Ss. Cyril and Methodius”, Skopje, Macedonia
[email protected],
[email protected] order to visualize the network topology and to provide the freedom to the client to change and update it dynamically. Next section of this paper positions our work with respect to the related work. Section three describes the architecture and the process of designing on the system level. The forth section explains our web interface model, while the process of implementation is in-details described in the fifth section. Section six considers the functionalities of this model. Finally, we conclude this paper in Section seven.
Abstract— In the near future, the wireless sensor networks (WSN) consisting of hundreds or thousands of small sensor devices are expected to become increasingly popular due to their low cost and easy use. As a distributed system, they are usually deployed in unattended environments and aim to collect useful information from the sensed area. In this paper, we present a web interface model for habitat monitoring using wireless sensor network, which can be used for wide range of applications. The interface we developed provides a userfriendly environment and a set of functionalities that easies the interaction between the end-users and the WSN. Our web interface is characterized with modularity, which makes applications easily extensible.
II.
Although the WSN can participate in many new and exciting application areas, in the literature there are very few modular and generic applications [4] [5]. Mote-VIEW [5] is a full-featured data analyzing application developed by Crossbow. It provides tools to the users to visualize results from a sensor network. Readings arriving from the network are stored in a relational database. The sophisticated interface is used to check the motes readings on the fly, visualize the topology, produce graphs from selected motes, check their status and export the readings to a spreadsheet. In comparison with [5], our model presents a web-based interface, which is customizable and allows the designer to present the information in different ways. It offers different statistics based on the needs of the application. Componentbased architecture used in designing the web interface is highly adaptable, which means that functionalities can be added and implemented to fulfil the demands of a particular scenario. Another generic application environment is jWebDust [4]. It is Java based application that consists of various software components that communicate with each other through well defined interfaces. New services can be developed and integrated with the modification of existing services. In contrast to jWebDust , our web interface is developed on the top of .NET framework and shows how state-of-the art technologies can be used for this purpose.
Keywords-Wireless Sensor Networks, Web interface, Habitat Monitoring, Mica motes
I.
INTRODUCTION
Wireless tiny sensors capable of observing physical phenomena, data processing and communicating, are expected to be widely used in industry, habitat monitoring, battlefield surveillance, enemy tracking, etc. During the last decade WSNs have attracted a great interest in the research community [1][2]. Most of these works are mainly focused on theoretical issues such as energy-efficient routing, data aggregation, localization, deployment, etc. The fundamental mode of WSN operation is meaningfully different from traditional networks, due to their constraints (processing power, memory space, communication range and energy resources). These unique characteristics make the development of applications not trivial. This paperwork is aimed to describe our web interface model for wireless sensor network, which is partly intended for collecting and processing environmental sensor readings, but also for creating network topology. This interface model can be used as a base for wide range of habitat monitoring applications, like greenhouse monitoring, climate control etc. Some of the functionalities provided by our web interface are real time data transfer, parsing, converting and processing the raw data. There are also modules for network configuration (sending commands directly to the nodes), network visualization, statistical data analysis, chart drawing etc. Our model is comprehensive and user friendly. In order to provide good interaction with the end-users we use cutting-edge technologies, like Silverlight from Microsoft [3]. The use of Silverlight in this project was suitable in
978-0-7695-3750-4/09 $26.00 © 2009 IEEE DOI 10.1109/ICWMC.2009.33
RELATED WORK
III.
SYSTEM ARCHITECTURE AND DESIGN
The particular, the WSN that was deployed follows a simple system architecture. All sensor nodes send their sensor readings to the base station, and the base station (sink) sends the data to the users (clients) via the Internet. Smart 157
phones or desktops represent the clients that communicate with the server. The medium through which the communication is accomplished is wireless local area network, e.g. the clients could be anywhere if they have connection to the Internet (Fig. 1). The base station serves as a link between the sensors and the clients. It can simultaneously communicate to both the sensor network and the clients.
Figure 1. Architecture of the system Figure 2. Deployment diagram
The sensor nodes are outdoor deployed and are programmed to monitor different physical phenomena. Sensors take samples at pre-defined intervals and send data to the sink. This data is stored in a database and can be analyzed and processed on demand. If rapid or undesirable changes of some crucial values are noticed (e.g. if parameters exceed the predetermined range) system should alarm about the new situation in order to prevent or fix the problem. The whole sensing data stored in the database can be accessed by users (PC or Smart phones) using web browsers. While UML (Unified Modelling Language) is an evolving standard for modelling and designing visual systems, it is rarely used for designing embedded systems [6]. We therefore encourage future developers of WSN applications to use UML, to implement object-oriented paradigm and to apply object analysis patterns in the analysis [7]. The deployment diagram shown in Fig. 2 was used as a start point in designing the WSN system, which consists of four components: sensors, sink, web server and clients (users). The software required to deploy a wireless sensor network consists of three tiers: mote tier, server tier and client tier. Motes run XMesh protocol developed by Crossbow [8], which enables low-power consumption and scalability. XServe application runs on the server tier. The client tier includes a web application that interacts with XServe and accesses the sensor network through an XML RPC command interface. In this paper we will propose a graphical web interface for managing a wireless sensor network using any computing device worldwide, connected to Internet. The user should be able to make different queries in order to access the current and past readings from different groups of motes.
IV.
MODEL OF THE WEB INTERFACE
The success of an application generally depends on its usability issue. Usability can be achieved by proper web interface design and by the implementation of the interactive techniques. Client side components are intended to deliver high quality user interface so that the usage of the system becomes easy and intuitive [9]. To fulfill these requirements, we develop a web interface model that uses state-of-the-art technologies. Additionally, our model is general, layer-based and modular. The web interface model is comprised of two Silverlight components and one web application, dependent on the Silverlight components. Microsoft Silverlight is a crossbrowser, cross-platform, and cross-device plug-in to deliver .NET based media experiences and rich interactive applications for the Web. Windows Communication Foundation WCF [10] (WSN Service) serves as a connection between the web interface and the data provider (Fig. 3). The first Silverlight component is used for data acquiring from the PostgreSQL database and displays up-to-date sensor information. Currently the only database supported by XServe is PostgreSQL database, which is an ObjectRelational Database Management System [11]. The second Silverlight component creates the topology of the sensor network on the basis of the last data stored in the database (Fig. 7). The process of retrieving the sensor data, as described earlier, includes communication with the WCF Service.
158
A.
Programming the motes and collecting the data For this project we used Berkeley MICA motes, which can be purchased from Crossbow technology [8], Inc (see Fig. 5). They are equipped with a radio module, 4 MHz microprocessor, memory, two AA batteries and a suite of sensors. The motes run under TinyOS operating system, which is primarily intended for embedded systems that have limitations and addresses its resources concurrency and resource management. TinyOS, libraries and applications are all written in NesC, which is structured, component-based language, very similar with the programming language C. The client (mote) tier consists of the cloud of sensor nodes, that run XMesh software library, which enables communication between the nodes in the WSN, and implements algorithms for efficient multi-hop routing. XMesh protocol stack is flexible and powerful platform built on top of the TinyOS operating system. The server tier is a facility that deals with buffering of data coming from the motes. The central application here is XServe. It runs on a PC and serves as the primary gateway between WSN and the applications that interact with the WSN. XServe provides services to route data to and from the network. Loadable plug-in modules and XML configuration files are used for customizing different applications wishing to interact with the network. Interaction with XServe can be done directly (terminal interface) or through a powerful XML RPC command interface.
Figure 3. Model of web interface
WCF was selected as the best practice for writing services with Silverlight [10]. As Silverlight plug-ins run completely on the client computer, Silverlight applications are isolated from the entities that are managed on the server. In other words, Silverlight cannot access a database directly; therefore service-based communication through technologies such as WCF is required. The Silverlight applications (presentation layer) are made up of a handful of user controls and styles. The presentation layer communicates with the server using asynchronous calls through WCF (Fig. 4), whereas WCF calls functions from the business layer [12]. The business layer provides data from the PostgreSQL database, using the data provider (data layer) NpgSQL [13], formats the received data and hands the data to the WCF Service. NpgSQL is a .Net Data Provider for Postgresql. It allows any program developed for .Net framework to send and receive data with a PostgreSQL server.
Figure 5. Mica motes
B. Web interface implementation The WCF Service named NpgSqlService implements the interface INpgSqlService. The interface INpgSqlService contains definitions for service contract, data contract and operation contract. A service contract specifies how an endpoint communicates to the outside world. It is a statement about a set of specific messages. A service operation is a single message exchange. Therefore, an operation contract defines the parameters and return type of a service operation. The data types a service uses must be described in metadata to enable others to interoperate with the service. The descriptions of the data types are known as the data contract, and the types can be used in any part of a message, for example, as parameters or return types. If the service is using
Figure 4. Web interface layers
V.
IMPLEMENTATION
In this section we are going to describe in details explanation of the implementation of WSN and our web interface.
159
only simple types, there is no need to explicitly use data contracts. The parsing of the packet is done in accordance with an xml configuration file, specific for each data acquisition application. If the packet fulfills the conditions, then the data are extracted from the received bytes and converted with the conversion functions given in the configuration file. For the purpose of conversion, a special library empowers the project. It is called bcParserNET and it enables executing the conversion functions retrieved as string values from the configuration file. In order that the information on the web page is up-to-date, the AJAX (Asynchronous JavaScript and XML) [14] capabilities are utilized. At a specified timer interval, an AJAX calls a specified function that checks to see if new packets have arrived. AJAX enables real time data transfer and dynamic graphs. It provides partial update of the web page e.g. the topology can be changed without causing the entire HTML page to reload. The existing tools in AJAX carry on a background conversation with the server, retrieving only the information the user needs at whatever interval the application program requires. Controlled by the users, the web site tries to establish a socket connection to XServe. The communication with XServe is based on the Serial Forwarder Protocol, which allows enterprise applications to send and receive raw data to the sensor network. As soon as the socket connection is established, the web page starts to receive data asynchronously. Since Serial Forwarder Protocol sends raw data, there is a necessity to add the functionality of parsing, converting and processing the received data on the web site. When a packet is received, it is first checked if it is a sensor type packet. VI.
Fig. 6 shows that the client can request for live stream, by checking Acquire Live Data. Before the real time data transfer starts, the user needs to make choice on the application name. The dropdown list that appears after checking shows the names of the data acquisition applications supported by XServe. The application name needs to be compatible with the data acquisition board. If the application name is not the appropriate one, the packets that are received are rejected and the web application alerts the user to check if the application name is the correct one. By clicking on the play button, the real time data transfer starts. A great advantage of this application is that it can work with any type of sensor. As long as the correct application name is selected, this project converts the received bytes in eligible and logical, and above all, informative content. The second Silverlight component was used for generating the topology of the sensor network, using available information from the database (Fig. 7). A great advantage of Silverlight that we found useful in the creation of the topology is that Silverlight C# code behind the controls generated in xml. It allowed giving features to the nodes, links and the whole network on the picture. There are user controls and code behind files which lead to the Silverlight content on the picture. The web page is enriched with the animations that Silverlight supports. The user has the freedom to add and remove the nodes, to change their position or any other attribute, to add and remove links and so on.
FUNCTIONALITIES OF THE WEB INTERFACE
From the users’ point of view, the first contact with the web page shows historical data about the sensors. The first Silverlight component named SensorDataGrid acquires data from the PostgreSQL database, through the WCF service. It shows the last data retrieved from the sensors e.g. saved in the database. This application makes an asynchronous call to the WCF Service, defines an event handler and when the retrieval of the data is completed, the event handler displays the latest sensor readings.
Figure 7. Topology control
The link Statistics (Fig. 8) leads to the web page that processes the data and delivers the required result. This module is used for calculating the maximum, minimum or average value of a specific sensor, e.g. sensor for temperature, light or voltage. The user can also provide a date, so that only the values measured after that date are included in the calculation. The last three queries are shown on the right side of the page. If no date is obtained, the web page processes all the results in the database. The client can
Figure 6. Sensor readings
160
also choose which nodes he/she wants to have results for. All the nodes can be selected or deselected. The result refers only to the values for the selected nodes.
Figure 9. The flow of the temperature changing at each second
We implemented another module to increase interaction with the system. Since WSN nodes are usually deployed in vast regions and are operating unattended, we sometimes need to know the location of a particular node. Nodes localization is one of the most challenging research topics in WSN. In the last few years, many researchers have investigated different algorithms for nodes localization. Although some of them are quite successful, there is still work to be done in this field. Even if we use localization algorithm, it rarely can predict the position without error. For this reasons, within this application, we developed an interactive module. The users can remotely send commands to the sensor nodes (such as “sound on”, “sound off”. “green led on|” etc), and nodes will take particular actions. For example, the employee in the greenhouse can send command from the smart phones (Fig. 10). This is a simple way to find lost node in a large network. This can help users for successful management of the system. Additionally, users can send commands such as “wake” or “sleep” (Fig. 11). For example, if one node runs out of battery, it can cause the network to be divided into two parts and stop operating. Hence, these commands can periodically activate or deactivate particular nodes or part of the network in order to extend the lifetime of the whole network.
Figure 8. Statistics
The last page has the ability to show how the environment conditions change with time. It can draw graphs for the selected sensor measure. The line changes with time showing the ups and downs of the selected measure. On Fig. 9, the graph shows the temperature values for the selected nodes in the selected time interval. This page is created with the help of a reusable component called ZedGraph [15]. This component is open source and is used to draw graphs for a given set of points. However, in order that we create a dynamic graph, changes needed to be made. The graph changes at each second, therefore the scale of the x axis changes and new values from the database are retrieved for the current second e.g. new points are added to the graph line. All points in the shown time interval are saved temporarily for that session so that they can be redrawn, when the graph updates. The scale of the Y axis is determined dynamically. Bearing in mind the selected nodes, the application calculates the maximum and the minimum values of the selected feature, e.g. temperature. The user has the option to save the graph as a picture. If the TextBox Since is left empty, the web page calculates the most recent data received and shows the latest data changes. Therefore, if a live stream flows, the graph will show the current data flow.
Figure 10. Smart phone controlling the WSN
161
General opinion among participans for the interface usability is positive. Interface is functional and suggestions for addind additional moduls will be included in the future project. VII. CONCLUSION In this paper, we presented a web interface model for typical wireless sensor network application. The whole system architecture was presented in details, beginning from the sensor node hardware to the management system and the web interface. By using up-to-date technologies we developed a very functional web interface for the purpose of WSN applications for habitat monitoring. The sensed data are real-time available, so the users on Internet can accomplish remote managing and controlling the network. WSN topologies can be generated by allowing users to give features and links to the nodes of the network. For future work, we intend to implement a localization algorithm in order to automate the process of topology generation.
Figure 11. Interacting with the WSN
REFERENCES
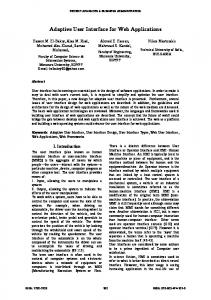
In order to identify possible drawbacks that can be repaired and redesigned, we made a simple evaluation. The web interface was tested by many users, most of whom were IT engineers and students. The questions that examine the interface usability and provide information for future upgrades are: 1. Do you think we should extend the module Statistics? 2. Are you satisfied with the way the charts are presented? 3. Do you like the colors chosen for the interface? 4. What is your opinion about Silverlight topology generator? 5. Do you consider we should automate the process of nodes localization? The X axis in (Fig. 12) represents questions with the same number from questionnaire above.
[1]
[2]
[3] [4]
[5]
[6]
[7] [8]
Interface Usability [9]
14 12 10 Number 8 of 6 answers 4 2 0
[10]
positive negative 1
2
3
4
[11] [12]
5
[13] [14] [15]
Question number
Figure 12. Results from interface usability part of questionnaire
162
I. Akyildiz, W. Su, Y. Sankarasubramaniam, E. Cayirci. A survey on sensor networks. In IEEE Communication Magazine, 40(8): 102-114, 2002. J. M. Hellerstein, W. Hong, S. R. Maden, “The Sensor Spectrum: Technology, Trends and Requirements”, SIGMOD Record, Vol.32, No. 4, December 2003; pp. 22 – 27 http://www.microsoft.com/SILVERLIGHT/ [May 18, 2009] I. Chatzigiannakis, G. Mylonas, S. E. Nikoletseas, “jWebDust : A java-based generic application environment for wireless sensor networks,” in DCOSS, 2005, pp. 376---386. M. Turon, J. Suh, MOTE-VIEW: A Sensor Network Monitoring and Management Tool, In The 2nd IEEE Workshop on Embedded Network Sensors (EmNets’05), May. 2005 S. Konrad, B.H.C. Cheng, L.A. Campbell, “Object Analysis Patterns for Embedded Systems”, IEEE Transactions on Software Engineering Vol 30, Issue 12, Dec.2004, pp. 970- 992 http://www.uml.org/ [May 18, 2009] Crossbow, Inc. http://www.xbow.com/Products/Product_pdf_files/Wireless_pdf/MIC Az_Datasheet.pdf [May 18, 2009] A. Sears, J. A. Jacko (Eds) The Human-Computer Interaction Handbook. (2nd edition) CRC Press, 2007. ISBN 0-8058-5870-9; S. Gupta “A Performance Comparison of Windows Communication Foundation (WCF) with Existing Distributed Communication Technologies,” http://msdn.microsoft.com/en-us/library/bb310550.aspx [May 18, 2009] www.postgresql.org [May 18, 2009] E. Evans, Domain-Driven Design: Tackling Complexity in the Heart of Software. Boston, MA: Addison-Wesley Professional, 2003. www.npgsql.com/ [May 18, 2009] http://www.ajax.org/ [May 18, 2009] www.zedgraph.org/ [May 18, 2009]